
Key Insights
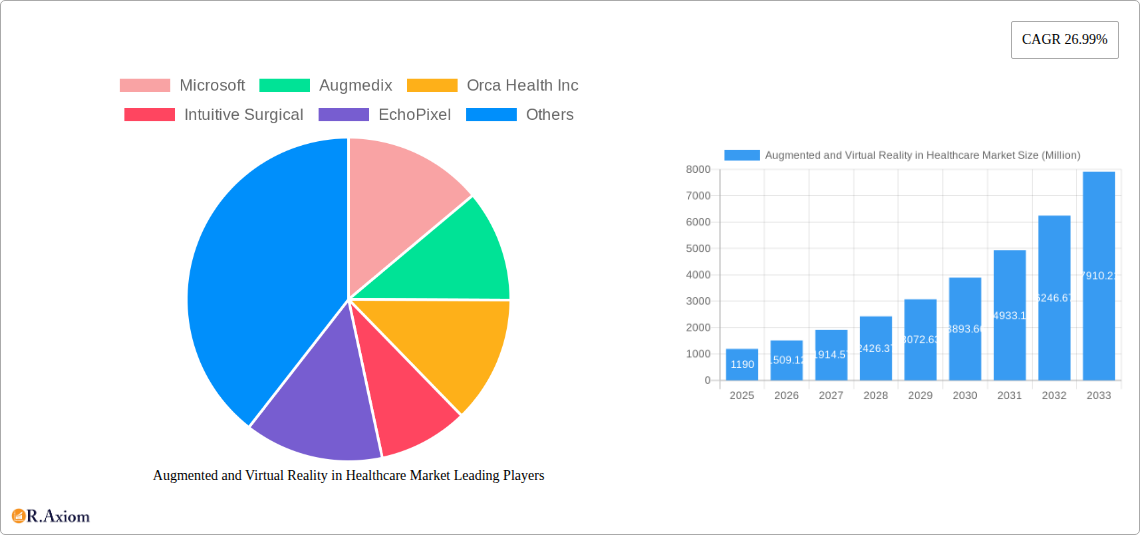
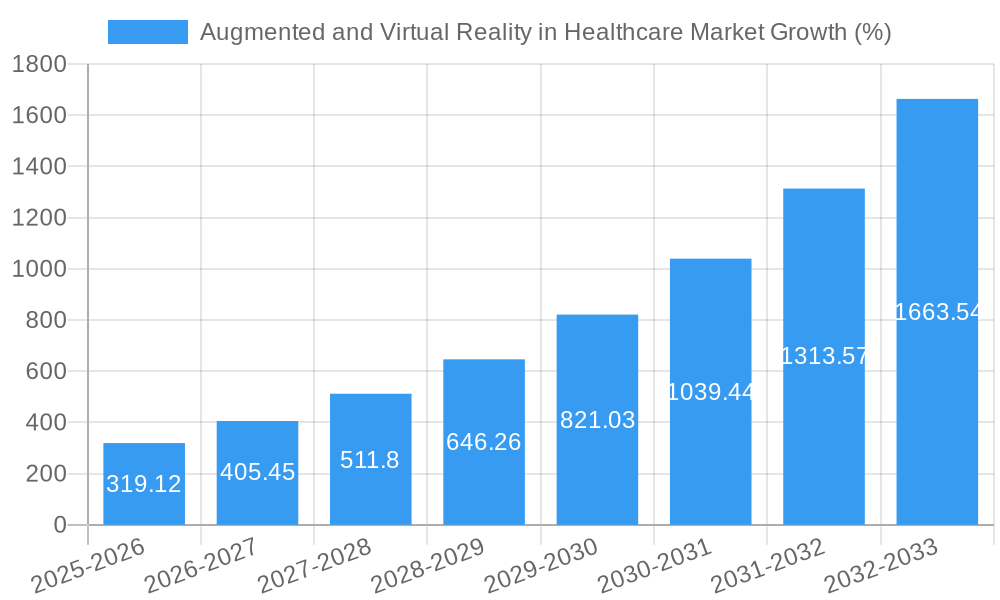
The Augmented and Virtual Reality (AR/VR) in Healthcare market is experiencing rapid growth, projected to reach $1.19 billion in 2025 and exhibiting a robust Compound Annual Growth Rate (CAGR) of 26.99%. This expansion is fueled by several key factors. Firstly, the increasing adoption of AR/VR technologies across various healthcare applications, including surgical planning, medical training, patient rehabilitation, and remote patient monitoring, is driving market expansion. The enhanced visualization capabilities of AR/VR systems improve surgical precision, reduce errors, and shorten procedure times, leading to improved patient outcomes and cost efficiencies for healthcare providers. Furthermore, the rise of telehealth and the need for innovative remote healthcare solutions further accelerate market growth, as AR/VR enables remote consultations, diagnosis, and monitoring, expanding access to care, especially in underserved areas. Technological advancements, such as the development of more compact, affordable, and user-friendly devices, are also contributing significantly to the market's growth trajectory.
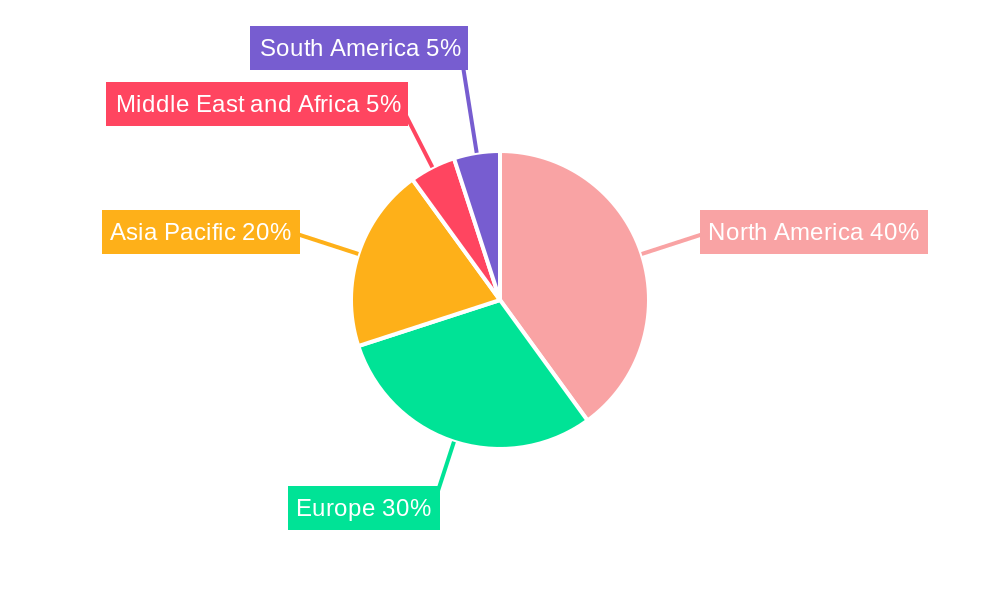
However, certain restraints limit market penetration. High initial investment costs associated with implementing AR/VR systems in healthcare facilities represent a significant barrier for smaller hospitals and clinics. Concerns regarding data security and patient privacy, particularly when handling sensitive medical information, also need to be addressed. Moreover, the need for robust regulatory frameworks and standardization to ensure the safety and efficacy of AR/VR applications in healthcare remains crucial for widespread adoption. Despite these challenges, the overall market outlook remains highly positive, driven by continuous technological innovations, expanding applications, and growing investments in the healthcare sector. The segmentation analysis reveals that hospital and clinic end-users will continue to dominate, with Head Mounted Devices (HMDs) and AR Displays holding significant market share within the technology and product segments respectively. North America and Europe are currently leading the market, but rapid growth is anticipated in Asia-Pacific regions as the technology matures and becomes more affordable.
Augmented and Virtual Reality in Healthcare Market: A Comprehensive Report (2019-2033)
This comprehensive report provides a detailed analysis of the Augmented and Virtual Reality (AR/VR) in Healthcare market, offering valuable insights for stakeholders across the industry. The report covers the period from 2019 to 2033, with 2025 as the base and estimated year, and forecasts extending to 2033. The market is segmented by end-user (Hospitals and Clinics, Research Laboratories, Others), technology (Head Mounted Devices, Handheld Devices), and product (AR Displays, AR Sensors, AR Input Devices, AR Semiconductor Components, Others). Key players analyzed include Microsoft, Augmedix, Orca Health Inc, Intuitive Surgical, EchoPixel, Augmented Pixels Inc, Siemens Healthineers, Surgical Theater, Koninklijke Philips N V, Vuzix Corporation, AccuVein Inc, and CAE Healthcare. The report projects a market value of xx Million by 2033, exhibiting a CAGR of xx% during the forecast period (2025-2033).
Augmented and Virtual Reality in Healthcare Market Concentration & Innovation
The AR/VR in healthcare market exhibits a moderately concentrated landscape, with a few dominant players holding significant market share. Microsoft, Intuitive Surgical, and Philips, for example, leverage their established presence in medical technology to capture substantial market segments. However, the market also features a number of smaller, specialized firms like Augmedix and Orca Health Inc, driving innovation with niche solutions. Market share data for 2024 indicates that Microsoft holds approximately xx% market share, followed by Intuitive Surgical at xx% and Philips at xx%. The remaining share is distributed among other players, highlighting a dynamic competitive environment.
Innovation is driven by advancements in areas such as haptic feedback technology, improved image processing, and the integration of AI. Regulatory frameworks, particularly those concerning data privacy and medical device approvals, influence market growth. The existence of alternative solutions, such as traditional simulation methods, impacts market penetration. M&A activities, though not frequent, play a role in consolidating market share. In 2024, there were xx M&A deals valued at approximately xx Million, primarily focused on acquiring smaller companies with specialized technologies. These trends, coupled with evolving end-user needs and preferences, continue to shape market dynamics.
Augmented and Virtual Reality in Healthcare Market Industry Trends & Insights
The AR/VR in healthcare market is experiencing rapid growth, propelled by several key factors. Increasing adoption of minimally invasive surgical procedures, coupled with the rising demand for improved patient outcomes and reduced healthcare costs, is a primary growth driver. Technological advancements, including the development of more comfortable and user-friendly AR/VR devices, and enhanced software capabilities, are fueling market expansion. The market penetration of AR/VR technologies in hospitals and clinics is estimated to be xx% in 2025, projected to reach xx% by 2033. Consumer preferences are shifting towards personalized and interactive healthcare experiences, further boosting the demand for AR/VR solutions. The competitive landscape is intensifying, with established players and new entrants vying for market share through strategic partnerships, product innovation, and aggressive marketing strategies. The market demonstrates a strong potential for future expansion, driven by factors such as increased investment in R&D, supportive government policies, and the growing availability of skilled professionals in the sector.
Dominant Markets & Segments in Augmented and Virtual Reality in Healthcare Market
By End-User: Hospitals and clinics represent the largest segment, accounting for xx% of the market in 2025, driven by the high adoption rate of AR/VR technologies for surgical planning, training, and patient care. Research laboratories are witnessing increasing adoption for drug discovery and development applications, while other segments, such as home healthcare, contribute to a smaller but growing portion of the market. Growth in the hospitals and clinics segment is fueled by increasing investments in medical infrastructure and the growing need for advanced healthcare solutions.
By Technology: Head-mounted displays (HMDs) currently dominate the market, due to their immersive capabilities, followed by handheld devices which offer portability and convenience. The HMD segment's dominance is largely attributable to their use in surgical simulations and training.
By Product: AR displays form the largest product segment, driven by the demand for visual aids in various medical procedures and training programs. AR sensors, input devices, and semiconductor components are also gaining traction as critical components of the overall AR/VR ecosystem. The market for AR displays is experiencing strong growth due to advances in display technology, resulting in improved resolution and image clarity.
North America holds the largest regional market share, primarily due to high healthcare expenditure, advanced medical infrastructure, and early adoption of innovative technologies.
Augmented and Virtual Reality in Healthcare Market Product Developments
Recent product innovations have focused on enhancing the realism and usability of AR/VR systems in healthcare. This includes advancements in haptic feedback technologies for improved surgical simulations, lightweight and comfortable HMDs, and AI-powered image analysis for enhanced diagnostic capabilities. These advancements offer compelling competitive advantages, improving accuracy, efficiency, and patient outcomes. The market is witnessing a move toward miniaturization and integration of AR/VR technologies into existing medical devices.
Report Scope & Segmentation Analysis
By End-User: The report segments the market into Hospitals and Clinics (projected market size xx Million in 2033), Research Laboratories (xx Million in 2033), and Others (xx Million in 2033). Each segment is analyzed for its growth drivers, challenges, and competitive landscape.
By Technology: The market is segmented into Head Mounted Devices (HMDs) and Handheld Devices, with detailed analysis of their market size, growth rates, and competitive dynamics.
By Product: The report analyzes AR Displays, AR Sensors, AR Input Devices, AR Semiconductor Components, and Others, providing insights into their respective market sizes, growth projections, and competitive dynamics.
Key Drivers of Augmented and Virtual Reality in Healthcare Market Growth
Several factors are driving the growth of the AR/VR market in healthcare. These include technological advancements leading to improved accuracy and efficiency of medical procedures; the rising demand for minimally invasive surgeries; increasing government initiatives and funding promoting the adoption of these technologies; and the growing need for improved patient care and better training for healthcare professionals. Furthermore, cost reductions in AR/VR hardware and software are making these technologies increasingly accessible.
Challenges in the Augmented and Virtual Reality in Healthcare Market Sector
The AR/VR healthcare market faces challenges, including the high initial investment costs associated with implementing these technologies; concerns regarding data security and patient privacy; and the need for regulatory approvals for medical devices. The lack of skilled professionals capable of operating and maintaining these complex systems also poses a significant hurdle. These factors collectively impact market penetration and adoption rates.
Emerging Opportunities in Augmented and Virtual Reality in Healthcare Market
Emerging opportunities lie in the expansion of AR/VR applications in areas such as remote patient monitoring, rehabilitation, and mental health treatments. Integration of AI and machine learning into AR/VR systems offers significant potential for enhancing diagnostic accuracy and treatment efficacy. The development of new and improved hardware with features such as enhanced comfort and longer battery life presents further growth opportunities.
Leading Players in the Augmented and Virtual Reality in Healthcare Market Market
- Microsoft
- Augmedix
- Orca Health Inc
- Intuitive Surgical
- EchoPixel
- Augmented Pixels Inc
- Siemens Healthineers
- Surgical Theater
- Koninklijke Philips N V
- Vuzix Corporation
- AccuVein Inc
- CAE Healthcare
Key Developments in Augmented and Virtual Reality in Healthcare Market Industry
- October 2024: Microsoft announced the release of its new HoloLens 2 headset with enhanced features for medical applications.
- July 2024: Intuitive Surgical acquired a smaller company specializing in AI-powered surgical planning software.
- March 2024: Philips launched a new AR-based training system for medical professionals. (Further key developments for other years can be added here as data becomes available.)
Strategic Outlook for Augmented and Virtual Reality in Healthcare Market Market
The AR/VR in healthcare market holds immense potential for future growth. Continued technological advancements, coupled with increasing demand for cost-effective and efficient healthcare solutions, will drive market expansion. Strategic partnerships between technology companies and healthcare providers will play a crucial role in accelerating market penetration. The focus on improving user experience, addressing data privacy concerns, and obtaining regulatory approvals will be key to unlocking the full potential of this transformative technology.
Augmented and Virtual Reality in Healthcare Market Segmentation
-
1. Technology
- 1.1. Head Mounted Devices
- 1.2. Handheld Devices
-
2. Product
- 2.1. AR Displays
- 2.2. AR Sensors
- 2.3. AR Input Devices
- 2.4. AR Semiconductor Components
- 2.5. Others
-
3. End User
- 3.1. Hospitals and Clinics
- 3.2. Research Laboratories
- 3.3. Others
Augmented and Virtual Reality in Healthcare Market Segmentation By Geography
-
1. North America
- 1.1. United States
- 1.2. Canada
- 1.3. Mexico
-
2. Europe
- 2.1. Germany
- 2.2. United Kingdom
- 2.3. France
- 2.4. Italy
- 2.5. Spain
- 2.6. Rest of Europe
-
3. Asia Pacific
- 3.1. China
- 3.2. Japan
- 3.3. India
- 3.4. Australia
- 3.5. South Korea
- 3.6. Rest of Asia Pacific
-
4. Middle East and Africa
- 4.1. GCC
- 4.2. South Africa
- 4.3. Rest of Middle East and Africa
-
5. South America
- 5.1. Brazil
- 5.2. Argentina
- 5.3. Rest of South America
Augmented and Virtual Reality in Healthcare Market REPORT HIGHLIGHTS
| Aspects | Details |
|---|---|
| Study Period | 2019-2033 |
| Base Year | 2024 |
| Estimated Year | 2025 |
| Forecast Period | 2025-2033 |
| Historical Period | 2019-2024 |
| Growth Rate | CAGR of 26.99% from 2019-2033 |
| Segmentation |
|
Table of Contents
- 1. Introduction
- 1.1. Research Scope
- 1.2. Market Segmentation
- 1.3. Research Methodology
- 1.4. Definitions and Assumptions
- 2. Executive Summary
- 2.1. Introduction
- 3. Market Dynamics
- 3.1. Introduction
- 3.2. Market Drivers
- 3.2.1. Rise in Adoption of Augmented Reality in Healthcare; Increase in Investments in Augmented Reality; Rise in Number of Start Up Companies in the Market
- 3.3. Market Restrains
- 3.3.1. High Cost of Augmented Reality Products; Data Security Concers
- 3.4. Market Trends
- 3.4.1. Head-Mounted Devices Segment is Expected to Hold a Significant Share in the Market Over the Forecast Period
- 4. Market Factor Analysis
- 4.1. Porters Five Forces
- 4.2. Supply/Value Chain
- 4.3. PESTEL analysis
- 4.4. Market Entropy
- 4.5. Patent/Trademark Analysis
- 5. Global Augmented and Virtual Reality in Healthcare Market Analysis, Insights and Forecast, 2019-2031
- 5.1. Market Analysis, Insights and Forecast - by Technology
- 5.1.1. Head Mounted Devices
- 5.1.2. Handheld Devices
- 5.2. Market Analysis, Insights and Forecast - by Product
- 5.2.1. AR Displays
- 5.2.2. AR Sensors
- 5.2.3. AR Input Devices
- 5.2.4. AR Semiconductor Components
- 5.2.5. Others
- 5.3. Market Analysis, Insights and Forecast - by End User
- 5.3.1. Hospitals and Clinics
- 5.3.2. Research Laboratories
- 5.3.3. Others
- 5.4. Market Analysis, Insights and Forecast - by Region
- 5.4.1. North America
- 5.4.2. Europe
- 5.4.3. Asia Pacific
- 5.4.4. Middle East and Africa
- 5.4.5. South America
- 5.1. Market Analysis, Insights and Forecast - by Technology
- 6. North America Augmented and Virtual Reality in Healthcare Market Analysis, Insights and Forecast, 2019-2031
- 6.1. Market Analysis, Insights and Forecast - by Technology
- 6.1.1. Head Mounted Devices
- 6.1.2. Handheld Devices
- 6.2. Market Analysis, Insights and Forecast - by Product
- 6.2.1. AR Displays
- 6.2.2. AR Sensors
- 6.2.3. AR Input Devices
- 6.2.4. AR Semiconductor Components
- 6.2.5. Others
- 6.3. Market Analysis, Insights and Forecast - by End User
- 6.3.1. Hospitals and Clinics
- 6.3.2. Research Laboratories
- 6.3.3. Others
- 6.1. Market Analysis, Insights and Forecast - by Technology
- 7. Europe Augmented and Virtual Reality in Healthcare Market Analysis, Insights and Forecast, 2019-2031
- 7.1. Market Analysis, Insights and Forecast - by Technology
- 7.1.1. Head Mounted Devices
- 7.1.2. Handheld Devices
- 7.2. Market Analysis, Insights and Forecast - by Product
- 7.2.1. AR Displays
- 7.2.2. AR Sensors
- 7.2.3. AR Input Devices
- 7.2.4. AR Semiconductor Components
- 7.2.5. Others
- 7.3. Market Analysis, Insights and Forecast - by End User
- 7.3.1. Hospitals and Clinics
- 7.3.2. Research Laboratories
- 7.3.3. Others
- 7.1. Market Analysis, Insights and Forecast - by Technology
- 8. Asia Pacific Augmented and Virtual Reality in Healthcare Market Analysis, Insights and Forecast, 2019-2031
- 8.1. Market Analysis, Insights and Forecast - by Technology
- 8.1.1. Head Mounted Devices
- 8.1.2. Handheld Devices
- 8.2. Market Analysis, Insights and Forecast - by Product
- 8.2.1. AR Displays
- 8.2.2. AR Sensors
- 8.2.3. AR Input Devices
- 8.2.4. AR Semiconductor Components
- 8.2.5. Others
- 8.3. Market Analysis, Insights and Forecast - by End User
- 8.3.1. Hospitals and Clinics
- 8.3.2. Research Laboratories
- 8.3.3. Others
- 8.1. Market Analysis, Insights and Forecast - by Technology
- 9. Middle East and Africa Augmented and Virtual Reality in Healthcare Market Analysis, Insights and Forecast, 2019-2031
- 9.1. Market Analysis, Insights and Forecast - by Technology
- 9.1.1. Head Mounted Devices
- 9.1.2. Handheld Devices
- 9.2. Market Analysis, Insights and Forecast - by Product
- 9.2.1. AR Displays
- 9.2.2. AR Sensors
- 9.2.3. AR Input Devices
- 9.2.4. AR Semiconductor Components
- 9.2.5. Others
- 9.3. Market Analysis, Insights and Forecast - by End User
- 9.3.1. Hospitals and Clinics
- 9.3.2. Research Laboratories
- 9.3.3. Others
- 9.1. Market Analysis, Insights and Forecast - by Technology
- 10. South America Augmented and Virtual Reality in Healthcare Market Analysis, Insights and Forecast, 2019-2031
- 10.1. Market Analysis, Insights and Forecast - by Technology
- 10.1.1. Head Mounted Devices
- 10.1.2. Handheld Devices
- 10.2. Market Analysis, Insights and Forecast - by Product
- 10.2.1. AR Displays
- 10.2.2. AR Sensors
- 10.2.3. AR Input Devices
- 10.2.4. AR Semiconductor Components
- 10.2.5. Others
- 10.3. Market Analysis, Insights and Forecast - by End User
- 10.3.1. Hospitals and Clinics
- 10.3.2. Research Laboratories
- 10.3.3. Others
- 10.1. Market Analysis, Insights and Forecast - by Technology
- 11. North America Augmented and Virtual Reality in Healthcare Market Analysis, Insights and Forecast, 2019-2031
- 11.1. Market Analysis, Insights and Forecast - By Country/Sub-region
- 11.1.1 United States
- 11.1.2 Canada
- 11.1.3 Mexico
- 12. Europe Augmented and Virtual Reality in Healthcare Market Analysis, Insights and Forecast, 2019-2031
- 12.1. Market Analysis, Insights and Forecast - By Country/Sub-region
- 12.1.1 Germany
- 12.1.2 United Kingdom
- 12.1.3 France
- 12.1.4 Italy
- 12.1.5 Spain
- 12.1.6 Rest of Europe
- 13. Asia Pacific Augmented and Virtual Reality in Healthcare Market Analysis, Insights and Forecast, 2019-2031
- 13.1. Market Analysis, Insights and Forecast - By Country/Sub-region
- 13.1.1 China
- 13.1.2 Japan
- 13.1.3 India
- 13.1.4 Australia
- 13.1.5 South Korea
- 13.1.6 Rest of Asia Pacific
- 14. Middle East and Africa Augmented and Virtual Reality in Healthcare Market Analysis, Insights and Forecast, 2019-2031
- 14.1. Market Analysis, Insights and Forecast - By Country/Sub-region
- 14.1.1 GCC
- 14.1.2 South Africa
- 14.1.3 Rest of Middle East and Africa
- 15. South America Augmented and Virtual Reality in Healthcare Market Analysis, Insights and Forecast, 2019-2031
- 15.1. Market Analysis, Insights and Forecast - By Country/Sub-region
- 15.1.1 Brazil
- 15.1.2 Argentina
- 15.1.3 Rest of South America
- 16. Competitive Analysis
- 16.1. Global Market Share Analysis 2024
- 16.2. Company Profiles
- 16.2.1 Microsoft
- 16.2.1.1. Overview
- 16.2.1.2. Products
- 16.2.1.3. SWOT Analysis
- 16.2.1.4. Recent Developments
- 16.2.1.5. Financials (Based on Availability)
- 16.2.2 Augmedix
- 16.2.2.1. Overview
- 16.2.2.2. Products
- 16.2.2.3. SWOT Analysis
- 16.2.2.4. Recent Developments
- 16.2.2.5. Financials (Based on Availability)
- 16.2.3 Orca Health Inc
- 16.2.3.1. Overview
- 16.2.3.2. Products
- 16.2.3.3. SWOT Analysis
- 16.2.3.4. Recent Developments
- 16.2.3.5. Financials (Based on Availability)
- 16.2.4 Intuitive Surgical
- 16.2.4.1. Overview
- 16.2.4.2. Products
- 16.2.4.3. SWOT Analysis
- 16.2.4.4. Recent Developments
- 16.2.4.5. Financials (Based on Availability)
- 16.2.5 EchoPixel
- 16.2.5.1. Overview
- 16.2.5.2. Products
- 16.2.5.3. SWOT Analysis
- 16.2.5.4. Recent Developments
- 16.2.5.5. Financials (Based on Availability)
- 16.2.6 Augmented Pixels Inc
- 16.2.6.1. Overview
- 16.2.6.2. Products
- 16.2.6.3. SWOT Analysis
- 16.2.6.4. Recent Developments
- 16.2.6.5. Financials (Based on Availability)
- 16.2.7 Siemens Healthineers
- 16.2.7.1. Overview
- 16.2.7.2. Products
- 16.2.7.3. SWOT Analysis
- 16.2.7.4. Recent Developments
- 16.2.7.5. Financials (Based on Availability)
- 16.2.8 Surgical Theater
- 16.2.8.1. Overview
- 16.2.8.2. Products
- 16.2.8.3. SWOT Analysis
- 16.2.8.4. Recent Developments
- 16.2.8.5. Financials (Based on Availability)
- 16.2.9 Koninklijke Philips N V
- 16.2.9.1. Overview
- 16.2.9.2. Products
- 16.2.9.3. SWOT Analysis
- 16.2.9.4. Recent Developments
- 16.2.9.5. Financials (Based on Availability)
- 16.2.10 Vuzix Corporation
- 16.2.10.1. Overview
- 16.2.10.2. Products
- 16.2.10.3. SWOT Analysis
- 16.2.10.4. Recent Developments
- 16.2.10.5. Financials (Based on Availability)
- 16.2.11 AccuVein Inc
- 16.2.11.1. Overview
- 16.2.11.2. Products
- 16.2.11.3. SWOT Analysis
- 16.2.11.4. Recent Developments
- 16.2.11.5. Financials (Based on Availability)
- 16.2.12 CAE Healthcare
- 16.2.12.1. Overview
- 16.2.12.2. Products
- 16.2.12.3. SWOT Analysis
- 16.2.12.4. Recent Developments
- 16.2.12.5. Financials (Based on Availability)
- 16.2.1 Microsoft
List of Figures
- Figure 1: Global Augmented and Virtual Reality in Healthcare Market Revenue Breakdown (Million, %) by Region 2024 & 2032
- Figure 2: Global Augmented and Virtual Reality in Healthcare Market Volume Breakdown (K Unit, %) by Region 2024 & 2032
- Figure 3: North America Augmented and Virtual Reality in Healthcare Market Revenue (Million), by Country 2024 & 2032
- Figure 4: North America Augmented and Virtual Reality in Healthcare Market Volume (K Unit), by Country 2024 & 2032
- Figure 5: North America Augmented and Virtual Reality in Healthcare Market Revenue Share (%), by Country 2024 & 2032
- Figure 6: North America Augmented and Virtual Reality in Healthcare Market Volume Share (%), by Country 2024 & 2032
- Figure 7: Europe Augmented and Virtual Reality in Healthcare Market Revenue (Million), by Country 2024 & 2032
- Figure 8: Europe Augmented and Virtual Reality in Healthcare Market Volume (K Unit), by Country 2024 & 2032
- Figure 9: Europe Augmented and Virtual Reality in Healthcare Market Revenue Share (%), by Country 2024 & 2032
- Figure 10: Europe Augmented and Virtual Reality in Healthcare Market Volume Share (%), by Country 2024 & 2032
- Figure 11: Asia Pacific Augmented and Virtual Reality in Healthcare Market Revenue (Million), by Country 2024 & 2032
- Figure 12: Asia Pacific Augmented and Virtual Reality in Healthcare Market Volume (K Unit), by Country 2024 & 2032
- Figure 13: Asia Pacific Augmented and Virtual Reality in Healthcare Market Revenue Share (%), by Country 2024 & 2032
- Figure 14: Asia Pacific Augmented and Virtual Reality in Healthcare Market Volume Share (%), by Country 2024 & 2032
- Figure 15: Middle East and Africa Augmented and Virtual Reality in Healthcare Market Revenue (Million), by Country 2024 & 2032
- Figure 16: Middle East and Africa Augmented and Virtual Reality in Healthcare Market Volume (K Unit), by Country 2024 & 2032
- Figure 17: Middle East and Africa Augmented and Virtual Reality in Healthcare Market Revenue Share (%), by Country 2024 & 2032
- Figure 18: Middle East and Africa Augmented and Virtual Reality in Healthcare Market Volume Share (%), by Country 2024 & 2032
- Figure 19: South America Augmented and Virtual Reality in Healthcare Market Revenue (Million), by Country 2024 & 2032
- Figure 20: South America Augmented and Virtual Reality in Healthcare Market Volume (K Unit), by Country 2024 & 2032
- Figure 21: South America Augmented and Virtual Reality in Healthcare Market Revenue Share (%), by Country 2024 & 2032
- Figure 22: South America Augmented and Virtual Reality in Healthcare Market Volume Share (%), by Country 2024 & 2032
- Figure 23: North America Augmented and Virtual Reality in Healthcare Market Revenue (Million), by Technology 2024 & 2032
- Figure 24: North America Augmented and Virtual Reality in Healthcare Market Volume (K Unit), by Technology 2024 & 2032
- Figure 25: North America Augmented and Virtual Reality in Healthcare Market Revenue Share (%), by Technology 2024 & 2032
- Figure 26: North America Augmented and Virtual Reality in Healthcare Market Volume Share (%), by Technology 2024 & 2032
- Figure 27: North America Augmented and Virtual Reality in Healthcare Market Revenue (Million), by Product 2024 & 2032
- Figure 28: North America Augmented and Virtual Reality in Healthcare Market Volume (K Unit), by Product 2024 & 2032
- Figure 29: North America Augmented and Virtual Reality in Healthcare Market Revenue Share (%), by Product 2024 & 2032
- Figure 30: North America Augmented and Virtual Reality in Healthcare Market Volume Share (%), by Product 2024 & 2032
- Figure 31: North America Augmented and Virtual Reality in Healthcare Market Revenue (Million), by End User 2024 & 2032
- Figure 32: North America Augmented and Virtual Reality in Healthcare Market Volume (K Unit), by End User 2024 & 2032
- Figure 33: North America Augmented and Virtual Reality in Healthcare Market Revenue Share (%), by End User 2024 & 2032
- Figure 34: North America Augmented and Virtual Reality in Healthcare Market Volume Share (%), by End User 2024 & 2032
- Figure 35: North America Augmented and Virtual Reality in Healthcare Market Revenue (Million), by Country 2024 & 2032
- Figure 36: North America Augmented and Virtual Reality in Healthcare Market Volume (K Unit), by Country 2024 & 2032
- Figure 37: North America Augmented and Virtual Reality in Healthcare Market Revenue Share (%), by Country 2024 & 2032
- Figure 38: North America Augmented and Virtual Reality in Healthcare Market Volume Share (%), by Country 2024 & 2032
- Figure 39: Europe Augmented and Virtual Reality in Healthcare Market Revenue (Million), by Technology 2024 & 2032
- Figure 40: Europe Augmented and Virtual Reality in Healthcare Market Volume (K Unit), by Technology 2024 & 2032
- Figure 41: Europe Augmented and Virtual Reality in Healthcare Market Revenue Share (%), by Technology 2024 & 2032
- Figure 42: Europe Augmented and Virtual Reality in Healthcare Market Volume Share (%), by Technology 2024 & 2032
- Figure 43: Europe Augmented and Virtual Reality in Healthcare Market Revenue (Million), by Product 2024 & 2032
- Figure 44: Europe Augmented and Virtual Reality in Healthcare Market Volume (K Unit), by Product 2024 & 2032
- Figure 45: Europe Augmented and Virtual Reality in Healthcare Market Revenue Share (%), by Product 2024 & 2032
- Figure 46: Europe Augmented and Virtual Reality in Healthcare Market Volume Share (%), by Product 2024 & 2032
- Figure 47: Europe Augmented and Virtual Reality in Healthcare Market Revenue (Million), by End User 2024 & 2032
- Figure 48: Europe Augmented and Virtual Reality in Healthcare Market Volume (K Unit), by End User 2024 & 2032
- Figure 49: Europe Augmented and Virtual Reality in Healthcare Market Revenue Share (%), by End User 2024 & 2032
- Figure 50: Europe Augmented and Virtual Reality in Healthcare Market Volume Share (%), by End User 2024 & 2032
- Figure 51: Europe Augmented and Virtual Reality in Healthcare Market Revenue (Million), by Country 2024 & 2032
- Figure 52: Europe Augmented and Virtual Reality in Healthcare Market Volume (K Unit), by Country 2024 & 2032
- Figure 53: Europe Augmented and Virtual Reality in Healthcare Market Revenue Share (%), by Country 2024 & 2032
- Figure 54: Europe Augmented and Virtual Reality in Healthcare Market Volume Share (%), by Country 2024 & 2032
- Figure 55: Asia Pacific Augmented and Virtual Reality in Healthcare Market Revenue (Million), by Technology 2024 & 2032
- Figure 56: Asia Pacific Augmented and Virtual Reality in Healthcare Market Volume (K Unit), by Technology 2024 & 2032
- Figure 57: Asia Pacific Augmented and Virtual Reality in Healthcare Market Revenue Share (%), by Technology 2024 & 2032
- Figure 58: Asia Pacific Augmented and Virtual Reality in Healthcare Market Volume Share (%), by Technology 2024 & 2032
- Figure 59: Asia Pacific Augmented and Virtual Reality in Healthcare Market Revenue (Million), by Product 2024 & 2032
- Figure 60: Asia Pacific Augmented and Virtual Reality in Healthcare Market Volume (K Unit), by Product 2024 & 2032
- Figure 61: Asia Pacific Augmented and Virtual Reality in Healthcare Market Revenue Share (%), by Product 2024 & 2032
- Figure 62: Asia Pacific Augmented and Virtual Reality in Healthcare Market Volume Share (%), by Product 2024 & 2032
- Figure 63: Asia Pacific Augmented and Virtual Reality in Healthcare Market Revenue (Million), by End User 2024 & 2032
- Figure 64: Asia Pacific Augmented and Virtual Reality in Healthcare Market Volume (K Unit), by End User 2024 & 2032
- Figure 65: Asia Pacific Augmented and Virtual Reality in Healthcare Market Revenue Share (%), by End User 2024 & 2032
- Figure 66: Asia Pacific Augmented and Virtual Reality in Healthcare Market Volume Share (%), by End User 2024 & 2032
- Figure 67: Asia Pacific Augmented and Virtual Reality in Healthcare Market Revenue (Million), by Country 2024 & 2032
- Figure 68: Asia Pacific Augmented and Virtual Reality in Healthcare Market Volume (K Unit), by Country 2024 & 2032
- Figure 69: Asia Pacific Augmented and Virtual Reality in Healthcare Market Revenue Share (%), by Country 2024 & 2032
- Figure 70: Asia Pacific Augmented and Virtual Reality in Healthcare Market Volume Share (%), by Country 2024 & 2032
- Figure 71: Middle East and Africa Augmented and Virtual Reality in Healthcare Market Revenue (Million), by Technology 2024 & 2032
- Figure 72: Middle East and Africa Augmented and Virtual Reality in Healthcare Market Volume (K Unit), by Technology 2024 & 2032
- Figure 73: Middle East and Africa Augmented and Virtual Reality in Healthcare Market Revenue Share (%), by Technology 2024 & 2032
- Figure 74: Middle East and Africa Augmented and Virtual Reality in Healthcare Market Volume Share (%), by Technology 2024 & 2032
- Figure 75: Middle East and Africa Augmented and Virtual Reality in Healthcare Market Revenue (Million), by Product 2024 & 2032
- Figure 76: Middle East and Africa Augmented and Virtual Reality in Healthcare Market Volume (K Unit), by Product 2024 & 2032
- Figure 77: Middle East and Africa Augmented and Virtual Reality in Healthcare Market Revenue Share (%), by Product 2024 & 2032
- Figure 78: Middle East and Africa Augmented and Virtual Reality in Healthcare Market Volume Share (%), by Product 2024 & 2032
- Figure 79: Middle East and Africa Augmented and Virtual Reality in Healthcare Market Revenue (Million), by End User 2024 & 2032
- Figure 80: Middle East and Africa Augmented and Virtual Reality in Healthcare Market Volume (K Unit), by End User 2024 & 2032
- Figure 81: Middle East and Africa Augmented and Virtual Reality in Healthcare Market Revenue Share (%), by End User 2024 & 2032
- Figure 82: Middle East and Africa Augmented and Virtual Reality in Healthcare Market Volume Share (%), by End User 2024 & 2032
- Figure 83: Middle East and Africa Augmented and Virtual Reality in Healthcare Market Revenue (Million), by Country 2024 & 2032
- Figure 84: Middle East and Africa Augmented and Virtual Reality in Healthcare Market Volume (K Unit), by Country 2024 & 2032
- Figure 85: Middle East and Africa Augmented and Virtual Reality in Healthcare Market Revenue Share (%), by Country 2024 & 2032
- Figure 86: Middle East and Africa Augmented and Virtual Reality in Healthcare Market Volume Share (%), by Country 2024 & 2032
- Figure 87: South America Augmented and Virtual Reality in Healthcare Market Revenue (Million), by Technology 2024 & 2032
- Figure 88: South America Augmented and Virtual Reality in Healthcare Market Volume (K Unit), by Technology 2024 & 2032
- Figure 89: South America Augmented and Virtual Reality in Healthcare Market Revenue Share (%), by Technology 2024 & 2032
- Figure 90: South America Augmented and Virtual Reality in Healthcare Market Volume Share (%), by Technology 2024 & 2032
- Figure 91: South America Augmented and Virtual Reality in Healthcare Market Revenue (Million), by Product 2024 & 2032
- Figure 92: South America Augmented and Virtual Reality in Healthcare Market Volume (K Unit), by Product 2024 & 2032
- Figure 93: South America Augmented and Virtual Reality in Healthcare Market Revenue Share (%), by Product 2024 & 2032
- Figure 94: South America Augmented and Virtual Reality in Healthcare Market Volume Share (%), by Product 2024 & 2032
- Figure 95: South America Augmented and Virtual Reality in Healthcare Market Revenue (Million), by End User 2024 & 2032
- Figure 96: South America Augmented and Virtual Reality in Healthcare Market Volume (K Unit), by End User 2024 & 2032
- Figure 97: South America Augmented and Virtual Reality in Healthcare Market Revenue Share (%), by End User 2024 & 2032
- Figure 98: South America Augmented and Virtual Reality in Healthcare Market Volume Share (%), by End User 2024 & 2032
- Figure 99: South America Augmented and Virtual Reality in Healthcare Market Revenue (Million), by Country 2024 & 2032
- Figure 100: South America Augmented and Virtual Reality in Healthcare Market Volume (K Unit), by Country 2024 & 2032
- Figure 101: South America Augmented and Virtual Reality in Healthcare Market Revenue Share (%), by Country 2024 & 2032
- Figure 102: South America Augmented and Virtual Reality in Healthcare Market Volume Share (%), by Country 2024 & 2032
List of Tables
- Table 1: Global Augmented and Virtual Reality in Healthcare Market Revenue Million Forecast, by Region 2019 & 2032
- Table 2: Global Augmented and Virtual Reality in Healthcare Market Volume K Unit Forecast, by Region 2019 & 2032
- Table 3: Global Augmented and Virtual Reality in Healthcare Market Revenue Million Forecast, by Technology 2019 & 2032
- Table 4: Global Augmented and Virtual Reality in Healthcare Market Volume K Unit Forecast, by Technology 2019 & 2032
- Table 5: Global Augmented and Virtual Reality in Healthcare Market Revenue Million Forecast, by Product 2019 & 2032
- Table 6: Global Augmented and Virtual Reality in Healthcare Market Volume K Unit Forecast, by Product 2019 & 2032
- Table 7: Global Augmented and Virtual Reality in Healthcare Market Revenue Million Forecast, by End User 2019 & 2032
- Table 8: Global Augmented and Virtual Reality in Healthcare Market Volume K Unit Forecast, by End User 2019 & 2032
- Table 9: Global Augmented and Virtual Reality in Healthcare Market Revenue Million Forecast, by Region 2019 & 2032
- Table 10: Global Augmented and Virtual Reality in Healthcare Market Volume K Unit Forecast, by Region 2019 & 2032
- Table 11: Global Augmented and Virtual Reality in Healthcare Market Revenue Million Forecast, by Country 2019 & 2032
- Table 12: Global Augmented and Virtual Reality in Healthcare Market Volume K Unit Forecast, by Country 2019 & 2032
- Table 13: United States Augmented and Virtual Reality in Healthcare Market Revenue (Million) Forecast, by Application 2019 & 2032
- Table 14: United States Augmented and Virtual Reality in Healthcare Market Volume (K Unit) Forecast, by Application 2019 & 2032
- Table 15: Canada Augmented and Virtual Reality in Healthcare Market Revenue (Million) Forecast, by Application 2019 & 2032
- Table 16: Canada Augmented and Virtual Reality in Healthcare Market Volume (K Unit) Forecast, by Application 2019 & 2032
- Table 17: Mexico Augmented and Virtual Reality in Healthcare Market Revenue (Million) Forecast, by Application 2019 & 2032
- Table 18: Mexico Augmented and Virtual Reality in Healthcare Market Volume (K Unit) Forecast, by Application 2019 & 2032
- Table 19: Global Augmented and Virtual Reality in Healthcare Market Revenue Million Forecast, by Country 2019 & 2032
- Table 20: Global Augmented and Virtual Reality in Healthcare Market Volume K Unit Forecast, by Country 2019 & 2032
- Table 21: Germany Augmented and Virtual Reality in Healthcare Market Revenue (Million) Forecast, by Application 2019 & 2032
- Table 22: Germany Augmented and Virtual Reality in Healthcare Market Volume (K Unit) Forecast, by Application 2019 & 2032
- Table 23: United Kingdom Augmented and Virtual Reality in Healthcare Market Revenue (Million) Forecast, by Application 2019 & 2032
- Table 24: United Kingdom Augmented and Virtual Reality in Healthcare Market Volume (K Unit) Forecast, by Application 2019 & 2032
- Table 25: France Augmented and Virtual Reality in Healthcare Market Revenue (Million) Forecast, by Application 2019 & 2032
- Table 26: France Augmented and Virtual Reality in Healthcare Market Volume (K Unit) Forecast, by Application 2019 & 2032
- Table 27: Italy Augmented and Virtual Reality in Healthcare Market Revenue (Million) Forecast, by Application 2019 & 2032
- Table 28: Italy Augmented and Virtual Reality in Healthcare Market Volume (K Unit) Forecast, by Application 2019 & 2032
- Table 29: Spain Augmented and Virtual Reality in Healthcare Market Revenue (Million) Forecast, by Application 2019 & 2032
- Table 30: Spain Augmented and Virtual Reality in Healthcare Market Volume (K Unit) Forecast, by Application 2019 & 2032
- Table 31: Rest of Europe Augmented and Virtual Reality in Healthcare Market Revenue (Million) Forecast, by Application 2019 & 2032
- Table 32: Rest of Europe Augmented and Virtual Reality in Healthcare Market Volume (K Unit) Forecast, by Application 2019 & 2032
- Table 33: Global Augmented and Virtual Reality in Healthcare Market Revenue Million Forecast, by Country 2019 & 2032
- Table 34: Global Augmented and Virtual Reality in Healthcare Market Volume K Unit Forecast, by Country 2019 & 2032
- Table 35: China Augmented and Virtual Reality in Healthcare Market Revenue (Million) Forecast, by Application 2019 & 2032
- Table 36: China Augmented and Virtual Reality in Healthcare Market Volume (K Unit) Forecast, by Application 2019 & 2032
- Table 37: Japan Augmented and Virtual Reality in Healthcare Market Revenue (Million) Forecast, by Application 2019 & 2032
- Table 38: Japan Augmented and Virtual Reality in Healthcare Market Volume (K Unit) Forecast, by Application 2019 & 2032
- Table 39: India Augmented and Virtual Reality in Healthcare Market Revenue (Million) Forecast, by Application 2019 & 2032
- Table 40: India Augmented and Virtual Reality in Healthcare Market Volume (K Unit) Forecast, by Application 2019 & 2032
- Table 41: Australia Augmented and Virtual Reality in Healthcare Market Revenue (Million) Forecast, by Application 2019 & 2032
- Table 42: Australia Augmented and Virtual Reality in Healthcare Market Volume (K Unit) Forecast, by Application 2019 & 2032
- Table 43: South Korea Augmented and Virtual Reality in Healthcare Market Revenue (Million) Forecast, by Application 2019 & 2032
- Table 44: South Korea Augmented and Virtual Reality in Healthcare Market Volume (K Unit) Forecast, by Application 2019 & 2032
- Table 45: Rest of Asia Pacific Augmented and Virtual Reality in Healthcare Market Revenue (Million) Forecast, by Application 2019 & 2032
- Table 46: Rest of Asia Pacific Augmented and Virtual Reality in Healthcare Market Volume (K Unit) Forecast, by Application 2019 & 2032
- Table 47: Global Augmented and Virtual Reality in Healthcare Market Revenue Million Forecast, by Country 2019 & 2032
- Table 48: Global Augmented and Virtual Reality in Healthcare Market Volume K Unit Forecast, by Country 2019 & 2032
- Table 49: GCC Augmented and Virtual Reality in Healthcare Market Revenue (Million) Forecast, by Application 2019 & 2032
- Table 50: GCC Augmented and Virtual Reality in Healthcare Market Volume (K Unit) Forecast, by Application 2019 & 2032
- Table 51: South Africa Augmented and Virtual Reality in Healthcare Market Revenue (Million) Forecast, by Application 2019 & 2032
- Table 52: South Africa Augmented and Virtual Reality in Healthcare Market Volume (K Unit) Forecast, by Application 2019 & 2032
- Table 53: Rest of Middle East and Africa Augmented and Virtual Reality in Healthcare Market Revenue (Million) Forecast, by Application 2019 & 2032
- Table 54: Rest of Middle East and Africa Augmented and Virtual Reality in Healthcare Market Volume (K Unit) Forecast, by Application 2019 & 2032
- Table 55: Global Augmented and Virtual Reality in Healthcare Market Revenue Million Forecast, by Country 2019 & 2032
- Table 56: Global Augmented and Virtual Reality in Healthcare Market Volume K Unit Forecast, by Country 2019 & 2032
- Table 57: Brazil Augmented and Virtual Reality in Healthcare Market Revenue (Million) Forecast, by Application 2019 & 2032
- Table 58: Brazil Augmented and Virtual Reality in Healthcare Market Volume (K Unit) Forecast, by Application 2019 & 2032
- Table 59: Argentina Augmented and Virtual Reality in Healthcare Market Revenue (Million) Forecast, by Application 2019 & 2032
- Table 60: Argentina Augmented and Virtual Reality in Healthcare Market Volume (K Unit) Forecast, by Application 2019 & 2032
- Table 61: Rest of South America Augmented and Virtual Reality in Healthcare Market Revenue (Million) Forecast, by Application 2019 & 2032
- Table 62: Rest of South America Augmented and Virtual Reality in Healthcare Market Volume (K Unit) Forecast, by Application 2019 & 2032
- Table 63: Global Augmented and Virtual Reality in Healthcare Market Revenue Million Forecast, by Technology 2019 & 2032
- Table 64: Global Augmented and Virtual Reality in Healthcare Market Volume K Unit Forecast, by Technology 2019 & 2032
- Table 65: Global Augmented and Virtual Reality in Healthcare Market Revenue Million Forecast, by Product 2019 & 2032
- Table 66: Global Augmented and Virtual Reality in Healthcare Market Volume K Unit Forecast, by Product 2019 & 2032
- Table 67: Global Augmented and Virtual Reality in Healthcare Market Revenue Million Forecast, by End User 2019 & 2032
- Table 68: Global Augmented and Virtual Reality in Healthcare Market Volume K Unit Forecast, by End User 2019 & 2032
- Table 69: Global Augmented and Virtual Reality in Healthcare Market Revenue Million Forecast, by Country 2019 & 2032
- Table 70: Global Augmented and Virtual Reality in Healthcare Market Volume K Unit Forecast, by Country 2019 & 2032
- Table 71: United States Augmented and Virtual Reality in Healthcare Market Revenue (Million) Forecast, by Application 2019 & 2032
- Table 72: United States Augmented and Virtual Reality in Healthcare Market Volume (K Unit) Forecast, by Application 2019 & 2032
- Table 73: Canada Augmented and Virtual Reality in Healthcare Market Revenue (Million) Forecast, by Application 2019 & 2032
- Table 74: Canada Augmented and Virtual Reality in Healthcare Market Volume (K Unit) Forecast, by Application 2019 & 2032
- Table 75: Mexico Augmented and Virtual Reality in Healthcare Market Revenue (Million) Forecast, by Application 2019 & 2032
- Table 76: Mexico Augmented and Virtual Reality in Healthcare Market Volume (K Unit) Forecast, by Application 2019 & 2032
- Table 77: Global Augmented and Virtual Reality in Healthcare Market Revenue Million Forecast, by Technology 2019 & 2032
- Table 78: Global Augmented and Virtual Reality in Healthcare Market Volume K Unit Forecast, by Technology 2019 & 2032
- Table 79: Global Augmented and Virtual Reality in Healthcare Market Revenue Million Forecast, by Product 2019 & 2032
- Table 80: Global Augmented and Virtual Reality in Healthcare Market Volume K Unit Forecast, by Product 2019 & 2032
- Table 81: Global Augmented and Virtual Reality in Healthcare Market Revenue Million Forecast, by End User 2019 & 2032
- Table 82: Global Augmented and Virtual Reality in Healthcare Market Volume K Unit Forecast, by End User 2019 & 2032
- Table 83: Global Augmented and Virtual Reality in Healthcare Market Revenue Million Forecast, by Country 2019 & 2032
- Table 84: Global Augmented and Virtual Reality in Healthcare Market Volume K Unit Forecast, by Country 2019 & 2032
- Table 85: Germany Augmented and Virtual Reality in Healthcare Market Revenue (Million) Forecast, by Application 2019 & 2032
- Table 86: Germany Augmented and Virtual Reality in Healthcare Market Volume (K Unit) Forecast, by Application 2019 & 2032
- Table 87: United Kingdom Augmented and Virtual Reality in Healthcare Market Revenue (Million) Forecast, by Application 2019 & 2032
- Table 88: United Kingdom Augmented and Virtual Reality in Healthcare Market Volume (K Unit) Forecast, by Application 2019 & 2032
- Table 89: France Augmented and Virtual Reality in Healthcare Market Revenue (Million) Forecast, by Application 2019 & 2032
- Table 90: France Augmented and Virtual Reality in Healthcare Market Volume (K Unit) Forecast, by Application 2019 & 2032
- Table 91: Italy Augmented and Virtual Reality in Healthcare Market Revenue (Million) Forecast, by Application 2019 & 2032
- Table 92: Italy Augmented and Virtual Reality in Healthcare Market Volume (K Unit) Forecast, by Application 2019 & 2032
- Table 93: Spain Augmented and Virtual Reality in Healthcare Market Revenue (Million) Forecast, by Application 2019 & 2032
- Table 94: Spain Augmented and Virtual Reality in Healthcare Market Volume (K Unit) Forecast, by Application 2019 & 2032
- Table 95: Rest of Europe Augmented and Virtual Reality in Healthcare Market Revenue (Million) Forecast, by Application 2019 & 2032
- Table 96: Rest of Europe Augmented and Virtual Reality in Healthcare Market Volume (K Unit) Forecast, by Application 2019 & 2032
- Table 97: Global Augmented and Virtual Reality in Healthcare Market Revenue Million Forecast, by Technology 2019 & 2032
- Table 98: Global Augmented and Virtual Reality in Healthcare Market Volume K Unit Forecast, by Technology 2019 & 2032
- Table 99: Global Augmented and Virtual Reality in Healthcare Market Revenue Million Forecast, by Product 2019 & 2032
- Table 100: Global Augmented and Virtual Reality in Healthcare Market Volume K Unit Forecast, by Product 2019 & 2032
- Table 101: Global Augmented and Virtual Reality in Healthcare Market Revenue Million Forecast, by End User 2019 & 2032
- Table 102: Global Augmented and Virtual Reality in Healthcare Market Volume K Unit Forecast, by End User 2019 & 2032
- Table 103: Global Augmented and Virtual Reality in Healthcare Market Revenue Million Forecast, by Country 2019 & 2032
- Table 104: Global Augmented and Virtual Reality in Healthcare Market Volume K Unit Forecast, by Country 2019 & 2032
- Table 105: China Augmented and Virtual Reality in Healthcare Market Revenue (Million) Forecast, by Application 2019 & 2032
- Table 106: China Augmented and Virtual Reality in Healthcare Market Volume (K Unit) Forecast, by Application 2019 & 2032
- Table 107: Japan Augmented and Virtual Reality in Healthcare Market Revenue (Million) Forecast, by Application 2019 & 2032
- Table 108: Japan Augmented and Virtual Reality in Healthcare Market Volume (K Unit) Forecast, by Application 2019 & 2032
- Table 109: India Augmented and Virtual Reality in Healthcare Market Revenue (Million) Forecast, by Application 2019 & 2032
- Table 110: India Augmented and Virtual Reality in Healthcare Market Volume (K Unit) Forecast, by Application 2019 & 2032
- Table 111: Australia Augmented and Virtual Reality in Healthcare Market Revenue (Million) Forecast, by Application 2019 & 2032
- Table 112: Australia Augmented and Virtual Reality in Healthcare Market Volume (K Unit) Forecast, by Application 2019 & 2032
- Table 113: South Korea Augmented and Virtual Reality in Healthcare Market Revenue (Million) Forecast, by Application 2019 & 2032
- Table 114: South Korea Augmented and Virtual Reality in Healthcare Market Volume (K Unit) Forecast, by Application 2019 & 2032
- Table 115: Rest of Asia Pacific Augmented and Virtual Reality in Healthcare Market Revenue (Million) Forecast, by Application 2019 & 2032
- Table 116: Rest of Asia Pacific Augmented and Virtual Reality in Healthcare Market Volume (K Unit) Forecast, by Application 2019 & 2032
- Table 117: Global Augmented and Virtual Reality in Healthcare Market Revenue Million Forecast, by Technology 2019 & 2032
- Table 118: Global Augmented and Virtual Reality in Healthcare Market Volume K Unit Forecast, by Technology 2019 & 2032
- Table 119: Global Augmented and Virtual Reality in Healthcare Market Revenue Million Forecast, by Product 2019 & 2032
- Table 120: Global Augmented and Virtual Reality in Healthcare Market Volume K Unit Forecast, by Product 2019 & 2032
- Table 121: Global Augmented and Virtual Reality in Healthcare Market Revenue Million Forecast, by End User 2019 & 2032
- Table 122: Global Augmented and Virtual Reality in Healthcare Market Volume K Unit Forecast, by End User 2019 & 2032
- Table 123: Global Augmented and Virtual Reality in Healthcare Market Revenue Million Forecast, by Country 2019 & 2032
- Table 124: Global Augmented and Virtual Reality in Healthcare Market Volume K Unit Forecast, by Country 2019 & 2032
- Table 125: GCC Augmented and Virtual Reality in Healthcare Market Revenue (Million) Forecast, by Application 2019 & 2032
- Table 126: GCC Augmented and Virtual Reality in Healthcare Market Volume (K Unit) Forecast, by Application 2019 & 2032
- Table 127: South Africa Augmented and Virtual Reality in Healthcare Market Revenue (Million) Forecast, by Application 2019 & 2032
- Table 128: South Africa Augmented and Virtual Reality in Healthcare Market Volume (K Unit) Forecast, by Application 2019 & 2032
- Table 129: Rest of Middle East and Africa Augmented and Virtual Reality in Healthcare Market Revenue (Million) Forecast, by Application 2019 & 2032
- Table 130: Rest of Middle East and Africa Augmented and Virtual Reality in Healthcare Market Volume (K Unit) Forecast, by Application 2019 & 2032
- Table 131: Global Augmented and Virtual Reality in Healthcare Market Revenue Million Forecast, by Technology 2019 & 2032
- Table 132: Global Augmented and Virtual Reality in Healthcare Market Volume K Unit Forecast, by Technology 2019 & 2032
- Table 133: Global Augmented and Virtual Reality in Healthcare Market Revenue Million Forecast, by Product 2019 & 2032
- Table 134: Global Augmented and Virtual Reality in Healthcare Market Volume K Unit Forecast, by Product 2019 & 2032
- Table 135: Global Augmented and Virtual Reality in Healthcare Market Revenue Million Forecast, by End User 2019 & 2032
- Table 136: Global Augmented and Virtual Reality in Healthcare Market Volume K Unit Forecast, by End User 2019 & 2032
- Table 137: Global Augmented and Virtual Reality in Healthcare Market Revenue Million Forecast, by Country 2019 & 2032
- Table 138: Global Augmented and Virtual Reality in Healthcare Market Volume K Unit Forecast, by Country 2019 & 2032
- Table 139: Brazil Augmented and Virtual Reality in Healthcare Market Revenue (Million) Forecast, by Application 2019 & 2032
- Table 140: Brazil Augmented and Virtual Reality in Healthcare Market Volume (K Unit) Forecast, by Application 2019 & 2032
- Table 141: Argentina Augmented and Virtual Reality in Healthcare Market Revenue (Million) Forecast, by Application 2019 & 2032
- Table 142: Argentina Augmented and Virtual Reality in Healthcare Market Volume (K Unit) Forecast, by Application 2019 & 2032
- Table 143: Rest of South America Augmented and Virtual Reality in Healthcare Market Revenue (Million) Forecast, by Application 2019 & 2032
- Table 144: Rest of South America Augmented and Virtual Reality in Healthcare Market Volume (K Unit) Forecast, by Application 2019 & 2032
Frequently Asked Questions
1. What is the projected Compound Annual Growth Rate (CAGR) of the Augmented and Virtual Reality in Healthcare Market?
The projected CAGR is approximately 26.99%.
2. Which companies are prominent players in the Augmented and Virtual Reality in Healthcare Market?
Key companies in the market include Microsoft, Augmedix, Orca Health Inc, Intuitive Surgical, EchoPixel, Augmented Pixels Inc, Siemens Healthineers, Surgical Theater, Koninklijke Philips N V, Vuzix Corporation, AccuVein Inc, CAE Healthcare.
3. What are the main segments of the Augmented and Virtual Reality in Healthcare Market?
The market segments include Technology, Product, End User.
4. Can you provide details about the market size?
The market size is estimated to be USD 1.19 Million as of 2022.
5. What are some drivers contributing to market growth?
Rise in Adoption of Augmented Reality in Healthcare; Increase in Investments in Augmented Reality; Rise in Number of Start Up Companies in the Market.
6. What are the notable trends driving market growth?
Head-Mounted Devices Segment is Expected to Hold a Significant Share in the Market Over the Forecast Period.
7. Are there any restraints impacting market growth?
High Cost of Augmented Reality Products; Data Security Concers.
8. Can you provide examples of recent developments in the market?
N/A
9. What pricing options are available for accessing the report?
Pricing options include single-user, multi-user, and enterprise licenses priced at USD 4750, USD 5250, and USD 8750 respectively.
10. Is the market size provided in terms of value or volume?
The market size is provided in terms of value, measured in Million and volume, measured in K Unit.
11. Are there any specific market keywords associated with the report?
Yes, the market keyword associated with the report is "Augmented and Virtual Reality in Healthcare Market," which aids in identifying and referencing the specific market segment covered.
12. How do I determine which pricing option suits my needs best?
The pricing options vary based on user requirements and access needs. Individual users may opt for single-user licenses, while businesses requiring broader access may choose multi-user or enterprise licenses for cost-effective access to the report.
13. Are there any additional resources or data provided in the Augmented and Virtual Reality in Healthcare Market report?
While the report offers comprehensive insights, it's advisable to review the specific contents or supplementary materials provided to ascertain if additional resources or data are available.
14. How can I stay updated on further developments or reports in the Augmented and Virtual Reality in Healthcare Market?
To stay informed about further developments, trends, and reports in the Augmented and Virtual Reality in Healthcare Market, consider subscribing to industry newsletters, following relevant companies and organizations, or regularly checking reputable industry news sources and publications.
Methodology
Step 1 - Identification of Relevant Samples Size from Population Database


Step 2 - Approaches for Defining Global Market Size (Value, Volume* & Price*)

Note*: In applicable scenarios
Step 3 - Data Sources
Primary Research
- Web Analytics
- Survey Reports
- Research Institute
- Latest Research Reports
- Opinion Leaders
Secondary Research
- Annual Reports
- White Paper
- Latest Press Release
- Industry Association
- Paid Database
- Investor Presentations

Step 4 - Data Triangulation
Involves using different sources of information in order to increase the validity of a study
These sources are likely to be stakeholders in a program - participants, other researchers, program staff, other community members, and so on.
Then we put all data in single framework & apply various statistical tools to find out the dynamic on the market.
During the analysis stage, feedback from the stakeholder groups would be compared to determine areas of agreement as well as areas of divergence


