
Key Insights
The global autologous matrix-induced chondrogenesis (AMIC) market is experiencing robust growth, driven by the increasing prevalence of cartilage injuries and degenerative joint diseases, particularly osteoarthritis. The market's expansion is fueled by advancements in surgical techniques and the rising demand for minimally invasive procedures. The high success rates and improved patient outcomes associated with AMIC are further bolstering market adoption. Key segments within the market include hyaluronic acid-based materials, which dominate due to their biocompatibility and effectiveness in stimulating cartilage regeneration. Other materials like collagen, PEG, and PLGA are also gaining traction, albeit at a smaller scale, as research explores their potential benefits. The knee cartilage application segment currently holds the largest market share, given the higher incidence of knee injuries compared to other joints. However, growing awareness of elbow cartilage damage and the associated limitations of other treatment options is propelling the growth of this segment. Leading players in the AMIC market are strategically investing in research and development to enhance product efficacy and expand their geographical reach. This competitive landscape is marked by both established medical device companies and specialized biotechnology firms, further driving innovation within the field.
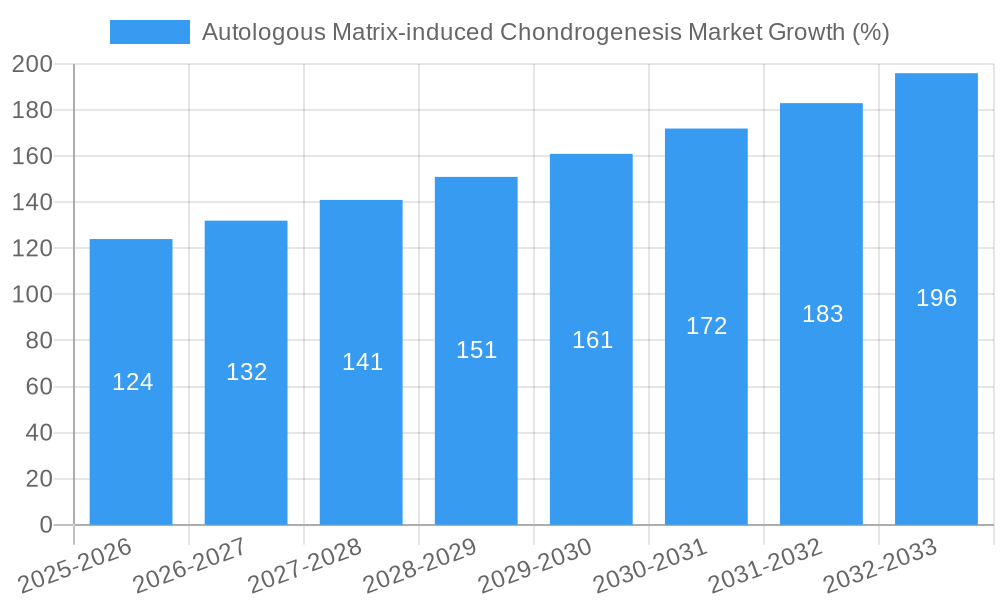
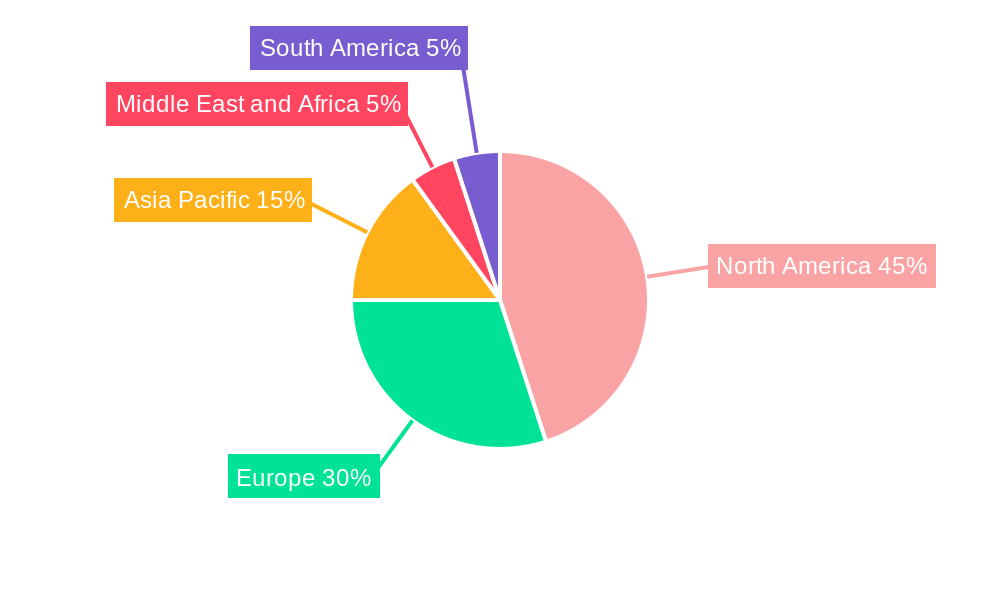
The projected CAGR of 8.10% suggests a significant market expansion over the forecast period (2025-2033). This growth trajectory is anticipated to be influenced by several factors, including the aging global population, increased participation in sports and strenuous activities, and rising healthcare expenditure. However, factors like high procedure costs, limited reimbursement policies in certain regions, and potential complications associated with the procedure could act as restraints. Despite these challenges, the consistent improvement in AMIC techniques and the development of more effective biomaterials will likely mitigate these constraints and contribute to the continued expansion of this market. The North American market currently holds a substantial share owing to advanced healthcare infrastructure and high adoption rates, while the Asia Pacific region is projected to exhibit the fastest growth owing to expanding healthcare facilities and a burgeoning middle class with greater disposable income.
Autologous Matrix-induced Chondrogenesis Market: A Comprehensive Report (2019-2033)
This comprehensive report provides an in-depth analysis of the Autologous Matrix-induced Chondrogenesis market, covering market size, segmentation, growth drivers, challenges, opportunities, and key players. The report utilizes data from the historical period (2019-2024), base year (2025), and estimated year (2025) to forecast market trends through 2033. This report is crucial for industry stakeholders, investors, and researchers seeking to understand and capitalize on the evolving landscape of this dynamic market.
Autologous Matrix-induced Chondrogenesis Market Market Concentration & Innovation
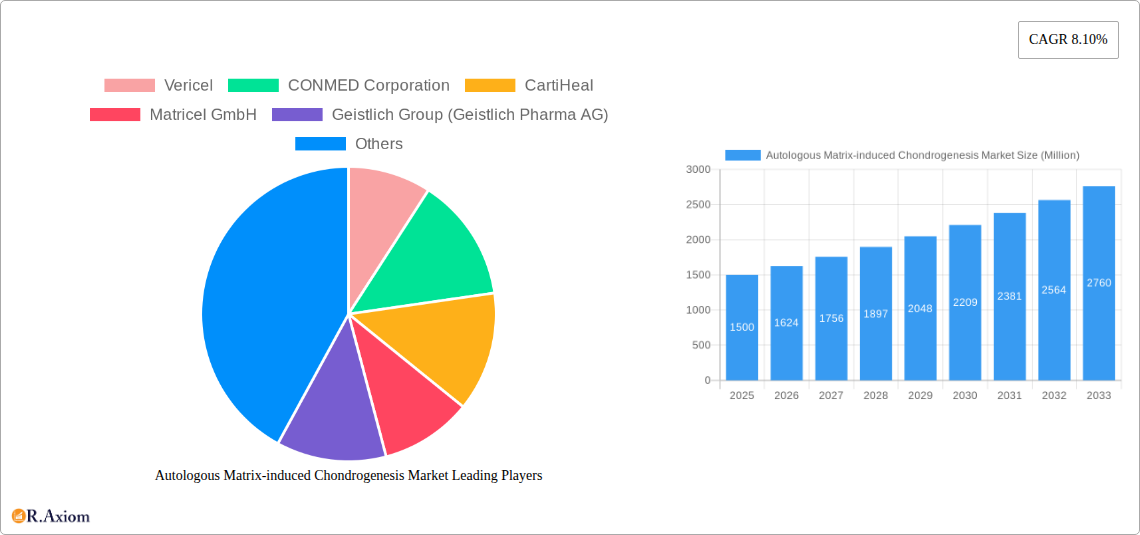
The Autologous Matrix-induced Chondrogenesis market exhibits a moderately concentrated landscape, with several key players holding significant market share. While precise market share figures for each company are not publicly available and vary by region and product, companies like Vericel, Smith+Nephew, and Zimmer Biomet Holdings are considered major players, each contributing a substantial percentage to the overall market value (estimated xx Million in 2025). Smaller companies like Matricel GmbH and CartiHeal focus on niche applications or technologies, demonstrating a diverse range of approaches and innovation levels.
Innovation Drivers:
- Advancements in biomaterials: Development of novel biomaterials, including Hyaluronic Acid, Collagen, PEG, and PLGA, which improve biocompatibility and efficacy.
- Technological improvements in cell processing: Efficiency improvements and reduced processing times lower overall cost and increase accessibility.
- Improved surgical techniques: Minimally invasive procedures are increasing market penetration.
- Growing demand for minimally invasive cartilage repair techniques: This trend drives innovation in both materials and procedures.
Regulatory Frameworks & M&A Activities: Regulatory approvals for new products significantly impact market entry and growth. The market has witnessed several mergers and acquisitions (M&A) activities, with deal values varying significantly depending on the size and strategic goals of the companies involved. For instance, the acquisition of BV Polyganics by Collagen Matrix, Inc. in October 2022 significantly boosted Collagen Matrix's presence and capabilities in bioresorbable technologies. The total value of such M&A deals within the last five years is estimated at xx Million. This consolidates market share and fuels innovation.
Autologous Matrix-induced Chondrogenesis Market Industry Trends & Insights
The Autologous Matrix-induced Chondrogenesis market is experiencing substantial growth, driven by a rising elderly population, increased incidence of osteoarthritis, and advancements in surgical techniques. The market is projected to witness a CAGR of xx% during the forecast period (2025-2033), reaching an estimated value of xx Million by 2033. This growth is propelled by several factors:
- Increased awareness and diagnosis of cartilage damage: Leading to higher demand for effective treatment options.
- Technological advancements: Improved biomaterials, cell processing techniques, and surgical methods enhance treatment efficacy and reduce recovery times.
- Rising healthcare expenditure: Particularly in developed nations, increases access to advanced treatment options.
- Growing adoption of minimally invasive procedures: This is driving demand for less-invasive and more effective solutions.
Market penetration is increasing across various regions, particularly in North America and Europe, due to high healthcare spending and advanced healthcare infrastructure. However, significant untapped potential exists in emerging markets, where the need for cartilage repair solutions is substantial, representing a future growth opportunity. Competitive dynamics are shaped by technological innovation, product differentiation, and strategic alliances and acquisitions.
Dominant Markets & Segments in Autologous Matrix-induced Chondrogenesis Market
The North American market currently dominates the Autologous Matrix-induced Chondrogenesis market, driven by high healthcare expenditure, advanced medical infrastructure, and a large aging population. Europe also holds a significant share, while the Asia-Pacific region is expected to witness faster growth in the coming years due to improving healthcare infrastructure and rising awareness.
Leading Segments:
- Material: Collagen-based materials currently dominate, due to their biocompatibility and effectiveness in promoting cartilage regeneration. However, Hyaluronic Acid and PLGA are gaining traction due to their unique properties.
- Application: Knee cartilage repair represents the largest application segment owing to the high prevalence of knee osteoarthritis. However, the elbow cartilage and other applications segments are poised for growth as surgical techniques improve and awareness of treatment options increase.
Key Drivers for Dominance:
- North America: High healthcare spending, advanced medical infrastructure, and a large aging population.
- Europe: Strong regulatory frameworks and advanced healthcare systems.
- Asia-Pacific: Rapidly developing economies, increasing healthcare awareness and investments.
Autologous Matrix-induced Chondrogenesis Market Product Developments
Recent product innovations focus on improving biomaterial properties, enhancing cell processing techniques, and developing less-invasive surgical tools. Companies are focusing on biocompatible materials with superior mechanical properties and improved integration with native cartilage. Technological advancements are streamlining cell processing to reduce costs and improve outcomes. The market is seeing the rise of sophisticated imaging technologies for more precise diagnosis and surgical planning. This focus on innovation is creating competitive advantages based on superior product efficacy, cost-effectiveness, and minimally invasive procedures.
Report Scope & Segmentation Analysis
This report segments the Autologous Matrix-induced Chondrogenesis market by material (Hyaluronic Acid, Collagen, PEG, PLGA, Other Materials) and application (Knee Cartilage, Elbow Cartilage, Other Applications). Growth projections, market sizes, and competitive dynamics are analyzed for each segment. The collagen segment shows the highest growth projection, driven by its proven effectiveness and versatility. Knee cartilage repair dominates the application segment due to prevalence of osteoarthritis.
Key Drivers of Autologous Matrix-induced Chondrogenesis Market Growth
Technological advancements in biomaterials, cell processing techniques, and surgical methods are key growth drivers. The rising prevalence of osteoarthritis and sports-related injuries is increasing demand. Favorable regulatory environments, particularly in developed countries, facilitate market expansion. Increased investment in research and development, further fueling innovation and driving market growth.
Challenges in the Autologous Matrix-induced Chondrogenesis Market Sector
High cost of treatment limits accessibility, especially in developing countries. Stringent regulatory approvals can delay product launches and increase development costs. The complexity of surgical procedures and the need for specialized surgeons create barriers. Competition from alternative cartilage repair techniques also poses a challenge. These factors combine to limit market penetration in certain regions and patient segments.
Emerging Opportunities in Autologous Matrix-induced Chondrogenesis Market
Expanding into emerging markets presents significant opportunities for growth. Developments in regenerative medicine and tissue engineering will create new treatment approaches. Personalized medicine approaches, tailoring treatments to individual patient needs, offers considerable potential. Focusing on minimally invasive procedures and improving patient outcomes will be crucial to increase market penetration.
Leading Players in the Autologous Matrix-induced Chondrogenesis Market Market
- Vericel
- CONMED Corporation
- CartiHeal
- Matricel GmbH
- Geistlich Group (Geistlich Pharma AG)
- Smith+Nephew
- JRI Orthopaedics
- Anika Therapeutics Inc
- Arthrex
- Zimmer Biomet Holdings
- B Braun SE
- Arthro-Kinetics
Key Developments in Autologous Matrix-induced Chondrogenesis Market Industry
- October 2022: Collagen Matrix, Inc. and Linden Capital Partners acquired BV Polyganics, expanding their bioresorbable solutions portfolio and market reach.
- May 2022: Rousselot showcased its Colartix collagen matrix ingredient, demonstrating positive results in reducing joint discomfort.
Strategic Outlook for Autologous Matrix-induced Chondrogenesis Market Market
The Autologous Matrix-induced Chondrogenesis market holds substantial future potential, driven by technological advancements, increasing prevalence of cartilage damage, and rising healthcare expenditure. Strategic partnerships, focus on innovation, and expansion into new markets will be vital to capitalize on this growth. Personalized treatment approaches, coupled with minimally invasive procedures, are expected to shape future market trends, enhancing patient outcomes and driving market expansion.
Autologous Matrix-induced Chondrogenesis Market Segmentation
-
1. Material
- 1.1. Hyaluronic Acid
- 1.2. Collagen
- 1.3. Polyethylene Glycol (PEG)
- 1.4. Poly Lactic-co-glycolic Acid (PLGA)
- 1.5. Other Materials
-
2. Application
- 2.1. Knee Cartilage
- 2.2. Elbow Cartilage
- 2.3. Other Applications
Autologous Matrix-induced Chondrogenesis Market Segmentation By Geography
-
1. North America
- 1.1. United States
- 1.2. Canada
- 1.3. Mexico
-
2. Europe
- 2.1. Germany
- 2.2. United Kingdom
- 2.3. France
- 2.4. Italy
- 2.5. Spain
- 2.6. Rest of Europe
-
3. Asia Pacific
- 3.1. China
- 3.2. Japan
- 3.3. India
- 3.4. Australia
- 3.5. South Korea
- 3.6. Rest of Asia Pacific
-
4. Middle East and Africa
- 4.1. GCC
- 4.2. South Africa
- 4.3. Rest of Middle East and Africa
-
5. South America
- 5.1. Brazil
- 5.2. Argentina
- 5.3. Rest of South America
Autologous Matrix-induced Chondrogenesis Market REPORT HIGHLIGHTS
| Aspects | Details |
|---|---|
| Study Period | 2019-2033 |
| Base Year | 2024 |
| Estimated Year | 2025 |
| Forecast Period | 2025-2033 |
| Historical Period | 2019-2024 |
| Growth Rate | CAGR of 8.10% from 2019-2033 |
| Segmentation |
|
Table of Contents
- 1. Introduction
- 1.1. Research Scope
- 1.2. Market Segmentation
- 1.3. Research Methodology
- 1.4. Definitions and Assumptions
- 2. Executive Summary
- 2.1. Introduction
- 3. Market Dynamics
- 3.1. Introduction
- 3.2. Market Drivers
- 3.2.1. Rising Prevalence of Bone and Joint Disorders; Increasing Number of Sports and Other Injuries; Growing Demand for Minimally Invasive Procedures
- 3.3. Market Restrains
- 3.3.1. Lack of Proper Reimbursement System; Scarcity of Skilled Professionals and Sufficient Clinical Data
- 3.4. Market Trends
- 3.4.1. Knee Joint Holds Significant Share in the Global Autologous Matrix-induced Chondrogenesis Market Over the Forecast Period
- 4. Market Factor Analysis
- 4.1. Porters Five Forces
- 4.2. Supply/Value Chain
- 4.3. PESTEL analysis
- 4.4. Market Entropy
- 4.5. Patent/Trademark Analysis
- 5. Global Autologous Matrix-induced Chondrogenesis Market Analysis, Insights and Forecast, 2019-2031
- 5.1. Market Analysis, Insights and Forecast - by Material
- 5.1.1. Hyaluronic Acid
- 5.1.2. Collagen
- 5.1.3. Polyethylene Glycol (PEG)
- 5.1.4. Poly Lactic-co-glycolic Acid (PLGA)
- 5.1.5. Other Materials
- 5.2. Market Analysis, Insights and Forecast - by Application
- 5.2.1. Knee Cartilage
- 5.2.2. Elbow Cartilage
- 5.2.3. Other Applications
- 5.3. Market Analysis, Insights and Forecast - by Region
- 5.3.1. North America
- 5.3.2. Europe
- 5.3.3. Asia Pacific
- 5.3.4. Middle East and Africa
- 5.3.5. South America
- 5.1. Market Analysis, Insights and Forecast - by Material
- 6. North America Autologous Matrix-induced Chondrogenesis Market Analysis, Insights and Forecast, 2019-2031
- 6.1. Market Analysis, Insights and Forecast - by Material
- 6.1.1. Hyaluronic Acid
- 6.1.2. Collagen
- 6.1.3. Polyethylene Glycol (PEG)
- 6.1.4. Poly Lactic-co-glycolic Acid (PLGA)
- 6.1.5. Other Materials
- 6.2. Market Analysis, Insights and Forecast - by Application
- 6.2.1. Knee Cartilage
- 6.2.2. Elbow Cartilage
- 6.2.3. Other Applications
- 6.1. Market Analysis, Insights and Forecast - by Material
- 7. Europe Autologous Matrix-induced Chondrogenesis Market Analysis, Insights and Forecast, 2019-2031
- 7.1. Market Analysis, Insights and Forecast - by Material
- 7.1.1. Hyaluronic Acid
- 7.1.2. Collagen
- 7.1.3. Polyethylene Glycol (PEG)
- 7.1.4. Poly Lactic-co-glycolic Acid (PLGA)
- 7.1.5. Other Materials
- 7.2. Market Analysis, Insights and Forecast - by Application
- 7.2.1. Knee Cartilage
- 7.2.2. Elbow Cartilage
- 7.2.3. Other Applications
- 7.1. Market Analysis, Insights and Forecast - by Material
- 8. Asia Pacific Autologous Matrix-induced Chondrogenesis Market Analysis, Insights and Forecast, 2019-2031
- 8.1. Market Analysis, Insights and Forecast - by Material
- 8.1.1. Hyaluronic Acid
- 8.1.2. Collagen
- 8.1.3. Polyethylene Glycol (PEG)
- 8.1.4. Poly Lactic-co-glycolic Acid (PLGA)
- 8.1.5. Other Materials
- 8.2. Market Analysis, Insights and Forecast - by Application
- 8.2.1. Knee Cartilage
- 8.2.2. Elbow Cartilage
- 8.2.3. Other Applications
- 8.1. Market Analysis, Insights and Forecast - by Material
- 9. Middle East and Africa Autologous Matrix-induced Chondrogenesis Market Analysis, Insights and Forecast, 2019-2031
- 9.1. Market Analysis, Insights and Forecast - by Material
- 9.1.1. Hyaluronic Acid
- 9.1.2. Collagen
- 9.1.3. Polyethylene Glycol (PEG)
- 9.1.4. Poly Lactic-co-glycolic Acid (PLGA)
- 9.1.5. Other Materials
- 9.2. Market Analysis, Insights and Forecast - by Application
- 9.2.1. Knee Cartilage
- 9.2.2. Elbow Cartilage
- 9.2.3. Other Applications
- 9.1. Market Analysis, Insights and Forecast - by Material
- 10. South America Autologous Matrix-induced Chondrogenesis Market Analysis, Insights and Forecast, 2019-2031
- 10.1. Market Analysis, Insights and Forecast - by Material
- 10.1.1. Hyaluronic Acid
- 10.1.2. Collagen
- 10.1.3. Polyethylene Glycol (PEG)
- 10.1.4. Poly Lactic-co-glycolic Acid (PLGA)
- 10.1.5. Other Materials
- 10.2. Market Analysis, Insights and Forecast - by Application
- 10.2.1. Knee Cartilage
- 10.2.2. Elbow Cartilage
- 10.2.3. Other Applications
- 10.1. Market Analysis, Insights and Forecast - by Material
- 11. North America Autologous Matrix-induced Chondrogenesis Market Analysis, Insights and Forecast, 2019-2031
- 11.1. Market Analysis, Insights and Forecast - By Country/Sub-region
- 11.1.1. undefined
- 12. Europe Autologous Matrix-induced Chondrogenesis Market Analysis, Insights and Forecast, 2019-2031
- 12.1. Market Analysis, Insights and Forecast - By Country/Sub-region
- 12.1.1. undefined
- 13. Asia Pacific Autologous Matrix-induced Chondrogenesis Market Analysis, Insights and Forecast, 2019-2031
- 13.1. Market Analysis, Insights and Forecast - By Country/Sub-region
- 13.1.1. undefined
- 14. Middle East and Africa Autologous Matrix-induced Chondrogenesis Market Analysis, Insights and Forecast, 2019-2031
- 14.1. Market Analysis, Insights and Forecast - By Country/Sub-region
- 14.1.1. undefined
- 15. South America Autologous Matrix-induced Chondrogenesis Market Analysis, Insights and Forecast, 2019-2031
- 15.1. Market Analysis, Insights and Forecast - By Country/Sub-region
- 15.1.1. undefined
- 16. Competitive Analysis
- 16.1. Global Market Share Analysis 2024
- 16.2. Company Profiles
- 16.2.1 Vericel
- 16.2.1.1. Overview
- 16.2.1.2. Products
- 16.2.1.3. SWOT Analysis
- 16.2.1.4. Recent Developments
- 16.2.1.5. Financials (Based on Availability)
- 16.2.2 CONMED Corporation
- 16.2.2.1. Overview
- 16.2.2.2. Products
- 16.2.2.3. SWOT Analysis
- 16.2.2.4. Recent Developments
- 16.2.2.5. Financials (Based on Availability)
- 16.2.3 CartiHeal
- 16.2.3.1. Overview
- 16.2.3.2. Products
- 16.2.3.3. SWOT Analysis
- 16.2.3.4. Recent Developments
- 16.2.3.5. Financials (Based on Availability)
- 16.2.4 Matricel GmbH
- 16.2.4.1. Overview
- 16.2.4.2. Products
- 16.2.4.3. SWOT Analysis
- 16.2.4.4. Recent Developments
- 16.2.4.5. Financials (Based on Availability)
- 16.2.5 Geistlich Group (Geistlich Pharma AG)
- 16.2.5.1. Overview
- 16.2.5.2. Products
- 16.2.5.3. SWOT Analysis
- 16.2.5.4. Recent Developments
- 16.2.5.5. Financials (Based on Availability)
- 16.2.6 Smith+Nephew
- 16.2.6.1. Overview
- 16.2.6.2. Products
- 16.2.6.3. SWOT Analysis
- 16.2.6.4. Recent Developments
- 16.2.6.5. Financials (Based on Availability)
- 16.2.7 JRI Orthopaedics
- 16.2.7.1. Overview
- 16.2.7.2. Products
- 16.2.7.3. SWOT Analysis
- 16.2.7.4. Recent Developments
- 16.2.7.5. Financials (Based on Availability)
- 16.2.8 Anika Therapeutics Inc
- 16.2.8.1. Overview
- 16.2.8.2. Products
- 16.2.8.3. SWOT Analysis
- 16.2.8.4. Recent Developments
- 16.2.8.5. Financials (Based on Availability)
- 16.2.9 Arthrex
- 16.2.9.1. Overview
- 16.2.9.2. Products
- 16.2.9.3. SWOT Analysis
- 16.2.9.4. Recent Developments
- 16.2.9.5. Financials (Based on Availability)
- 16.2.10 Zimmer Biomet Holdings
- 16.2.10.1. Overview
- 16.2.10.2. Products
- 16.2.10.3. SWOT Analysis
- 16.2.10.4. Recent Developments
- 16.2.10.5. Financials (Based on Availability)
- 16.2.11 B Braun SE
- 16.2.11.1. Overview
- 16.2.11.2. Products
- 16.2.11.3. SWOT Analysis
- 16.2.11.4. Recent Developments
- 16.2.11.5. Financials (Based on Availability)
- 16.2.12 Arthro-Kinetics
- 16.2.12.1. Overview
- 16.2.12.2. Products
- 16.2.12.3. SWOT Analysis
- 16.2.12.4. Recent Developments
- 16.2.12.5. Financials (Based on Availability)
- 16.2.1 Vericel
List of Figures
- Figure 1: Global Autologous Matrix-induced Chondrogenesis Market Revenue Breakdown (Million, %) by Region 2024 & 2032
- Figure 2: Global Autologous Matrix-induced Chondrogenesis Market Volume Breakdown (K Unit, %) by Region 2024 & 2032
- Figure 3: North America Autologous Matrix-induced Chondrogenesis Market Revenue (Million), by Country 2024 & 2032
- Figure 4: North America Autologous Matrix-induced Chondrogenesis Market Volume (K Unit), by Country 2024 & 2032
- Figure 5: North America Autologous Matrix-induced Chondrogenesis Market Revenue Share (%), by Country 2024 & 2032
- Figure 6: North America Autologous Matrix-induced Chondrogenesis Market Volume Share (%), by Country 2024 & 2032
- Figure 7: Europe Autologous Matrix-induced Chondrogenesis Market Revenue (Million), by Country 2024 & 2032
- Figure 8: Europe Autologous Matrix-induced Chondrogenesis Market Volume (K Unit), by Country 2024 & 2032
- Figure 9: Europe Autologous Matrix-induced Chondrogenesis Market Revenue Share (%), by Country 2024 & 2032
- Figure 10: Europe Autologous Matrix-induced Chondrogenesis Market Volume Share (%), by Country 2024 & 2032
- Figure 11: Asia Pacific Autologous Matrix-induced Chondrogenesis Market Revenue (Million), by Country 2024 & 2032
- Figure 12: Asia Pacific Autologous Matrix-induced Chondrogenesis Market Volume (K Unit), by Country 2024 & 2032
- Figure 13: Asia Pacific Autologous Matrix-induced Chondrogenesis Market Revenue Share (%), by Country 2024 & 2032
- Figure 14: Asia Pacific Autologous Matrix-induced Chondrogenesis Market Volume Share (%), by Country 2024 & 2032
- Figure 15: Middle East and Africa Autologous Matrix-induced Chondrogenesis Market Revenue (Million), by Country 2024 & 2032
- Figure 16: Middle East and Africa Autologous Matrix-induced Chondrogenesis Market Volume (K Unit), by Country 2024 & 2032
- Figure 17: Middle East and Africa Autologous Matrix-induced Chondrogenesis Market Revenue Share (%), by Country 2024 & 2032
- Figure 18: Middle East and Africa Autologous Matrix-induced Chondrogenesis Market Volume Share (%), by Country 2024 & 2032
- Figure 19: South America Autologous Matrix-induced Chondrogenesis Market Revenue (Million), by Country 2024 & 2032
- Figure 20: South America Autologous Matrix-induced Chondrogenesis Market Volume (K Unit), by Country 2024 & 2032
- Figure 21: South America Autologous Matrix-induced Chondrogenesis Market Revenue Share (%), by Country 2024 & 2032
- Figure 22: South America Autologous Matrix-induced Chondrogenesis Market Volume Share (%), by Country 2024 & 2032
- Figure 23: North America Autologous Matrix-induced Chondrogenesis Market Revenue (Million), by Material 2024 & 2032
- Figure 24: North America Autologous Matrix-induced Chondrogenesis Market Volume (K Unit), by Material 2024 & 2032
- Figure 25: North America Autologous Matrix-induced Chondrogenesis Market Revenue Share (%), by Material 2024 & 2032
- Figure 26: North America Autologous Matrix-induced Chondrogenesis Market Volume Share (%), by Material 2024 & 2032
- Figure 27: North America Autologous Matrix-induced Chondrogenesis Market Revenue (Million), by Application 2024 & 2032
- Figure 28: North America Autologous Matrix-induced Chondrogenesis Market Volume (K Unit), by Application 2024 & 2032
- Figure 29: North America Autologous Matrix-induced Chondrogenesis Market Revenue Share (%), by Application 2024 & 2032
- Figure 30: North America Autologous Matrix-induced Chondrogenesis Market Volume Share (%), by Application 2024 & 2032
- Figure 31: North America Autologous Matrix-induced Chondrogenesis Market Revenue (Million), by Country 2024 & 2032
- Figure 32: North America Autologous Matrix-induced Chondrogenesis Market Volume (K Unit), by Country 2024 & 2032
- Figure 33: North America Autologous Matrix-induced Chondrogenesis Market Revenue Share (%), by Country 2024 & 2032
- Figure 34: North America Autologous Matrix-induced Chondrogenesis Market Volume Share (%), by Country 2024 & 2032
- Figure 35: Europe Autologous Matrix-induced Chondrogenesis Market Revenue (Million), by Material 2024 & 2032
- Figure 36: Europe Autologous Matrix-induced Chondrogenesis Market Volume (K Unit), by Material 2024 & 2032
- Figure 37: Europe Autologous Matrix-induced Chondrogenesis Market Revenue Share (%), by Material 2024 & 2032
- Figure 38: Europe Autologous Matrix-induced Chondrogenesis Market Volume Share (%), by Material 2024 & 2032
- Figure 39: Europe Autologous Matrix-induced Chondrogenesis Market Revenue (Million), by Application 2024 & 2032
- Figure 40: Europe Autologous Matrix-induced Chondrogenesis Market Volume (K Unit), by Application 2024 & 2032
- Figure 41: Europe Autologous Matrix-induced Chondrogenesis Market Revenue Share (%), by Application 2024 & 2032
- Figure 42: Europe Autologous Matrix-induced Chondrogenesis Market Volume Share (%), by Application 2024 & 2032
- Figure 43: Europe Autologous Matrix-induced Chondrogenesis Market Revenue (Million), by Country 2024 & 2032
- Figure 44: Europe Autologous Matrix-induced Chondrogenesis Market Volume (K Unit), by Country 2024 & 2032
- Figure 45: Europe Autologous Matrix-induced Chondrogenesis Market Revenue Share (%), by Country 2024 & 2032
- Figure 46: Europe Autologous Matrix-induced Chondrogenesis Market Volume Share (%), by Country 2024 & 2032
- Figure 47: Asia Pacific Autologous Matrix-induced Chondrogenesis Market Revenue (Million), by Material 2024 & 2032
- Figure 48: Asia Pacific Autologous Matrix-induced Chondrogenesis Market Volume (K Unit), by Material 2024 & 2032
- Figure 49: Asia Pacific Autologous Matrix-induced Chondrogenesis Market Revenue Share (%), by Material 2024 & 2032
- Figure 50: Asia Pacific Autologous Matrix-induced Chondrogenesis Market Volume Share (%), by Material 2024 & 2032
- Figure 51: Asia Pacific Autologous Matrix-induced Chondrogenesis Market Revenue (Million), by Application 2024 & 2032
- Figure 52: Asia Pacific Autologous Matrix-induced Chondrogenesis Market Volume (K Unit), by Application 2024 & 2032
- Figure 53: Asia Pacific Autologous Matrix-induced Chondrogenesis Market Revenue Share (%), by Application 2024 & 2032
- Figure 54: Asia Pacific Autologous Matrix-induced Chondrogenesis Market Volume Share (%), by Application 2024 & 2032
- Figure 55: Asia Pacific Autologous Matrix-induced Chondrogenesis Market Revenue (Million), by Country 2024 & 2032
- Figure 56: Asia Pacific Autologous Matrix-induced Chondrogenesis Market Volume (K Unit), by Country 2024 & 2032
- Figure 57: Asia Pacific Autologous Matrix-induced Chondrogenesis Market Revenue Share (%), by Country 2024 & 2032
- Figure 58: Asia Pacific Autologous Matrix-induced Chondrogenesis Market Volume Share (%), by Country 2024 & 2032
- Figure 59: Middle East and Africa Autologous Matrix-induced Chondrogenesis Market Revenue (Million), by Material 2024 & 2032
- Figure 60: Middle East and Africa Autologous Matrix-induced Chondrogenesis Market Volume (K Unit), by Material 2024 & 2032
- Figure 61: Middle East and Africa Autologous Matrix-induced Chondrogenesis Market Revenue Share (%), by Material 2024 & 2032
- Figure 62: Middle East and Africa Autologous Matrix-induced Chondrogenesis Market Volume Share (%), by Material 2024 & 2032
- Figure 63: Middle East and Africa Autologous Matrix-induced Chondrogenesis Market Revenue (Million), by Application 2024 & 2032
- Figure 64: Middle East and Africa Autologous Matrix-induced Chondrogenesis Market Volume (K Unit), by Application 2024 & 2032
- Figure 65: Middle East and Africa Autologous Matrix-induced Chondrogenesis Market Revenue Share (%), by Application 2024 & 2032
- Figure 66: Middle East and Africa Autologous Matrix-induced Chondrogenesis Market Volume Share (%), by Application 2024 & 2032
- Figure 67: Middle East and Africa Autologous Matrix-induced Chondrogenesis Market Revenue (Million), by Country 2024 & 2032
- Figure 68: Middle East and Africa Autologous Matrix-induced Chondrogenesis Market Volume (K Unit), by Country 2024 & 2032
- Figure 69: Middle East and Africa Autologous Matrix-induced Chondrogenesis Market Revenue Share (%), by Country 2024 & 2032
- Figure 70: Middle East and Africa Autologous Matrix-induced Chondrogenesis Market Volume Share (%), by Country 2024 & 2032
- Figure 71: South America Autologous Matrix-induced Chondrogenesis Market Revenue (Million), by Material 2024 & 2032
- Figure 72: South America Autologous Matrix-induced Chondrogenesis Market Volume (K Unit), by Material 2024 & 2032
- Figure 73: South America Autologous Matrix-induced Chondrogenesis Market Revenue Share (%), by Material 2024 & 2032
- Figure 74: South America Autologous Matrix-induced Chondrogenesis Market Volume Share (%), by Material 2024 & 2032
- Figure 75: South America Autologous Matrix-induced Chondrogenesis Market Revenue (Million), by Application 2024 & 2032
- Figure 76: South America Autologous Matrix-induced Chondrogenesis Market Volume (K Unit), by Application 2024 & 2032
- Figure 77: South America Autologous Matrix-induced Chondrogenesis Market Revenue Share (%), by Application 2024 & 2032
- Figure 78: South America Autologous Matrix-induced Chondrogenesis Market Volume Share (%), by Application 2024 & 2032
- Figure 79: South America Autologous Matrix-induced Chondrogenesis Market Revenue (Million), by Country 2024 & 2032
- Figure 80: South America Autologous Matrix-induced Chondrogenesis Market Volume (K Unit), by Country 2024 & 2032
- Figure 81: South America Autologous Matrix-induced Chondrogenesis Market Revenue Share (%), by Country 2024 & 2032
- Figure 82: South America Autologous Matrix-induced Chondrogenesis Market Volume Share (%), by Country 2024 & 2032
List of Tables
- Table 1: Global Autologous Matrix-induced Chondrogenesis Market Revenue Million Forecast, by Region 2019 & 2032
- Table 2: Global Autologous Matrix-induced Chondrogenesis Market Volume K Unit Forecast, by Region 2019 & 2032
- Table 3: Global Autologous Matrix-induced Chondrogenesis Market Revenue Million Forecast, by Material 2019 & 2032
- Table 4: Global Autologous Matrix-induced Chondrogenesis Market Volume K Unit Forecast, by Material 2019 & 2032
- Table 5: Global Autologous Matrix-induced Chondrogenesis Market Revenue Million Forecast, by Application 2019 & 2032
- Table 6: Global Autologous Matrix-induced Chondrogenesis Market Volume K Unit Forecast, by Application 2019 & 2032
- Table 7: Global Autologous Matrix-induced Chondrogenesis Market Revenue Million Forecast, by Region 2019 & 2032
- Table 8: Global Autologous Matrix-induced Chondrogenesis Market Volume K Unit Forecast, by Region 2019 & 2032
- Table 9: Global Autologous Matrix-induced Chondrogenesis Market Revenue Million Forecast, by Country 2019 & 2032
- Table 10: Global Autologous Matrix-induced Chondrogenesis Market Volume K Unit Forecast, by Country 2019 & 2032
- Table 11: Global Autologous Matrix-induced Chondrogenesis Market Revenue Million Forecast, by Country 2019 & 2032
- Table 12: Global Autologous Matrix-induced Chondrogenesis Market Volume K Unit Forecast, by Country 2019 & 2032
- Table 13: Global Autologous Matrix-induced Chondrogenesis Market Revenue Million Forecast, by Country 2019 & 2032
- Table 14: Global Autologous Matrix-induced Chondrogenesis Market Volume K Unit Forecast, by Country 2019 & 2032
- Table 15: Global Autologous Matrix-induced Chondrogenesis Market Revenue Million Forecast, by Country 2019 & 2032
- Table 16: Global Autologous Matrix-induced Chondrogenesis Market Volume K Unit Forecast, by Country 2019 & 2032
- Table 17: Global Autologous Matrix-induced Chondrogenesis Market Revenue Million Forecast, by Country 2019 & 2032
- Table 18: Global Autologous Matrix-induced Chondrogenesis Market Volume K Unit Forecast, by Country 2019 & 2032
- Table 19: Global Autologous Matrix-induced Chondrogenesis Market Revenue Million Forecast, by Material 2019 & 2032
- Table 20: Global Autologous Matrix-induced Chondrogenesis Market Volume K Unit Forecast, by Material 2019 & 2032
- Table 21: Global Autologous Matrix-induced Chondrogenesis Market Revenue Million Forecast, by Application 2019 & 2032
- Table 22: Global Autologous Matrix-induced Chondrogenesis Market Volume K Unit Forecast, by Application 2019 & 2032
- Table 23: Global Autologous Matrix-induced Chondrogenesis Market Revenue Million Forecast, by Country 2019 & 2032
- Table 24: Global Autologous Matrix-induced Chondrogenesis Market Volume K Unit Forecast, by Country 2019 & 2032
- Table 25: United States Autologous Matrix-induced Chondrogenesis Market Revenue (Million) Forecast, by Application 2019 & 2032
- Table 26: United States Autologous Matrix-induced Chondrogenesis Market Volume (K Unit) Forecast, by Application 2019 & 2032
- Table 27: Canada Autologous Matrix-induced Chondrogenesis Market Revenue (Million) Forecast, by Application 2019 & 2032
- Table 28: Canada Autologous Matrix-induced Chondrogenesis Market Volume (K Unit) Forecast, by Application 2019 & 2032
- Table 29: Mexico Autologous Matrix-induced Chondrogenesis Market Revenue (Million) Forecast, by Application 2019 & 2032
- Table 30: Mexico Autologous Matrix-induced Chondrogenesis Market Volume (K Unit) Forecast, by Application 2019 & 2032
- Table 31: Global Autologous Matrix-induced Chondrogenesis Market Revenue Million Forecast, by Material 2019 & 2032
- Table 32: Global Autologous Matrix-induced Chondrogenesis Market Volume K Unit Forecast, by Material 2019 & 2032
- Table 33: Global Autologous Matrix-induced Chondrogenesis Market Revenue Million Forecast, by Application 2019 & 2032
- Table 34: Global Autologous Matrix-induced Chondrogenesis Market Volume K Unit Forecast, by Application 2019 & 2032
- Table 35: Global Autologous Matrix-induced Chondrogenesis Market Revenue Million Forecast, by Country 2019 & 2032
- Table 36: Global Autologous Matrix-induced Chondrogenesis Market Volume K Unit Forecast, by Country 2019 & 2032
- Table 37: Germany Autologous Matrix-induced Chondrogenesis Market Revenue (Million) Forecast, by Application 2019 & 2032
- Table 38: Germany Autologous Matrix-induced Chondrogenesis Market Volume (K Unit) Forecast, by Application 2019 & 2032
- Table 39: United Kingdom Autologous Matrix-induced Chondrogenesis Market Revenue (Million) Forecast, by Application 2019 & 2032
- Table 40: United Kingdom Autologous Matrix-induced Chondrogenesis Market Volume (K Unit) Forecast, by Application 2019 & 2032
- Table 41: France Autologous Matrix-induced Chondrogenesis Market Revenue (Million) Forecast, by Application 2019 & 2032
- Table 42: France Autologous Matrix-induced Chondrogenesis Market Volume (K Unit) Forecast, by Application 2019 & 2032
- Table 43: Italy Autologous Matrix-induced Chondrogenesis Market Revenue (Million) Forecast, by Application 2019 & 2032
- Table 44: Italy Autologous Matrix-induced Chondrogenesis Market Volume (K Unit) Forecast, by Application 2019 & 2032
- Table 45: Spain Autologous Matrix-induced Chondrogenesis Market Revenue (Million) Forecast, by Application 2019 & 2032
- Table 46: Spain Autologous Matrix-induced Chondrogenesis Market Volume (K Unit) Forecast, by Application 2019 & 2032
- Table 47: Rest of Europe Autologous Matrix-induced Chondrogenesis Market Revenue (Million) Forecast, by Application 2019 & 2032
- Table 48: Rest of Europe Autologous Matrix-induced Chondrogenesis Market Volume (K Unit) Forecast, by Application 2019 & 2032
- Table 49: Global Autologous Matrix-induced Chondrogenesis Market Revenue Million Forecast, by Material 2019 & 2032
- Table 50: Global Autologous Matrix-induced Chondrogenesis Market Volume K Unit Forecast, by Material 2019 & 2032
- Table 51: Global Autologous Matrix-induced Chondrogenesis Market Revenue Million Forecast, by Application 2019 & 2032
- Table 52: Global Autologous Matrix-induced Chondrogenesis Market Volume K Unit Forecast, by Application 2019 & 2032
- Table 53: Global Autologous Matrix-induced Chondrogenesis Market Revenue Million Forecast, by Country 2019 & 2032
- Table 54: Global Autologous Matrix-induced Chondrogenesis Market Volume K Unit Forecast, by Country 2019 & 2032
- Table 55: China Autologous Matrix-induced Chondrogenesis Market Revenue (Million) Forecast, by Application 2019 & 2032
- Table 56: China Autologous Matrix-induced Chondrogenesis Market Volume (K Unit) Forecast, by Application 2019 & 2032
- Table 57: Japan Autologous Matrix-induced Chondrogenesis Market Revenue (Million) Forecast, by Application 2019 & 2032
- Table 58: Japan Autologous Matrix-induced Chondrogenesis Market Volume (K Unit) Forecast, by Application 2019 & 2032
- Table 59: India Autologous Matrix-induced Chondrogenesis Market Revenue (Million) Forecast, by Application 2019 & 2032
- Table 60: India Autologous Matrix-induced Chondrogenesis Market Volume (K Unit) Forecast, by Application 2019 & 2032
- Table 61: Australia Autologous Matrix-induced Chondrogenesis Market Revenue (Million) Forecast, by Application 2019 & 2032
- Table 62: Australia Autologous Matrix-induced Chondrogenesis Market Volume (K Unit) Forecast, by Application 2019 & 2032
- Table 63: South Korea Autologous Matrix-induced Chondrogenesis Market Revenue (Million) Forecast, by Application 2019 & 2032
- Table 64: South Korea Autologous Matrix-induced Chondrogenesis Market Volume (K Unit) Forecast, by Application 2019 & 2032
- Table 65: Rest of Asia Pacific Autologous Matrix-induced Chondrogenesis Market Revenue (Million) Forecast, by Application 2019 & 2032
- Table 66: Rest of Asia Pacific Autologous Matrix-induced Chondrogenesis Market Volume (K Unit) Forecast, by Application 2019 & 2032
- Table 67: Global Autologous Matrix-induced Chondrogenesis Market Revenue Million Forecast, by Material 2019 & 2032
- Table 68: Global Autologous Matrix-induced Chondrogenesis Market Volume K Unit Forecast, by Material 2019 & 2032
- Table 69: Global Autologous Matrix-induced Chondrogenesis Market Revenue Million Forecast, by Application 2019 & 2032
- Table 70: Global Autologous Matrix-induced Chondrogenesis Market Volume K Unit Forecast, by Application 2019 & 2032
- Table 71: Global Autologous Matrix-induced Chondrogenesis Market Revenue Million Forecast, by Country 2019 & 2032
- Table 72: Global Autologous Matrix-induced Chondrogenesis Market Volume K Unit Forecast, by Country 2019 & 2032
- Table 73: GCC Autologous Matrix-induced Chondrogenesis Market Revenue (Million) Forecast, by Application 2019 & 2032
- Table 74: GCC Autologous Matrix-induced Chondrogenesis Market Volume (K Unit) Forecast, by Application 2019 & 2032
- Table 75: South Africa Autologous Matrix-induced Chondrogenesis Market Revenue (Million) Forecast, by Application 2019 & 2032
- Table 76: South Africa Autologous Matrix-induced Chondrogenesis Market Volume (K Unit) Forecast, by Application 2019 & 2032
- Table 77: Rest of Middle East and Africa Autologous Matrix-induced Chondrogenesis Market Revenue (Million) Forecast, by Application 2019 & 2032
- Table 78: Rest of Middle East and Africa Autologous Matrix-induced Chondrogenesis Market Volume (K Unit) Forecast, by Application 2019 & 2032
- Table 79: Global Autologous Matrix-induced Chondrogenesis Market Revenue Million Forecast, by Material 2019 & 2032
- Table 80: Global Autologous Matrix-induced Chondrogenesis Market Volume K Unit Forecast, by Material 2019 & 2032
- Table 81: Global Autologous Matrix-induced Chondrogenesis Market Revenue Million Forecast, by Application 2019 & 2032
- Table 82: Global Autologous Matrix-induced Chondrogenesis Market Volume K Unit Forecast, by Application 2019 & 2032
- Table 83: Global Autologous Matrix-induced Chondrogenesis Market Revenue Million Forecast, by Country 2019 & 2032
- Table 84: Global Autologous Matrix-induced Chondrogenesis Market Volume K Unit Forecast, by Country 2019 & 2032
- Table 85: Brazil Autologous Matrix-induced Chondrogenesis Market Revenue (Million) Forecast, by Application 2019 & 2032
- Table 86: Brazil Autologous Matrix-induced Chondrogenesis Market Volume (K Unit) Forecast, by Application 2019 & 2032
- Table 87: Argentina Autologous Matrix-induced Chondrogenesis Market Revenue (Million) Forecast, by Application 2019 & 2032
- Table 88: Argentina Autologous Matrix-induced Chondrogenesis Market Volume (K Unit) Forecast, by Application 2019 & 2032
- Table 89: Rest of South America Autologous Matrix-induced Chondrogenesis Market Revenue (Million) Forecast, by Application 2019 & 2032
- Table 90: Rest of South America Autologous Matrix-induced Chondrogenesis Market Volume (K Unit) Forecast, by Application 2019 & 2032
Frequently Asked Questions
1. What is the projected Compound Annual Growth Rate (CAGR) of the Autologous Matrix-induced Chondrogenesis Market?
The projected CAGR is approximately 8.10%.
2. Which companies are prominent players in the Autologous Matrix-induced Chondrogenesis Market?
Key companies in the market include Vericel, CONMED Corporation, CartiHeal, Matricel GmbH, Geistlich Group (Geistlich Pharma AG), Smith+Nephew, JRI Orthopaedics, Anika Therapeutics Inc, Arthrex, Zimmer Biomet Holdings, B Braun SE, Arthro-Kinetics.
3. What are the main segments of the Autologous Matrix-induced Chondrogenesis Market?
The market segments include Material, Application.
4. Can you provide details about the market size?
The market size is estimated to be USD XX Million as of 2022.
5. What are some drivers contributing to market growth?
Rising Prevalence of Bone and Joint Disorders; Increasing Number of Sports and Other Injuries; Growing Demand for Minimally Invasive Procedures.
6. What are the notable trends driving market growth?
Knee Joint Holds Significant Share in the Global Autologous Matrix-induced Chondrogenesis Market Over the Forecast Period.
7. Are there any restraints impacting market growth?
Lack of Proper Reimbursement System; Scarcity of Skilled Professionals and Sufficient Clinical Data.
8. Can you provide examples of recent developments in the market?
October 2022: Collagen Matrix, Inc. and Linden Capital Partners acquired BV Polyganics, a medical technology company that develops and manufactures bioresorbable medical devices. The acquisition expands Collagen Matrix's portfolio of bioresorbable solutions and technology platforms for bone and tissue repair, unlocking new markets and clinical opportunities for the Company.
9. What pricing options are available for accessing the report?
Pricing options include single-user, multi-user, and enterprise licenses priced at USD 4750, USD 5250, and USD 8750 respectively.
10. Is the market size provided in terms of value or volume?
The market size is provided in terms of value, measured in Million and volume, measured in K Unit.
11. Are there any specific market keywords associated with the report?
Yes, the market keyword associated with the report is "Autologous Matrix-induced Chondrogenesis Market," which aids in identifying and referencing the specific market segment covered.
12. How do I determine which pricing option suits my needs best?
The pricing options vary based on user requirements and access needs. Individual users may opt for single-user licenses, while businesses requiring broader access may choose multi-user or enterprise licenses for cost-effective access to the report.
13. Are there any additional resources or data provided in the Autologous Matrix-induced Chondrogenesis Market report?
While the report offers comprehensive insights, it's advisable to review the specific contents or supplementary materials provided to ascertain if additional resources or data are available.
14. How can I stay updated on further developments or reports in the Autologous Matrix-induced Chondrogenesis Market?
To stay informed about further developments, trends, and reports in the Autologous Matrix-induced Chondrogenesis Market, consider subscribing to industry newsletters, following relevant companies and organizations, or regularly checking reputable industry news sources and publications.
Methodology
Step 1 - Identification of Relevant Samples Size from Population Database


Step 2 - Approaches for Defining Global Market Size (Value, Volume* & Price*)

Note*: In applicable scenarios
Step 3 - Data Sources
Primary Research
- Web Analytics
- Survey Reports
- Research Institute
- Latest Research Reports
- Opinion Leaders
Secondary Research
- Annual Reports
- White Paper
- Latest Press Release
- Industry Association
- Paid Database
- Investor Presentations

Step 4 - Data Triangulation
Involves using different sources of information in order to increase the validity of a study
These sources are likely to be stakeholders in a program - participants, other researchers, program staff, other community members, and so on.
Then we put all data in single framework & apply various statistical tools to find out the dynamic on the market.
During the analysis stage, feedback from the stakeholder groups would be compared to determine areas of agreement as well as areas of divergence


