
Key Insights
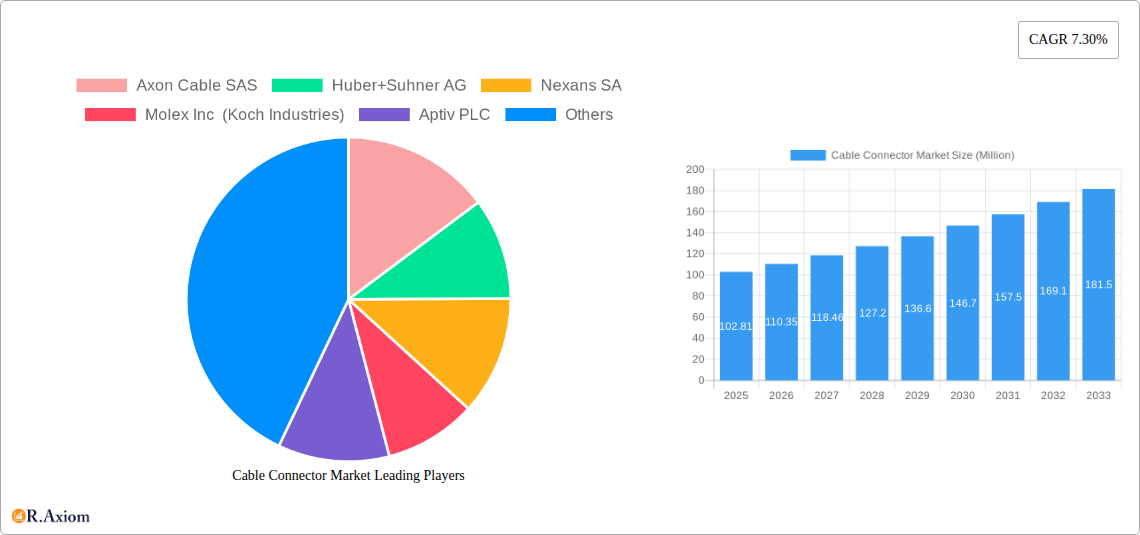
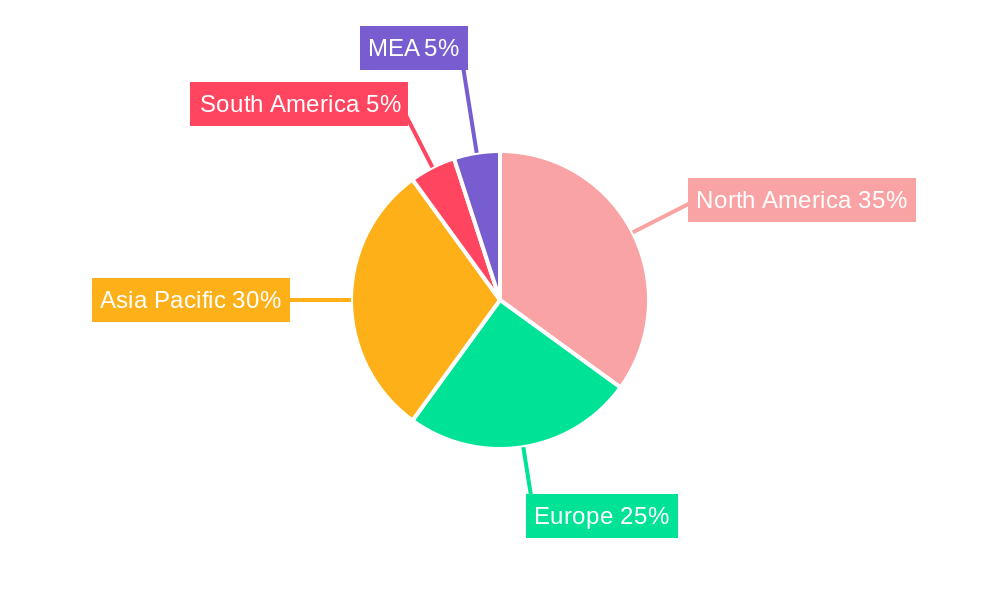
The global cable connector market, valued at $102.81 million in 2025, is projected to experience robust growth, driven by the increasing demand for high-speed data transmission and connectivity across diverse sectors. The market's Compound Annual Growth Rate (CAGR) of 7.30% from 2025 to 2033 reflects a significant expansion fueled by several key factors. The proliferation of smart devices, the rise of the Internet of Things (IoT), and the continuous advancements in automotive electronics are major contributors to this growth. Furthermore, the growing adoption of fiber optic connectors in high-bandwidth applications, such as 5G infrastructure and data centers, significantly boosts market demand. Significant regional variations exist, with North America and Asia Pacific expected to lead the market due to the presence of major technology hubs and substantial investments in infrastructure development. The automotive and transportation sectors represent a significant end-user vertical, propelled by the increasing integration of advanced driver-assistance systems (ADAS) and electric vehicles (EVs).
However, market growth faces certain restraints. Fluctuations in raw material prices, especially for precious metals used in connector manufacturing, can impact profitability. Furthermore, stringent regulatory compliance requirements and the complexities associated with integrating new connector technologies across different platforms present challenges. Nevertheless, ongoing technological innovations, such as miniaturization of connectors and the development of environmentally friendly materials, are likely to mitigate some of these restraints. Segmentation by connector type (PCB, circular/rectangular, fiber optic, IO, and others) and end-user vertical (IT & Telecom, Automotive, Consumer Electronics, Industrial, and others) allows for a detailed understanding of market dynamics and opportunities within specific niches. This granular view is crucial for strategic decision-making by market participants, including established players like Molex, TE Connectivity, and Amphenol, as well as emerging companies.
Cable Connector Market: A Comprehensive Report (2019-2033)
This in-depth report provides a comprehensive analysis of the global Cable Connector Market, offering valuable insights for industry stakeholders, investors, and strategic decision-makers. Covering the period from 2019 to 2033, with a focus on 2025, this report meticulously examines market trends, competitive landscapes, and future growth prospects. The report utilizes rigorous data analysis and expert insights to deliver actionable intelligence. The total market size is predicted to reach xx Million by 2033.
Cable Connector Market Market Concentration & Innovation
The Cable Connector market exhibits a moderately concentrated landscape, with several key players holding significant market share. The top ten companies – Axon Cable SAS, Huber+Suhner AG, Nexans SA, Molex Inc (Koch Industries), Aptiv PLC, Prysmian SpA, 3M Company, Fujitsu Limited, Amphenol Corporation, and Huawei Technologies Co Ltd – collectively account for approximately xx% of the global market in 2025. However, the market also features a number of smaller, specialized players catering to niche segments.
Innovation is a key driver within the industry, fueled by the increasing demand for high-speed data transmission, miniaturization, and enhanced durability in various applications. Regulatory frameworks, particularly those related to safety and environmental standards, significantly influence product design and manufacturing processes. The market witnesses continuous development of new materials and technologies, including advancements in fiber optics, high-speed PCB connectors, and robust circular connectors designed to withstand harsh conditions. Product substitution is a factor, with newer technologies like wireless connectivity potentially impacting certain segments. End-user trends, such as the growth of 5G networks and the rise of electric vehicles, strongly shape demand. Mergers and acquisitions (M&A) activities play a role in market consolidation and technological integration, with deal values totaling an estimated xx Million in the past five years. Notable M&A activities include [Insert specific examples if available, otherwise replace with "several significant acquisitions focused on expanding product portfolios and geographic reach"].
Cable Connector Market Industry Trends & Insights
The Cable Connector market is experiencing robust growth, driven by several key factors. The global CAGR from 2025 to 2033 is projected at xx%. Technological advancements, particularly in high-speed data transmission and miniaturization, are significantly impacting market dynamics. The increasing adoption of high-bandwidth technologies like 5G and the expanding applications of IoT devices are key drivers. Consumer preference for smaller, lighter, and more durable electronics is also contributing to market growth. The competitive landscape is characterized by intense rivalry among established players and emerging competitors, leading to ongoing innovation and price competition. Market penetration is steadily increasing across various end-user verticals, with notable growth observed in the automotive and IT & Telecom sectors. However, challenges remain, such as supply chain disruptions and fluctuating raw material prices, which impact production costs and market stability.

Dominant Markets & Segments in Cable Connector Market
The Asia-Pacific region is currently the dominant market for cable connectors, driven by robust economic growth, expanding industrialization, and the rapid growth of the electronics and telecommunications industries. China, in particular, plays a significant role due to its large manufacturing base and increasing domestic consumption.
- Key Drivers in Asia-Pacific: Strong economic growth, expanding infrastructure, increasing investment in manufacturing, and growing adoption of advanced technologies.
Within the various segments, the following trends are observed:
- Type: The Circular/Rectangular connector segment holds the largest market share, followed by PCB connectors. Fiber optic connectors are experiencing significant growth driven by increasing demand for high-speed data transmission.
- End-user Vertical: The IT & Telecom segment is currently the largest end-user market for cable connectors due to the extensive use of data centers and communication networks. The automotive sector is experiencing rapid growth driven by the rising adoption of electric vehicles and advanced driver-assistance systems (ADAS).
Cable Connector Market Product Developments
Recent product innovations focus on enhancing speed, miniaturization, and durability. Several manufacturers are developing high-speed connectors capable of supporting 100Gb/s and beyond, addressing the growing demand for high-bandwidth applications. Miniaturization is another key area, with connectors designed for smaller devices and tighter spaces gaining prominence. Furthermore, manufacturers are emphasizing the development of connectors that can withstand extreme temperatures, high vibrations, and other harsh environmental conditions. These advancements provide significant competitive advantages, enabling manufacturers to meet the evolving demands of various industries.
Report Scope & Segmentation Analysis
This report segments the Cable Connector market by type (PCB Connectors, Circular/Rectangular Connectors, Fiber Optic Connectors, IO Connectors, Other Types) and end-user vertical (IT and Telecom, Automotive/Transportation, Consumer Electronics, Industrial, Other End-user Verticals). Each segment is analyzed in detail, providing growth projections, market size estimations, and competitive landscapes for the forecast period (2025-2033). For example, the PCB connector segment is expected to witness a CAGR of xx% during the forecast period, driven by the increasing demand for smaller and lighter electronic devices. The Automotive/Transportation segment is anticipated to grow at xx%, fueled by the rising adoption of electric and autonomous vehicles.
Key Drivers of Cable Connector Market Growth
The Cable Connector market is experiencing significant growth driven by technological advancements, economic factors, and regulatory influences. The increasing demand for high-speed data transmission, driven by the proliferation of 5G networks and IoT devices, is a major driver. The growth of the automotive industry, particularly electric vehicles, and the expanding consumer electronics market also significantly contribute. Furthermore, supportive government policies and regulations promoting technological advancements and infrastructure development in various regions are fostering market expansion.
Challenges in the Cable Connector Market Sector
The Cable Connector market faces several challenges, including supply chain disruptions that can impact production and pricing. Fluctuations in raw material costs also present a significant challenge, impacting profitability. Intense competition among established players and new entrants creates price pressure and necessitates continuous innovation. Stricter regulatory compliance requirements add complexity and cost to manufacturing and distribution. These challenges, if not properly managed, can affect market growth and profitability.
Emerging Opportunities in Cable Connector Market
Emerging opportunities exist in specialized applications, including the growing demand for connectors in harsh environments like aerospace and underwater applications. The rise of electric vehicles and autonomous driving systems also presents lucrative opportunities. The expanding adoption of high-speed data transmission technologies opens new avenues for manufacturers developing connectors for 5G and beyond. The increasing demand for miniaturized connectors in wearable devices and other portable electronics offers a further growth opportunity.
Leading Players in the Cable Connector Market Market
- Axon Cable SAS
- Huber+Suhner AG
- Nexans SA
- Molex Inc (Koch Industries)
- Aptiv PLC
- Prysmian SpA
- 3M Company
- Fujitsu Limited
- Amphenol Corporation
- Huawei Technologies Co Ltd
- TE Connectivity Limited
- Yazaki Corporation
- Alcatel-Lucent SA
Key Developments in Cable Connector Market Industry
- September 2021: Amphenol ICC and eTopus Technology announced the development of a 112Gb/s interconnect technology, enhancing high-speed data transmission capabilities.
- November 2021: TE Connectivity launched new connectors designed for robots and UAVs, emphasizing durability and performance in extreme environments.
Strategic Outlook for Cable Connector Market Market
The Cable Connector market is poised for continued growth, driven by ongoing technological advancements and expanding applications across various industries. Opportunities lie in developing high-speed, miniaturized, and environmentally robust connectors that meet the demands of emerging technologies like 5G, IoT, and electric vehicles. Companies that invest in research and development, strategic partnerships, and effective supply chain management will be well-positioned to capitalize on the future market potential.
Cable Connector Market Segmentation
-
1. Type
- 1.1. PCB Connectors
- 1.2. Circular/Rectangular Connectors
- 1.3. Fiber Optic Connectors
- 1.4. IO Connectors
- 1.5. Other Types
-
2. End-user Vertical
- 2.1. IT and Telecom
- 2.2. Automotive/Transportation
- 2.3. Consumer
- 2.4. Industrial
- 2.5. Other En
Cable Connector Market Segmentation By Geography
- 1. North America
- 2. Europe
- 3. Asia Pacific
- 4. Latin America
- 5. Middle East and Africa
Cable Connector Market REPORT HIGHLIGHTS
| Aspects | Details |
|---|---|
| Study Period | 2019-2033 |
| Base Year | 2024 |
| Estimated Year | 2025 |
| Forecast Period | 2025-2033 |
| Historical Period | 2019-2024 |
| Growth Rate | CAGR of 7.30% from 2019-2033 |
| Segmentation |
|
Table of Contents
- 1. Introduction
- 1.1. Research Scope
- 1.2. Market Segmentation
- 1.3. Research Methodology
- 1.4. Definitions and Assumptions
- 2. Executive Summary
- 2.1. Introduction
- 3. Market Dynamics
- 3.1. Introduction
- 3.2. Market Drivers
- 3.2.1. Growing Advancements In The Telecom Sector Coupled With Greater Demand for Improved Connectivity; Increasing Demand for High Bandwidth
- 3.3. Market Restrains
- 3.3.1. Fragmentation in the Regional Markets; Volatility in Raw Material Prices
- 3.4. Market Trends
- 3.4.1. Automotive Sector is Expected to Hold Significant Market Share
- 4. Market Factor Analysis
- 4.1. Porters Five Forces
- 4.2. Supply/Value Chain
- 4.3. PESTEL analysis
- 4.4. Market Entropy
- 4.5. Patent/Trademark Analysis
- 5. Global Cable Connector Market Analysis, Insights and Forecast, 2019-2031
- 5.1. Market Analysis, Insights and Forecast - by Type
- 5.1.1. PCB Connectors
- 5.1.2. Circular/Rectangular Connectors
- 5.1.3. Fiber Optic Connectors
- 5.1.4. IO Connectors
- 5.1.5. Other Types
- 5.2. Market Analysis, Insights and Forecast - by End-user Vertical
- 5.2.1. IT and Telecom
- 5.2.2. Automotive/Transportation
- 5.2.3. Consumer
- 5.2.4. Industrial
- 5.2.5. Other En
- 5.3. Market Analysis, Insights and Forecast - by Region
- 5.3.1. North America
- 5.3.2. Europe
- 5.3.3. Asia Pacific
- 5.3.4. Latin America
- 5.3.5. Middle East and Africa
- 5.1. Market Analysis, Insights and Forecast - by Type
- 6. North America Cable Connector Market Analysis, Insights and Forecast, 2019-2031
- 6.1. Market Analysis, Insights and Forecast - by Type
- 6.1.1. PCB Connectors
- 6.1.2. Circular/Rectangular Connectors
- 6.1.3. Fiber Optic Connectors
- 6.1.4. IO Connectors
- 6.1.5. Other Types
- 6.2. Market Analysis, Insights and Forecast - by End-user Vertical
- 6.2.1. IT and Telecom
- 6.2.2. Automotive/Transportation
- 6.2.3. Consumer
- 6.2.4. Industrial
- 6.2.5. Other En
- 6.1. Market Analysis, Insights and Forecast - by Type
- 7. Europe Cable Connector Market Analysis, Insights and Forecast, 2019-2031
- 7.1. Market Analysis, Insights and Forecast - by Type
- 7.1.1. PCB Connectors
- 7.1.2. Circular/Rectangular Connectors
- 7.1.3. Fiber Optic Connectors
- 7.1.4. IO Connectors
- 7.1.5. Other Types
- 7.2. Market Analysis, Insights and Forecast - by End-user Vertical
- 7.2.1. IT and Telecom
- 7.2.2. Automotive/Transportation
- 7.2.3. Consumer
- 7.2.4. Industrial
- 7.2.5. Other En
- 7.1. Market Analysis, Insights and Forecast - by Type
- 8. Asia Pacific Cable Connector Market Analysis, Insights and Forecast, 2019-2031
- 8.1. Market Analysis, Insights and Forecast - by Type
- 8.1.1. PCB Connectors
- 8.1.2. Circular/Rectangular Connectors
- 8.1.3. Fiber Optic Connectors
- 8.1.4. IO Connectors
- 8.1.5. Other Types
- 8.2. Market Analysis, Insights and Forecast - by End-user Vertical
- 8.2.1. IT and Telecom
- 8.2.2. Automotive/Transportation
- 8.2.3. Consumer
- 8.2.4. Industrial
- 8.2.5. Other En
- 8.1. Market Analysis, Insights and Forecast - by Type
- 9. Latin America Cable Connector Market Analysis, Insights and Forecast, 2019-2031
- 9.1. Market Analysis, Insights and Forecast - by Type
- 9.1.1. PCB Connectors
- 9.1.2. Circular/Rectangular Connectors
- 9.1.3. Fiber Optic Connectors
- 9.1.4. IO Connectors
- 9.1.5. Other Types
- 9.2. Market Analysis, Insights and Forecast - by End-user Vertical
- 9.2.1. IT and Telecom
- 9.2.2. Automotive/Transportation
- 9.2.3. Consumer
- 9.2.4. Industrial
- 9.2.5. Other En
- 9.1. Market Analysis, Insights and Forecast - by Type
- 10. Middle East and Africa Cable Connector Market Analysis, Insights and Forecast, 2019-2031
- 10.1. Market Analysis, Insights and Forecast - by Type
- 10.1.1. PCB Connectors
- 10.1.2. Circular/Rectangular Connectors
- 10.1.3. Fiber Optic Connectors
- 10.1.4. IO Connectors
- 10.1.5. Other Types
- 10.2. Market Analysis, Insights and Forecast - by End-user Vertical
- 10.2.1. IT and Telecom
- 10.2.2. Automotive/Transportation
- 10.2.3. Consumer
- 10.2.4. Industrial
- 10.2.5. Other En
- 10.1. Market Analysis, Insights and Forecast - by Type
- 11. North America Cable Connector Market Analysis, Insights and Forecast, 2019-2031
- 11.1. Market Analysis, Insights and Forecast - By Country/Sub-region
- 11.1.1 United States
- 11.1.2 Canada
- 11.1.3 Mexico
- 12. Europe Cable Connector Market Analysis, Insights and Forecast, 2019-2031
- 12.1. Market Analysis, Insights and Forecast - By Country/Sub-region
- 12.1.1 Germany
- 12.1.2 United Kingdom
- 12.1.3 France
- 12.1.4 Spain
- 12.1.5 Italy
- 12.1.6 Spain
- 12.1.7 Belgium
- 12.1.8 Netherland
- 12.1.9 Nordics
- 12.1.10 Rest of Europe
- 13. Asia Pacific Cable Connector Market Analysis, Insights and Forecast, 2019-2031
- 13.1. Market Analysis, Insights and Forecast - By Country/Sub-region
- 13.1.1 China
- 13.1.2 Japan
- 13.1.3 India
- 13.1.4 South Korea
- 13.1.5 Southeast Asia
- 13.1.6 Australia
- 13.1.7 Indonesia
- 13.1.8 Phillipes
- 13.1.9 Singapore
- 13.1.10 Thailandc
- 13.1.11 Rest of Asia Pacific
- 14. South America Cable Connector Market Analysis, Insights and Forecast, 2019-2031
- 14.1. Market Analysis, Insights and Forecast - By Country/Sub-region
- 14.1.1 Brazil
- 14.1.2 Argentina
- 14.1.3 Peru
- 14.1.4 Chile
- 14.1.5 Colombia
- 14.1.6 Ecuador
- 14.1.7 Venezuela
- 14.1.8 Rest of South America
- 15. MEA Cable Connector Market Analysis, Insights and Forecast, 2019-2031
- 15.1. Market Analysis, Insights and Forecast - By Country/Sub-region
- 15.1.1 United Arab Emirates
- 15.1.2 Saudi Arabia
- 15.1.3 South Africa
- 15.1.4 Rest of Middle East and Africa
- 16. Competitive Analysis
- 16.1. Global Market Share Analysis 2024
- 16.2. Company Profiles
- 16.2.1 Axon Cable SAS
- 16.2.1.1. Overview
- 16.2.1.2. Products
- 16.2.1.3. SWOT Analysis
- 16.2.1.4. Recent Developments
- 16.2.1.5. Financials (Based on Availability)
- 16.2.2 Huber+Suhner AG
- 16.2.2.1. Overview
- 16.2.2.2. Products
- 16.2.2.3. SWOT Analysis
- 16.2.2.4. Recent Developments
- 16.2.2.5. Financials (Based on Availability)
- 16.2.3 Nexans SA
- 16.2.3.1. Overview
- 16.2.3.2. Products
- 16.2.3.3. SWOT Analysis
- 16.2.3.4. Recent Developments
- 16.2.3.5. Financials (Based on Availability)
- 16.2.4 Molex Inc (Koch Industries)
- 16.2.4.1. Overview
- 16.2.4.2. Products
- 16.2.4.3. SWOT Analysis
- 16.2.4.4. Recent Developments
- 16.2.4.5. Financials (Based on Availability)
- 16.2.5 Aptiv PLC
- 16.2.5.1. Overview
- 16.2.5.2. Products
- 16.2.5.3. SWOT Analysis
- 16.2.5.4. Recent Developments
- 16.2.5.5. Financials (Based on Availability)
- 16.2.6 Prysmian SpA
- 16.2.6.1. Overview
- 16.2.6.2. Products
- 16.2.6.3. SWOT Analysis
- 16.2.6.4. Recent Developments
- 16.2.6.5. Financials (Based on Availability)
- 16.2.7 3M Company
- 16.2.7.1. Overview
- 16.2.7.2. Products
- 16.2.7.3. SWOT Analysis
- 16.2.7.4. Recent Developments
- 16.2.7.5. Financials (Based on Availability)
- 16.2.8 Fujitsu Limited
- 16.2.8.1. Overview
- 16.2.8.2. Products
- 16.2.8.3. SWOT Analysis
- 16.2.8.4. Recent Developments
- 16.2.8.5. Financials (Based on Availability)
- 16.2.9 Amphenol Corporation
- 16.2.9.1. Overview
- 16.2.9.2. Products
- 16.2.9.3. SWOT Analysis
- 16.2.9.4. Recent Developments
- 16.2.9.5. Financials (Based on Availability)
- 16.2.10 Huawei Technologies Co Ltd
- 16.2.10.1. Overview
- 16.2.10.2. Products
- 16.2.10.3. SWOT Analysis
- 16.2.10.4. Recent Developments
- 16.2.10.5. Financials (Based on Availability)
- 16.2.11 TE Connectivity Limited
- 16.2.11.1. Overview
- 16.2.11.2. Products
- 16.2.11.3. SWOT Analysis
- 16.2.11.4. Recent Developments
- 16.2.11.5. Financials (Based on Availability)
- 16.2.12 Yazaki Corporation
- 16.2.12.1. Overview
- 16.2.12.2. Products
- 16.2.12.3. SWOT Analysis
- 16.2.12.4. Recent Developments
- 16.2.12.5. Financials (Based on Availability)
- 16.2.13 Alcatel-Lucent SA
- 16.2.13.1. Overview
- 16.2.13.2. Products
- 16.2.13.3. SWOT Analysis
- 16.2.13.4. Recent Developments
- 16.2.13.5. Financials (Based on Availability)
- 16.2.1 Axon Cable SAS
List of Figures
- Figure 1: Global Cable Connector Market Revenue Breakdown (Million, %) by Region 2024 & 2032
- Figure 2: Global Cable Connector Market Volume Breakdown (K Unit, %) by Region 2024 & 2032
- Figure 3: North America Cable Connector Market Revenue (Million), by Country 2024 & 2032
- Figure 4: North America Cable Connector Market Volume (K Unit), by Country 2024 & 2032
- Figure 5: North America Cable Connector Market Revenue Share (%), by Country 2024 & 2032
- Figure 6: North America Cable Connector Market Volume Share (%), by Country 2024 & 2032
- Figure 7: Europe Cable Connector Market Revenue (Million), by Country 2024 & 2032
- Figure 8: Europe Cable Connector Market Volume (K Unit), by Country 2024 & 2032
- Figure 9: Europe Cable Connector Market Revenue Share (%), by Country 2024 & 2032
- Figure 10: Europe Cable Connector Market Volume Share (%), by Country 2024 & 2032
- Figure 11: Asia Pacific Cable Connector Market Revenue (Million), by Country 2024 & 2032
- Figure 12: Asia Pacific Cable Connector Market Volume (K Unit), by Country 2024 & 2032
- Figure 13: Asia Pacific Cable Connector Market Revenue Share (%), by Country 2024 & 2032
- Figure 14: Asia Pacific Cable Connector Market Volume Share (%), by Country 2024 & 2032
- Figure 15: South America Cable Connector Market Revenue (Million), by Country 2024 & 2032
- Figure 16: South America Cable Connector Market Volume (K Unit), by Country 2024 & 2032
- Figure 17: South America Cable Connector Market Revenue Share (%), by Country 2024 & 2032
- Figure 18: South America Cable Connector Market Volume Share (%), by Country 2024 & 2032
- Figure 19: MEA Cable Connector Market Revenue (Million), by Country 2024 & 2032
- Figure 20: MEA Cable Connector Market Volume (K Unit), by Country 2024 & 2032
- Figure 21: MEA Cable Connector Market Revenue Share (%), by Country 2024 & 2032
- Figure 22: MEA Cable Connector Market Volume Share (%), by Country 2024 & 2032
- Figure 23: North America Cable Connector Market Revenue (Million), by Type 2024 & 2032
- Figure 24: North America Cable Connector Market Volume (K Unit), by Type 2024 & 2032
- Figure 25: North America Cable Connector Market Revenue Share (%), by Type 2024 & 2032
- Figure 26: North America Cable Connector Market Volume Share (%), by Type 2024 & 2032
- Figure 27: North America Cable Connector Market Revenue (Million), by End-user Vertical 2024 & 2032
- Figure 28: North America Cable Connector Market Volume (K Unit), by End-user Vertical 2024 & 2032
- Figure 29: North America Cable Connector Market Revenue Share (%), by End-user Vertical 2024 & 2032
- Figure 30: North America Cable Connector Market Volume Share (%), by End-user Vertical 2024 & 2032
- Figure 31: North America Cable Connector Market Revenue (Million), by Country 2024 & 2032
- Figure 32: North America Cable Connector Market Volume (K Unit), by Country 2024 & 2032
- Figure 33: North America Cable Connector Market Revenue Share (%), by Country 2024 & 2032
- Figure 34: North America Cable Connector Market Volume Share (%), by Country 2024 & 2032
- Figure 35: Europe Cable Connector Market Revenue (Million), by Type 2024 & 2032
- Figure 36: Europe Cable Connector Market Volume (K Unit), by Type 2024 & 2032
- Figure 37: Europe Cable Connector Market Revenue Share (%), by Type 2024 & 2032
- Figure 38: Europe Cable Connector Market Volume Share (%), by Type 2024 & 2032
- Figure 39: Europe Cable Connector Market Revenue (Million), by End-user Vertical 2024 & 2032
- Figure 40: Europe Cable Connector Market Volume (K Unit), by End-user Vertical 2024 & 2032
- Figure 41: Europe Cable Connector Market Revenue Share (%), by End-user Vertical 2024 & 2032
- Figure 42: Europe Cable Connector Market Volume Share (%), by End-user Vertical 2024 & 2032
- Figure 43: Europe Cable Connector Market Revenue (Million), by Country 2024 & 2032
- Figure 44: Europe Cable Connector Market Volume (K Unit), by Country 2024 & 2032
- Figure 45: Europe Cable Connector Market Revenue Share (%), by Country 2024 & 2032
- Figure 46: Europe Cable Connector Market Volume Share (%), by Country 2024 & 2032
- Figure 47: Asia Pacific Cable Connector Market Revenue (Million), by Type 2024 & 2032
- Figure 48: Asia Pacific Cable Connector Market Volume (K Unit), by Type 2024 & 2032
- Figure 49: Asia Pacific Cable Connector Market Revenue Share (%), by Type 2024 & 2032
- Figure 50: Asia Pacific Cable Connector Market Volume Share (%), by Type 2024 & 2032
- Figure 51: Asia Pacific Cable Connector Market Revenue (Million), by End-user Vertical 2024 & 2032
- Figure 52: Asia Pacific Cable Connector Market Volume (K Unit), by End-user Vertical 2024 & 2032
- Figure 53: Asia Pacific Cable Connector Market Revenue Share (%), by End-user Vertical 2024 & 2032
- Figure 54: Asia Pacific Cable Connector Market Volume Share (%), by End-user Vertical 2024 & 2032
- Figure 55: Asia Pacific Cable Connector Market Revenue (Million), by Country 2024 & 2032
- Figure 56: Asia Pacific Cable Connector Market Volume (K Unit), by Country 2024 & 2032
- Figure 57: Asia Pacific Cable Connector Market Revenue Share (%), by Country 2024 & 2032
- Figure 58: Asia Pacific Cable Connector Market Volume Share (%), by Country 2024 & 2032
- Figure 59: Latin America Cable Connector Market Revenue (Million), by Type 2024 & 2032
- Figure 60: Latin America Cable Connector Market Volume (K Unit), by Type 2024 & 2032
- Figure 61: Latin America Cable Connector Market Revenue Share (%), by Type 2024 & 2032
- Figure 62: Latin America Cable Connector Market Volume Share (%), by Type 2024 & 2032
- Figure 63: Latin America Cable Connector Market Revenue (Million), by End-user Vertical 2024 & 2032
- Figure 64: Latin America Cable Connector Market Volume (K Unit), by End-user Vertical 2024 & 2032
- Figure 65: Latin America Cable Connector Market Revenue Share (%), by End-user Vertical 2024 & 2032
- Figure 66: Latin America Cable Connector Market Volume Share (%), by End-user Vertical 2024 & 2032
- Figure 67: Latin America Cable Connector Market Revenue (Million), by Country 2024 & 2032
- Figure 68: Latin America Cable Connector Market Volume (K Unit), by Country 2024 & 2032
- Figure 69: Latin America Cable Connector Market Revenue Share (%), by Country 2024 & 2032
- Figure 70: Latin America Cable Connector Market Volume Share (%), by Country 2024 & 2032
- Figure 71: Middle East and Africa Cable Connector Market Revenue (Million), by Type 2024 & 2032
- Figure 72: Middle East and Africa Cable Connector Market Volume (K Unit), by Type 2024 & 2032
- Figure 73: Middle East and Africa Cable Connector Market Revenue Share (%), by Type 2024 & 2032
- Figure 74: Middle East and Africa Cable Connector Market Volume Share (%), by Type 2024 & 2032
- Figure 75: Middle East and Africa Cable Connector Market Revenue (Million), by End-user Vertical 2024 & 2032
- Figure 76: Middle East and Africa Cable Connector Market Volume (K Unit), by End-user Vertical 2024 & 2032
- Figure 77: Middle East and Africa Cable Connector Market Revenue Share (%), by End-user Vertical 2024 & 2032
- Figure 78: Middle East and Africa Cable Connector Market Volume Share (%), by End-user Vertical 2024 & 2032
- Figure 79: Middle East and Africa Cable Connector Market Revenue (Million), by Country 2024 & 2032
- Figure 80: Middle East and Africa Cable Connector Market Volume (K Unit), by Country 2024 & 2032
- Figure 81: Middle East and Africa Cable Connector Market Revenue Share (%), by Country 2024 & 2032
- Figure 82: Middle East and Africa Cable Connector Market Volume Share (%), by Country 2024 & 2032
List of Tables
- Table 1: Global Cable Connector Market Revenue Million Forecast, by Region 2019 & 2032
- Table 2: Global Cable Connector Market Volume K Unit Forecast, by Region 2019 & 2032
- Table 3: Global Cable Connector Market Revenue Million Forecast, by Type 2019 & 2032
- Table 4: Global Cable Connector Market Volume K Unit Forecast, by Type 2019 & 2032
- Table 5: Global Cable Connector Market Revenue Million Forecast, by End-user Vertical 2019 & 2032
- Table 6: Global Cable Connector Market Volume K Unit Forecast, by End-user Vertical 2019 & 2032
- Table 7: Global Cable Connector Market Revenue Million Forecast, by Region 2019 & 2032
- Table 8: Global Cable Connector Market Volume K Unit Forecast, by Region 2019 & 2032
- Table 9: Global Cable Connector Market Revenue Million Forecast, by Country 2019 & 2032
- Table 10: Global Cable Connector Market Volume K Unit Forecast, by Country 2019 & 2032
- Table 11: United States Cable Connector Market Revenue (Million) Forecast, by Application 2019 & 2032
- Table 12: United States Cable Connector Market Volume (K Unit) Forecast, by Application 2019 & 2032
- Table 13: Canada Cable Connector Market Revenue (Million) Forecast, by Application 2019 & 2032
- Table 14: Canada Cable Connector Market Volume (K Unit) Forecast, by Application 2019 & 2032
- Table 15: Mexico Cable Connector Market Revenue (Million) Forecast, by Application 2019 & 2032
- Table 16: Mexico Cable Connector Market Volume (K Unit) Forecast, by Application 2019 & 2032
- Table 17: Global Cable Connector Market Revenue Million Forecast, by Country 2019 & 2032
- Table 18: Global Cable Connector Market Volume K Unit Forecast, by Country 2019 & 2032
- Table 19: Germany Cable Connector Market Revenue (Million) Forecast, by Application 2019 & 2032
- Table 20: Germany Cable Connector Market Volume (K Unit) Forecast, by Application 2019 & 2032
- Table 21: United Kingdom Cable Connector Market Revenue (Million) Forecast, by Application 2019 & 2032
- Table 22: United Kingdom Cable Connector Market Volume (K Unit) Forecast, by Application 2019 & 2032
- Table 23: France Cable Connector Market Revenue (Million) Forecast, by Application 2019 & 2032
- Table 24: France Cable Connector Market Volume (K Unit) Forecast, by Application 2019 & 2032
- Table 25: Spain Cable Connector Market Revenue (Million) Forecast, by Application 2019 & 2032
- Table 26: Spain Cable Connector Market Volume (K Unit) Forecast, by Application 2019 & 2032
- Table 27: Italy Cable Connector Market Revenue (Million) Forecast, by Application 2019 & 2032
- Table 28: Italy Cable Connector Market Volume (K Unit) Forecast, by Application 2019 & 2032
- Table 29: Spain Cable Connector Market Revenue (Million) Forecast, by Application 2019 & 2032
- Table 30: Spain Cable Connector Market Volume (K Unit) Forecast, by Application 2019 & 2032
- Table 31: Belgium Cable Connector Market Revenue (Million) Forecast, by Application 2019 & 2032
- Table 32: Belgium Cable Connector Market Volume (K Unit) Forecast, by Application 2019 & 2032
- Table 33: Netherland Cable Connector Market Revenue (Million) Forecast, by Application 2019 & 2032
- Table 34: Netherland Cable Connector Market Volume (K Unit) Forecast, by Application 2019 & 2032
- Table 35: Nordics Cable Connector Market Revenue (Million) Forecast, by Application 2019 & 2032
- Table 36: Nordics Cable Connector Market Volume (K Unit) Forecast, by Application 2019 & 2032
- Table 37: Rest of Europe Cable Connector Market Revenue (Million) Forecast, by Application 2019 & 2032
- Table 38: Rest of Europe Cable Connector Market Volume (K Unit) Forecast, by Application 2019 & 2032
- Table 39: Global Cable Connector Market Revenue Million Forecast, by Country 2019 & 2032
- Table 40: Global Cable Connector Market Volume K Unit Forecast, by Country 2019 & 2032
- Table 41: China Cable Connector Market Revenue (Million) Forecast, by Application 2019 & 2032
- Table 42: China Cable Connector Market Volume (K Unit) Forecast, by Application 2019 & 2032
- Table 43: Japan Cable Connector Market Revenue (Million) Forecast, by Application 2019 & 2032
- Table 44: Japan Cable Connector Market Volume (K Unit) Forecast, by Application 2019 & 2032
- Table 45: India Cable Connector Market Revenue (Million) Forecast, by Application 2019 & 2032
- Table 46: India Cable Connector Market Volume (K Unit) Forecast, by Application 2019 & 2032
- Table 47: South Korea Cable Connector Market Revenue (Million) Forecast, by Application 2019 & 2032
- Table 48: South Korea Cable Connector Market Volume (K Unit) Forecast, by Application 2019 & 2032
- Table 49: Southeast Asia Cable Connector Market Revenue (Million) Forecast, by Application 2019 & 2032
- Table 50: Southeast Asia Cable Connector Market Volume (K Unit) Forecast, by Application 2019 & 2032
- Table 51: Australia Cable Connector Market Revenue (Million) Forecast, by Application 2019 & 2032
- Table 52: Australia Cable Connector Market Volume (K Unit) Forecast, by Application 2019 & 2032
- Table 53: Indonesia Cable Connector Market Revenue (Million) Forecast, by Application 2019 & 2032
- Table 54: Indonesia Cable Connector Market Volume (K Unit) Forecast, by Application 2019 & 2032
- Table 55: Phillipes Cable Connector Market Revenue (Million) Forecast, by Application 2019 & 2032
- Table 56: Phillipes Cable Connector Market Volume (K Unit) Forecast, by Application 2019 & 2032
- Table 57: Singapore Cable Connector Market Revenue (Million) Forecast, by Application 2019 & 2032
- Table 58: Singapore Cable Connector Market Volume (K Unit) Forecast, by Application 2019 & 2032
- Table 59: Thailandc Cable Connector Market Revenue (Million) Forecast, by Application 2019 & 2032
- Table 60: Thailandc Cable Connector Market Volume (K Unit) Forecast, by Application 2019 & 2032
- Table 61: Rest of Asia Pacific Cable Connector Market Revenue (Million) Forecast, by Application 2019 & 2032
- Table 62: Rest of Asia Pacific Cable Connector Market Volume (K Unit) Forecast, by Application 2019 & 2032
- Table 63: Global Cable Connector Market Revenue Million Forecast, by Country 2019 & 2032
- Table 64: Global Cable Connector Market Volume K Unit Forecast, by Country 2019 & 2032
- Table 65: Brazil Cable Connector Market Revenue (Million) Forecast, by Application 2019 & 2032
- Table 66: Brazil Cable Connector Market Volume (K Unit) Forecast, by Application 2019 & 2032
- Table 67: Argentina Cable Connector Market Revenue (Million) Forecast, by Application 2019 & 2032
- Table 68: Argentina Cable Connector Market Volume (K Unit) Forecast, by Application 2019 & 2032
- Table 69: Peru Cable Connector Market Revenue (Million) Forecast, by Application 2019 & 2032
- Table 70: Peru Cable Connector Market Volume (K Unit) Forecast, by Application 2019 & 2032
- Table 71: Chile Cable Connector Market Revenue (Million) Forecast, by Application 2019 & 2032
- Table 72: Chile Cable Connector Market Volume (K Unit) Forecast, by Application 2019 & 2032
- Table 73: Colombia Cable Connector Market Revenue (Million) Forecast, by Application 2019 & 2032
- Table 74: Colombia Cable Connector Market Volume (K Unit) Forecast, by Application 2019 & 2032
- Table 75: Ecuador Cable Connector Market Revenue (Million) Forecast, by Application 2019 & 2032
- Table 76: Ecuador Cable Connector Market Volume (K Unit) Forecast, by Application 2019 & 2032
- Table 77: Venezuela Cable Connector Market Revenue (Million) Forecast, by Application 2019 & 2032
- Table 78: Venezuela Cable Connector Market Volume (K Unit) Forecast, by Application 2019 & 2032
- Table 79: Rest of South America Cable Connector Market Revenue (Million) Forecast, by Application 2019 & 2032
- Table 80: Rest of South America Cable Connector Market Volume (K Unit) Forecast, by Application 2019 & 2032
- Table 81: Global Cable Connector Market Revenue Million Forecast, by Country 2019 & 2032
- Table 82: Global Cable Connector Market Volume K Unit Forecast, by Country 2019 & 2032
- Table 83: United Arab Emirates Cable Connector Market Revenue (Million) Forecast, by Application 2019 & 2032
- Table 84: United Arab Emirates Cable Connector Market Volume (K Unit) Forecast, by Application 2019 & 2032
- Table 85: Saudi Arabia Cable Connector Market Revenue (Million) Forecast, by Application 2019 & 2032
- Table 86: Saudi Arabia Cable Connector Market Volume (K Unit) Forecast, by Application 2019 & 2032
- Table 87: South Africa Cable Connector Market Revenue (Million) Forecast, by Application 2019 & 2032
- Table 88: South Africa Cable Connector Market Volume (K Unit) Forecast, by Application 2019 & 2032
- Table 89: Rest of Middle East and Africa Cable Connector Market Revenue (Million) Forecast, by Application 2019 & 2032
- Table 90: Rest of Middle East and Africa Cable Connector Market Volume (K Unit) Forecast, by Application 2019 & 2032
- Table 91: Global Cable Connector Market Revenue Million Forecast, by Type 2019 & 2032
- Table 92: Global Cable Connector Market Volume K Unit Forecast, by Type 2019 & 2032
- Table 93: Global Cable Connector Market Revenue Million Forecast, by End-user Vertical 2019 & 2032
- Table 94: Global Cable Connector Market Volume K Unit Forecast, by End-user Vertical 2019 & 2032
- Table 95: Global Cable Connector Market Revenue Million Forecast, by Country 2019 & 2032
- Table 96: Global Cable Connector Market Volume K Unit Forecast, by Country 2019 & 2032
- Table 97: Global Cable Connector Market Revenue Million Forecast, by Type 2019 & 2032
- Table 98: Global Cable Connector Market Volume K Unit Forecast, by Type 2019 & 2032
- Table 99: Global Cable Connector Market Revenue Million Forecast, by End-user Vertical 2019 & 2032
- Table 100: Global Cable Connector Market Volume K Unit Forecast, by End-user Vertical 2019 & 2032
- Table 101: Global Cable Connector Market Revenue Million Forecast, by Country 2019 & 2032
- Table 102: Global Cable Connector Market Volume K Unit Forecast, by Country 2019 & 2032
- Table 103: Global Cable Connector Market Revenue Million Forecast, by Type 2019 & 2032
- Table 104: Global Cable Connector Market Volume K Unit Forecast, by Type 2019 & 2032
- Table 105: Global Cable Connector Market Revenue Million Forecast, by End-user Vertical 2019 & 2032
- Table 106: Global Cable Connector Market Volume K Unit Forecast, by End-user Vertical 2019 & 2032
- Table 107: Global Cable Connector Market Revenue Million Forecast, by Country 2019 & 2032
- Table 108: Global Cable Connector Market Volume K Unit Forecast, by Country 2019 & 2032
- Table 109: Global Cable Connector Market Revenue Million Forecast, by Type 2019 & 2032
- Table 110: Global Cable Connector Market Volume K Unit Forecast, by Type 2019 & 2032
- Table 111: Global Cable Connector Market Revenue Million Forecast, by End-user Vertical 2019 & 2032
- Table 112: Global Cable Connector Market Volume K Unit Forecast, by End-user Vertical 2019 & 2032
- Table 113: Global Cable Connector Market Revenue Million Forecast, by Country 2019 & 2032
- Table 114: Global Cable Connector Market Volume K Unit Forecast, by Country 2019 & 2032
- Table 115: Global Cable Connector Market Revenue Million Forecast, by Type 2019 & 2032
- Table 116: Global Cable Connector Market Volume K Unit Forecast, by Type 2019 & 2032
- Table 117: Global Cable Connector Market Revenue Million Forecast, by End-user Vertical 2019 & 2032
- Table 118: Global Cable Connector Market Volume K Unit Forecast, by End-user Vertical 2019 & 2032
- Table 119: Global Cable Connector Market Revenue Million Forecast, by Country 2019 & 2032
- Table 120: Global Cable Connector Market Volume K Unit Forecast, by Country 2019 & 2032
Frequently Asked Questions
1. What is the projected Compound Annual Growth Rate (CAGR) of the Cable Connector Market?
The projected CAGR is approximately 7.30%.
2. Which companies are prominent players in the Cable Connector Market?
Key companies in the market include Axon Cable SAS, Huber+Suhner AG, Nexans SA, Molex Inc (Koch Industries), Aptiv PLC, Prysmian SpA, 3M Company, Fujitsu Limited, Amphenol Corporation, Huawei Technologies Co Ltd, TE Connectivity Limited, Yazaki Corporation, Alcatel-Lucent SA.
3. What are the main segments of the Cable Connector Market?
The market segments include Type, End-user Vertical.
4. Can you provide details about the market size?
The market size is estimated to be USD 102.81 Million as of 2022.
5. What are some drivers contributing to market growth?
Growing Advancements In The Telecom Sector Coupled With Greater Demand for Improved Connectivity; Increasing Demand for High Bandwidth.
6. What are the notable trends driving market growth?
Automotive Sector is Expected to Hold Significant Market Share.
7. Are there any restraints impacting market growth?
Fragmentation in the Regional Markets; Volatility in Raw Material Prices.
8. Can you provide examples of recent developments in the market?
November 2021 - TE Connectivity announced the launch of new connectors that are designed to work with robots and UAVs. To protect the unit from extreme environments, the connector is encased in a high-temperature rated plastic assembly. The connector is also outfitted with contact position locks to secure the housing during high and frequent vibration events.
9. What pricing options are available for accessing the report?
Pricing options include single-user, multi-user, and enterprise licenses priced at USD 4750, USD 5250, and USD 8750 respectively.
10. Is the market size provided in terms of value or volume?
The market size is provided in terms of value, measured in Million and volume, measured in K Unit.
11. Are there any specific market keywords associated with the report?
Yes, the market keyword associated with the report is "Cable Connector Market," which aids in identifying and referencing the specific market segment covered.
12. How do I determine which pricing option suits my needs best?
The pricing options vary based on user requirements and access needs. Individual users may opt for single-user licenses, while businesses requiring broader access may choose multi-user or enterprise licenses for cost-effective access to the report.
13. Are there any additional resources or data provided in the Cable Connector Market report?
While the report offers comprehensive insights, it's advisable to review the specific contents or supplementary materials provided to ascertain if additional resources or data are available.
14. How can I stay updated on further developments or reports in the Cable Connector Market?
To stay informed about further developments, trends, and reports in the Cable Connector Market, consider subscribing to industry newsletters, following relevant companies and organizations, or regularly checking reputable industry news sources and publications.
Methodology
Step 1 - Identification of Relevant Samples Size from Population Database


Step 2 - Approaches for Defining Global Market Size (Value, Volume* & Price*)

Note*: In applicable scenarios
Step 3 - Data Sources
Primary Research
- Web Analytics
- Survey Reports
- Research Institute
- Latest Research Reports
- Opinion Leaders
Secondary Research
- Annual Reports
- White Paper
- Latest Press Release
- Industry Association
- Paid Database
- Investor Presentations

Step 4 - Data Triangulation
Involves using different sources of information in order to increase the validity of a study
These sources are likely to be stakeholders in a program - participants, other researchers, program staff, other community members, and so on.
Then we put all data in single framework & apply various statistical tools to find out the dynamic on the market.
During the analysis stage, feedback from the stakeholder groups would be compared to determine areas of agreement as well as areas of divergence


