
Key Insights
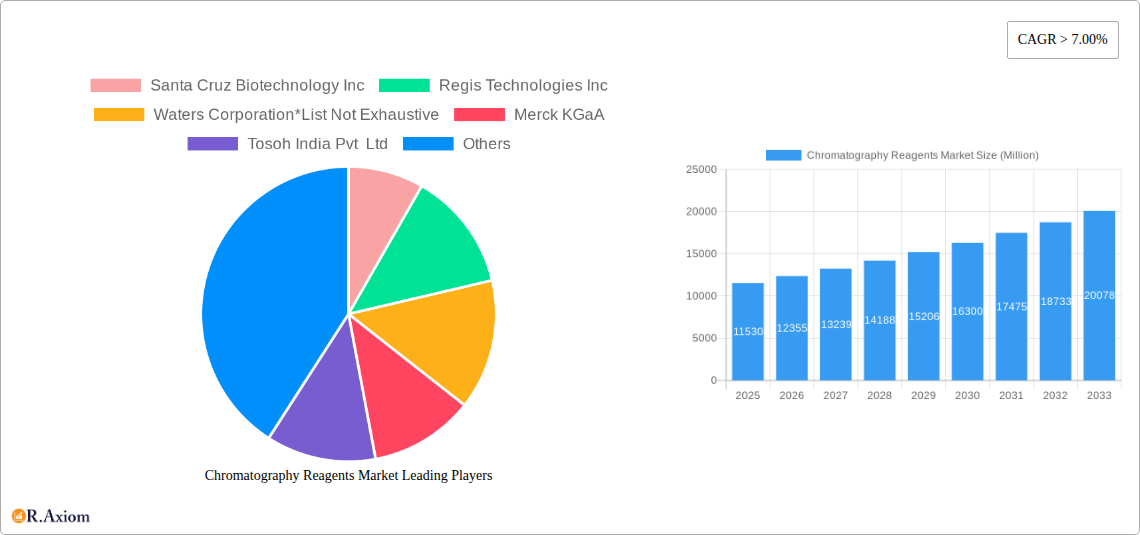
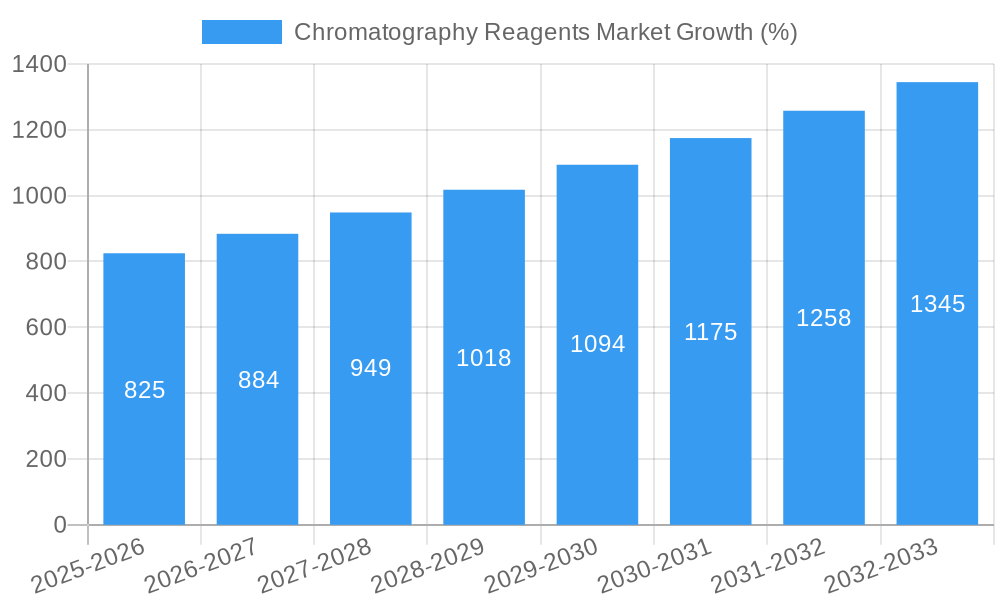
The Chromatography Reagents market is experiencing robust growth, projected to reach a valuation exceeding $11.53 billion by 2025 and maintain a Compound Annual Growth Rate (CAGR) of over 7% through 2033. This expansion is driven by several key factors. The increasing demand for advanced analytical techniques across diverse sectors like pharmaceuticals, food and beverages, and environmental analysis fuels market growth. Stringent regulatory requirements for product purity and safety in these industries necessitate the use of high-quality chromatography reagents, further bolstering market demand. Technological advancements leading to improved efficiency, sensitivity, and resolution in chromatography techniques are also significant drivers. The development of novel reagents tailored for specific applications, such as those focusing on biopharmaceutical analysis, contributes to market expansion. Furthermore, the rising prevalence of chronic diseases globally is fueling the demand for advanced drug discovery and development, which heavily relies on chromatography techniques. The market's diverse segmentations, encompassing various reagent types (buffers, ion pair reagents, solvents, derivatization reagents), mobile phases (gas, liquid, supercritical fluid chromatography), and technologies (ion exchange, affinity, size exclusion, etc.), present lucrative opportunities for specialized reagent manufacturers.
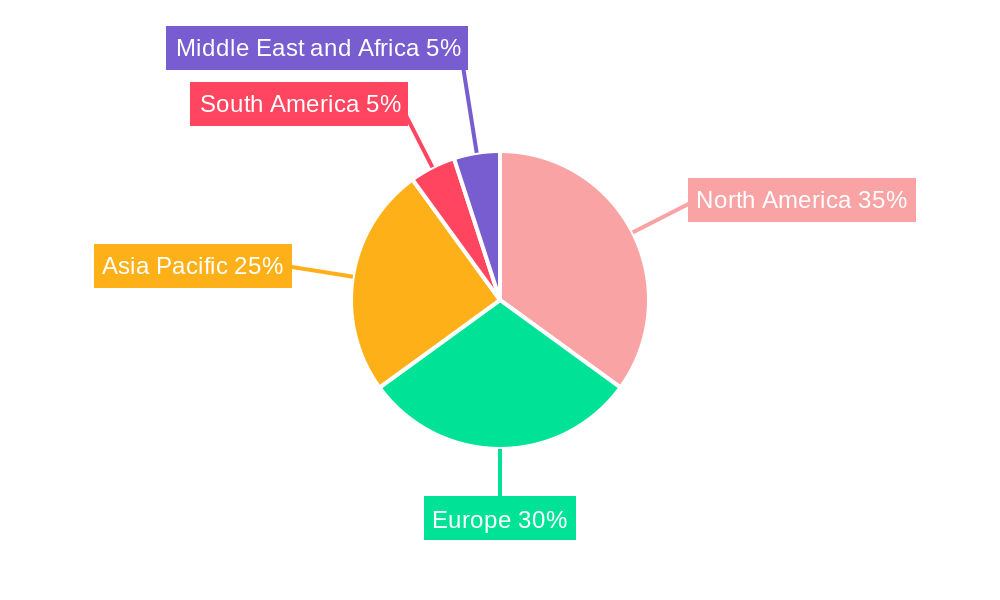
Growth across different geographical regions varies, reflecting varying levels of industrial development and regulatory frameworks. The Asia-Pacific region, particularly China and India, is expected to witness significant growth due to rapid industrialization and increasing investment in research and development. North America and Europe, while already mature markets, are also experiencing consistent growth, driven by the robust pharmaceutical and biotechnology sectors. However, challenges remain; the high cost of advanced chromatography reagents and potential environmental concerns associated with some reagent types present some restraints. Nonetheless, the overall market outlook remains positive, driven by the enduring importance of chromatography in diverse analytical applications and ongoing innovation within the reagent manufacturing sector. The projected market size for 2033 can be estimated by applying the CAGR to the 2025 value; assuming a consistent 7% CAGR, the market could exceed $20 billion by 2033.
Chromatography Reagents Market: A Comprehensive Report (2019-2033)
This detailed report provides a comprehensive analysis of the Chromatography Reagents Market, covering market size, segmentation, growth drivers, challenges, and key players. The study period spans from 2019 to 2033, with 2025 serving as the base and estimated year. The report offers actionable insights for industry stakeholders, including manufacturers, distributors, and researchers. The market is expected to reach xx Million by 2033, exhibiting a CAGR of xx% during the forecast period (2025-2033).
Chromatography Reagents Market Concentration & Innovation
The Chromatography Reagents Market exhibits a moderately concentrated landscape, with several major players holding significant market share. However, the market also features numerous smaller companies specializing in niche segments or specific technologies. The market share of the top five players is estimated at xx%, indicating a competitive environment. Innovation is a key driver, fueled by advancements in separation techniques, such as the development of novel stationary phases and detection methods. Regulatory frameworks, particularly those related to quality control and safety standards (e.g., GMP), significantly impact market dynamics. Product substitutes, while limited, exist in specific applications, creating competitive pressures. End-user trends towards high-throughput screening and automation drive demand for efficient and high-quality reagents. M&A activity has been moderate, with deal values averaging xx Million in recent years. Examples include:
- Strategic Acquisitions: Companies like Thermo Fisher Scientific Inc. and Agilent Technologies Inc. have historically engaged in acquisitions to expand their product portfolios and market reach.
- Partnerships and Joint Ventures: Collaboration between reagent manufacturers and instrument manufacturers are frequent.
Chromatography Reagents Market Industry Trends & Insights
The Chromatography Reagents market is experiencing robust growth, driven by the increasing adoption of chromatography techniques across various industries. The pharmaceutical industry remains the dominant application segment, fueled by stringent quality control requirements and the growing complexity of drug discovery and development. Technological advancements, including the development of high-performance liquid chromatography (HPLC) and ultra-high-performance liquid chromatography (UHPLC) systems, have increased the efficiency and sensitivity of chromatographic separations. The market penetration of advanced chromatography techniques, like supercritical fluid chromatography (SFC), continues to rise due to its advantages in terms of speed, resolution, and environmental friendliness. The rise of personalized medicine further drives demand, as customized assays requiring chromatography reagents are necessary. The competitive landscape is marked by both intense competition among established players and the emergence of new entrants offering innovative products. The market is predicted to experience a steady growth trajectory due to continuous investment in R&D, enabling the development of advanced chromatography solutions for a broader range of applications.
Dominant Markets & Segments in Chromatography Reagents Market
The North American region currently dominates the Chromatography Reagents Market, driven by strong demand from the pharmaceutical and biotechnology sectors. However, the Asia-Pacific region is exhibiting rapid growth, fueled by increasing investments in healthcare infrastructure and R&D activities.
Key Drivers by Segment:
Type:
- Liquid Chromatography Reagents: This segment holds the largest market share due to its widespread use across various applications. Strong growth is expected due to its adaptability and ease of use.
- Gas Chromatography Reagents: This segment experiences steady growth driven by applications in environmental monitoring and food safety analysis.
- Buffers: High demand due to the critical role in maintaining optimal pH during chromatographic separation.
Physical State of Mobile Phase:
- Liquid Chromatography Reagents: Dominant share due to wider applications.
Technology:
- HPLC: Continues to dominate owing to its established technology and versatility.
- UHPLC: Rapidly growing segment thanks to its enhanced speed and resolution.
Application:
- Pharmaceutical: Remains the largest and fastest-growing application segment due to stringent regulatory requirements and the complexity of drug discovery.
- Food and Beverages: Growing demand for food safety and quality control drives growth.
- Water and Environmental Analysis: Stringent regulations regarding water quality contribute to substantial market growth.
Chromatography Reagents Market Product Developments
Recent product innovations focus on enhanced performance, improved selectivity, and increased ease of use. Manufacturers are developing novel stationary phases with advanced chemistries, high-performance detectors, and automated sample preparation systems. These innovations cater to the increasing demand for faster analysis times, higher sensitivity, and greater efficiency in various applications.
Report Scope & Segmentation Analysis
This report segments the Chromatography Reagents market by Type (Buffers, Ion Pair Reagents, Solvents, Other Types), Physical State of Mobile Phase (Gas Chromatography Reagents, Liquid Chromatography Reagents, Super Critical Fluid Chromatography (SFC) Reagents), Technology (Ion Exchange, Affinity Exchange, Size Exclusion, Hydrophobic Interaction, Mixed Mode, Other Technologies), and Application (Pharmaceutical, Food and Beverages, Water and Environmental Analysis, Other Applications). Each segment’s growth trajectory, market size, and competitive dynamics are thoroughly analyzed, providing a granular understanding of the market structure. The global market is also geographically segmented into key regions for a comprehensive regional analysis.
Key Drivers of Chromatography Reagents Market Growth
The Chromatography Reagents Market is driven by several factors, including increasing demand for advanced analytical techniques in various industries (pharmaceutical, food & beverage, environmental), technological advancements leading to improved sensitivity and efficiency, stringent regulatory requirements enforcing quality control, and rising investments in R&D across the globe. These factors collectively propel market expansion and adoption.
Challenges in the Chromatography Reagents Market Sector
Challenges include stringent regulatory compliance, fluctuating raw material prices potentially impacting profitability and product pricing, intense competition leading to price pressures, and the emergence of substitute technologies (e.g., mass spectrometry) in specific applications that might pose challenges to some established techniques and require manufacturers to continuously innovate.
Emerging Opportunities in Chromatography Reagents Market
Emerging opportunities include the growing adoption of chromatography in personalized medicine and diagnostics, the development of more sustainable and environmentally friendly reagents, and the integration of chromatography with other analytical techniques like mass spectrometry for comprehensive analysis.
Leading Players in the Chromatography Reagents Market Market
- Santa Cruz Biotechnology Inc
- Regis Technologies Inc
- Waters Corporation
- Merck KGaA
- Tosoh India Pvt Ltd
- ITW Reagents
- Thermo Fisher Scientific Inc
- Agilent Technologies Inc
- Avantor Inc
- Tokyo Chemical Industry
- Shimadzu Corporation
Key Developments in Chromatography Reagents Market Industry
- March 2023: Avantor was awarded the Best Bioprocessing Company for Chromatography at the Asia-Pacific Bioprocessing Excellence Awards 2023 (ABEA), highlighting the company’s innovative chromatography solutions. This win strengthens Avantor's market position and brand image.
- December 2022: Tokyo Chemical Industry discontinued the sale of chromatography products such as HPLC columns and related products. This decision impacts market supply and could potentially benefit competitors.
Strategic Outlook for Chromatography Reagents Market Market
The Chromatography Reagents Market is poised for continued growth, driven by technological advancements, expanding applications across diverse industries, and rising R&D investments. Strategic partnerships, product innovation, and geographical expansion will be critical for companies seeking to capitalize on future market opportunities and maintain a competitive edge in this dynamic sector. The market’s long-term outlook remains positive, with consistent demand driven by the ever-increasing need for advanced analytical solutions in various scientific and industrial sectors.
Chromatography Reagents Market Segmentation
-
1. Type
- 1.1. Buffers
- 1.2. Ion Pair Reagents
- 1.3. Solvents
- 1.4. Other Types (Derivatization Reagents, Etc.)
-
2. Physical State of Mobile Phase
- 2.1. Gas Chromatography Reagents
- 2.2. Liquid Chromatography Reagents
- 2.3. Super Critical Fluid Chromatography (SFC) Reagents
-
3. Technology
- 3.1. Ion Exchange
- 3.2. Affinity Exchange
- 3.3. Size Exclusion
- 3.4. Hydrophobic Interaction
- 3.5. Mixed Mode
- 3.6. Other Te
-
4. Application
- 4.1. Pharmaceutical
- 4.2. Food and Beverages
- 4.3. Water and Environmental Analysis
- 4.4. Other Ap
Chromatography Reagents Market Segmentation By Geography
-
1. Asia Pacific
- 1.1. China
- 1.2. India
- 1.3. Japan
- 1.4. South Korea
- 1.5. Rest of Asia Pacific
-
2. North America
- 2.1. United States
- 2.2. Canada
- 2.3. Mexico
-
3. Europe
- 3.1. Germany
- 3.2. United Kingdom
- 3.3. Italy
- 3.4. France
- 3.5. Rest of Europe
-
4. South America
- 4.1. Brazil
- 4.2. Argentina
- 4.3. Rest of South America
-
5. Middle East and Africa
- 5.1. Saudi Arabia
- 5.2. South Africa
- 5.3. Rest of Middle East and Africa
Chromatography Reagents Market REPORT HIGHLIGHTS
| Aspects | Details |
|---|---|
| Study Period | 2019-2033 |
| Base Year | 2024 |
| Estimated Year | 2025 |
| Forecast Period | 2025-2033 |
| Historical Period | 2019-2024 |
| Growth Rate | CAGR of > 7.00% from 2019-2033 |
| Segmentation |
|
Table of Contents
- 1. Introduction
- 1.1. Research Scope
- 1.2. Market Segmentation
- 1.3. Research Methodology
- 1.4. Definitions and Assumptions
- 2. Executive Summary
- 2.1. Introduction
- 3. Market Dynamics
- 3.1. Introduction
- 3.2. Market Drivers
- 3.2.1. Increasing Demand for Chromatography Reagents from the Pharmaceutical Sector; Increasing R&D Investment in Biotechnology Sector; Other Drivers
- 3.3. Market Restrains
- 3.3.1. High Cost of Chromatography Reagents; Other Restraints
- 3.4. Market Trends
- 3.4.1. Increasing Demand from Pharmaceutical Sector
- 4. Market Factor Analysis
- 4.1. Porters Five Forces
- 4.2. Supply/Value Chain
- 4.3. PESTEL analysis
- 4.4. Market Entropy
- 4.5. Patent/Trademark Analysis
- 5. Global Chromatography Reagents Market Analysis, Insights and Forecast, 2019-2031
- 5.1. Market Analysis, Insights and Forecast - by Type
- 5.1.1. Buffers
- 5.1.2. Ion Pair Reagents
- 5.1.3. Solvents
- 5.1.4. Other Types (Derivatization Reagents, Etc.)
- 5.2. Market Analysis, Insights and Forecast - by Physical State of Mobile Phase
- 5.2.1. Gas Chromatography Reagents
- 5.2.2. Liquid Chromatography Reagents
- 5.2.3. Super Critical Fluid Chromatography (SFC) Reagents
- 5.3. Market Analysis, Insights and Forecast - by Technology
- 5.3.1. Ion Exchange
- 5.3.2. Affinity Exchange
- 5.3.3. Size Exclusion
- 5.3.4. Hydrophobic Interaction
- 5.3.5. Mixed Mode
- 5.3.6. Other Te
- 5.4. Market Analysis, Insights and Forecast - by Application
- 5.4.1. Pharmaceutical
- 5.4.2. Food and Beverages
- 5.4.3. Water and Environmental Analysis
- 5.4.4. Other Ap
- 5.5. Market Analysis, Insights and Forecast - by Region
- 5.5.1. Asia Pacific
- 5.5.2. North America
- 5.5.3. Europe
- 5.5.4. South America
- 5.5.5. Middle East and Africa
- 5.1. Market Analysis, Insights and Forecast - by Type
- 6. Asia Pacific Chromatography Reagents Market Analysis, Insights and Forecast, 2019-2031
- 6.1. Market Analysis, Insights and Forecast - by Type
- 6.1.1. Buffers
- 6.1.2. Ion Pair Reagents
- 6.1.3. Solvents
- 6.1.4. Other Types (Derivatization Reagents, Etc.)
- 6.2. Market Analysis, Insights and Forecast - by Physical State of Mobile Phase
- 6.2.1. Gas Chromatography Reagents
- 6.2.2. Liquid Chromatography Reagents
- 6.2.3. Super Critical Fluid Chromatography (SFC) Reagents
- 6.3. Market Analysis, Insights and Forecast - by Technology
- 6.3.1. Ion Exchange
- 6.3.2. Affinity Exchange
- 6.3.3. Size Exclusion
- 6.3.4. Hydrophobic Interaction
- 6.3.5. Mixed Mode
- 6.3.6. Other Te
- 6.4. Market Analysis, Insights and Forecast - by Application
- 6.4.1. Pharmaceutical
- 6.4.2. Food and Beverages
- 6.4.3. Water and Environmental Analysis
- 6.4.4. Other Ap
- 6.1. Market Analysis, Insights and Forecast - by Type
- 7. North America Chromatography Reagents Market Analysis, Insights and Forecast, 2019-2031
- 7.1. Market Analysis, Insights and Forecast - by Type
- 7.1.1. Buffers
- 7.1.2. Ion Pair Reagents
- 7.1.3. Solvents
- 7.1.4. Other Types (Derivatization Reagents, Etc.)
- 7.2. Market Analysis, Insights and Forecast - by Physical State of Mobile Phase
- 7.2.1. Gas Chromatography Reagents
- 7.2.2. Liquid Chromatography Reagents
- 7.2.3. Super Critical Fluid Chromatography (SFC) Reagents
- 7.3. Market Analysis, Insights and Forecast - by Technology
- 7.3.1. Ion Exchange
- 7.3.2. Affinity Exchange
- 7.3.3. Size Exclusion
- 7.3.4. Hydrophobic Interaction
- 7.3.5. Mixed Mode
- 7.3.6. Other Te
- 7.4. Market Analysis, Insights and Forecast - by Application
- 7.4.1. Pharmaceutical
- 7.4.2. Food and Beverages
- 7.4.3. Water and Environmental Analysis
- 7.4.4. Other Ap
- 7.1. Market Analysis, Insights and Forecast - by Type
- 8. Europe Chromatography Reagents Market Analysis, Insights and Forecast, 2019-2031
- 8.1. Market Analysis, Insights and Forecast - by Type
- 8.1.1. Buffers
- 8.1.2. Ion Pair Reagents
- 8.1.3. Solvents
- 8.1.4. Other Types (Derivatization Reagents, Etc.)
- 8.2. Market Analysis, Insights and Forecast - by Physical State of Mobile Phase
- 8.2.1. Gas Chromatography Reagents
- 8.2.2. Liquid Chromatography Reagents
- 8.2.3. Super Critical Fluid Chromatography (SFC) Reagents
- 8.3. Market Analysis, Insights and Forecast - by Technology
- 8.3.1. Ion Exchange
- 8.3.2. Affinity Exchange
- 8.3.3. Size Exclusion
- 8.3.4. Hydrophobic Interaction
- 8.3.5. Mixed Mode
- 8.3.6. Other Te
- 8.4. Market Analysis, Insights and Forecast - by Application
- 8.4.1. Pharmaceutical
- 8.4.2. Food and Beverages
- 8.4.3. Water and Environmental Analysis
- 8.4.4. Other Ap
- 8.1. Market Analysis, Insights and Forecast - by Type
- 9. South America Chromatography Reagents Market Analysis, Insights and Forecast, 2019-2031
- 9.1. Market Analysis, Insights and Forecast - by Type
- 9.1.1. Buffers
- 9.1.2. Ion Pair Reagents
- 9.1.3. Solvents
- 9.1.4. Other Types (Derivatization Reagents, Etc.)
- 9.2. Market Analysis, Insights and Forecast - by Physical State of Mobile Phase
- 9.2.1. Gas Chromatography Reagents
- 9.2.2. Liquid Chromatography Reagents
- 9.2.3. Super Critical Fluid Chromatography (SFC) Reagents
- 9.3. Market Analysis, Insights and Forecast - by Technology
- 9.3.1. Ion Exchange
- 9.3.2. Affinity Exchange
- 9.3.3. Size Exclusion
- 9.3.4. Hydrophobic Interaction
- 9.3.5. Mixed Mode
- 9.3.6. Other Te
- 9.4. Market Analysis, Insights and Forecast - by Application
- 9.4.1. Pharmaceutical
- 9.4.2. Food and Beverages
- 9.4.3. Water and Environmental Analysis
- 9.4.4. Other Ap
- 9.1. Market Analysis, Insights and Forecast - by Type
- 10. Middle East and Africa Chromatography Reagents Market Analysis, Insights and Forecast, 2019-2031
- 10.1. Market Analysis, Insights and Forecast - by Type
- 10.1.1. Buffers
- 10.1.2. Ion Pair Reagents
- 10.1.3. Solvents
- 10.1.4. Other Types (Derivatization Reagents, Etc.)
- 10.2. Market Analysis, Insights and Forecast - by Physical State of Mobile Phase
- 10.2.1. Gas Chromatography Reagents
- 10.2.2. Liquid Chromatography Reagents
- 10.2.3. Super Critical Fluid Chromatography (SFC) Reagents
- 10.3. Market Analysis, Insights and Forecast - by Technology
- 10.3.1. Ion Exchange
- 10.3.2. Affinity Exchange
- 10.3.3. Size Exclusion
- 10.3.4. Hydrophobic Interaction
- 10.3.5. Mixed Mode
- 10.3.6. Other Te
- 10.4. Market Analysis, Insights and Forecast - by Application
- 10.4.1. Pharmaceutical
- 10.4.2. Food and Beverages
- 10.4.3. Water and Environmental Analysis
- 10.4.4. Other Ap
- 10.1. Market Analysis, Insights and Forecast - by Type
- 11. Asia Pacific Chromatography Reagents Market Analysis, Insights and Forecast, 2019-2031
- 11.1. Market Analysis, Insights and Forecast - By Country/Sub-region
- 11.1.1 China
- 11.1.2 India
- 11.1.3 Japan
- 11.1.4 South Korea
- 11.1.5 Rest of Asia Pacific
- 12. North America Chromatography Reagents Market Analysis, Insights and Forecast, 2019-2031
- 12.1. Market Analysis, Insights and Forecast - By Country/Sub-region
- 12.1.1 United States
- 12.1.2 Canada
- 12.1.3 Mexico
- 13. Europe Chromatography Reagents Market Analysis, Insights and Forecast, 2019-2031
- 13.1. Market Analysis, Insights and Forecast - By Country/Sub-region
- 13.1.1 Germany
- 13.1.2 United Kingdom
- 13.1.3 Italy
- 13.1.4 France
- 13.1.5 Rest of Europe
- 14. South America Chromatography Reagents Market Analysis, Insights and Forecast, 2019-2031
- 14.1. Market Analysis, Insights and Forecast - By Country/Sub-region
- 14.1.1 Brazil
- 14.1.2 Argentina
- 14.1.3 Rest of South America
- 15. Middle East and Africa Chromatography Reagents Market Analysis, Insights and Forecast, 2019-2031
- 15.1. Market Analysis, Insights and Forecast - By Country/Sub-region
- 15.1.1 Saudi Arabia
- 15.1.2 South Africa
- 15.1.3 Rest of Middle East and Africa
- 16. Competitive Analysis
- 16.1. Global Market Share Analysis 2024
- 16.2. Company Profiles
- 16.2.1 Santa Cruz Biotechnology Inc
- 16.2.1.1. Overview
- 16.2.1.2. Products
- 16.2.1.3. SWOT Analysis
- 16.2.1.4. Recent Developments
- 16.2.1.5. Financials (Based on Availability)
- 16.2.2 Regis Technologies Inc
- 16.2.2.1. Overview
- 16.2.2.2. Products
- 16.2.2.3. SWOT Analysis
- 16.2.2.4. Recent Developments
- 16.2.2.5. Financials (Based on Availability)
- 16.2.3 Waters Corporation*List Not Exhaustive
- 16.2.3.1. Overview
- 16.2.3.2. Products
- 16.2.3.3. SWOT Analysis
- 16.2.3.4. Recent Developments
- 16.2.3.5. Financials (Based on Availability)
- 16.2.4 Merck KGaA
- 16.2.4.1. Overview
- 16.2.4.2. Products
- 16.2.4.3. SWOT Analysis
- 16.2.4.4. Recent Developments
- 16.2.4.5. Financials (Based on Availability)
- 16.2.5 Tosoh India Pvt Ltd
- 16.2.5.1. Overview
- 16.2.5.2. Products
- 16.2.5.3. SWOT Analysis
- 16.2.5.4. Recent Developments
- 16.2.5.5. Financials (Based on Availability)
- 16.2.6 ITW Reagents
- 16.2.6.1. Overview
- 16.2.6.2. Products
- 16.2.6.3. SWOT Analysis
- 16.2.6.4. Recent Developments
- 16.2.6.5. Financials (Based on Availability)
- 16.2.7 Thermo Fisher Scientific Inc
- 16.2.7.1. Overview
- 16.2.7.2. Products
- 16.2.7.3. SWOT Analysis
- 16.2.7.4. Recent Developments
- 16.2.7.5. Financials (Based on Availability)
- 16.2.8 Agilent Technologies Inc
- 16.2.8.1. Overview
- 16.2.8.2. Products
- 16.2.8.3. SWOT Analysis
- 16.2.8.4. Recent Developments
- 16.2.8.5. Financials (Based on Availability)
- 16.2.9 Avantor Inc
- 16.2.9.1. Overview
- 16.2.9.2. Products
- 16.2.9.3. SWOT Analysis
- 16.2.9.4. Recent Developments
- 16.2.9.5. Financials (Based on Availability)
- 16.2.10 Tokyo Chemical Industry
- 16.2.10.1. Overview
- 16.2.10.2. Products
- 16.2.10.3. SWOT Analysis
- 16.2.10.4. Recent Developments
- 16.2.10.5. Financials (Based on Availability)
- 16.2.11 Shimadzu Corporation
- 16.2.11.1. Overview
- 16.2.11.2. Products
- 16.2.11.3. SWOT Analysis
- 16.2.11.4. Recent Developments
- 16.2.11.5. Financials (Based on Availability)
- 16.2.1 Santa Cruz Biotechnology Inc
List of Figures
- Figure 1: Global Chromatography Reagents Market Revenue Breakdown (Million, %) by Region 2024 & 2032
- Figure 2: Global Chromatography Reagents Market Volume Breakdown (K Tons, %) by Region 2024 & 2032
- Figure 3: Asia Pacific Chromatography Reagents Market Revenue (Million), by Country 2024 & 2032
- Figure 4: Asia Pacific Chromatography Reagents Market Volume (K Tons), by Country 2024 & 2032
- Figure 5: Asia Pacific Chromatography Reagents Market Revenue Share (%), by Country 2024 & 2032
- Figure 6: Asia Pacific Chromatography Reagents Market Volume Share (%), by Country 2024 & 2032
- Figure 7: North America Chromatography Reagents Market Revenue (Million), by Country 2024 & 2032
- Figure 8: North America Chromatography Reagents Market Volume (K Tons), by Country 2024 & 2032
- Figure 9: North America Chromatography Reagents Market Revenue Share (%), by Country 2024 & 2032
- Figure 10: North America Chromatography Reagents Market Volume Share (%), by Country 2024 & 2032
- Figure 11: Europe Chromatography Reagents Market Revenue (Million), by Country 2024 & 2032
- Figure 12: Europe Chromatography Reagents Market Volume (K Tons), by Country 2024 & 2032
- Figure 13: Europe Chromatography Reagents Market Revenue Share (%), by Country 2024 & 2032
- Figure 14: Europe Chromatography Reagents Market Volume Share (%), by Country 2024 & 2032
- Figure 15: South America Chromatography Reagents Market Revenue (Million), by Country 2024 & 2032
- Figure 16: South America Chromatography Reagents Market Volume (K Tons), by Country 2024 & 2032
- Figure 17: South America Chromatography Reagents Market Revenue Share (%), by Country 2024 & 2032
- Figure 18: South America Chromatography Reagents Market Volume Share (%), by Country 2024 & 2032
- Figure 19: Middle East and Africa Chromatography Reagents Market Revenue (Million), by Country 2024 & 2032
- Figure 20: Middle East and Africa Chromatography Reagents Market Volume (K Tons), by Country 2024 & 2032
- Figure 21: Middle East and Africa Chromatography Reagents Market Revenue Share (%), by Country 2024 & 2032
- Figure 22: Middle East and Africa Chromatography Reagents Market Volume Share (%), by Country 2024 & 2032
- Figure 23: Asia Pacific Chromatography Reagents Market Revenue (Million), by Type 2024 & 2032
- Figure 24: Asia Pacific Chromatography Reagents Market Volume (K Tons), by Type 2024 & 2032
- Figure 25: Asia Pacific Chromatography Reagents Market Revenue Share (%), by Type 2024 & 2032
- Figure 26: Asia Pacific Chromatography Reagents Market Volume Share (%), by Type 2024 & 2032
- Figure 27: Asia Pacific Chromatography Reagents Market Revenue (Million), by Physical State of Mobile Phase 2024 & 2032
- Figure 28: Asia Pacific Chromatography Reagents Market Volume (K Tons), by Physical State of Mobile Phase 2024 & 2032
- Figure 29: Asia Pacific Chromatography Reagents Market Revenue Share (%), by Physical State of Mobile Phase 2024 & 2032
- Figure 30: Asia Pacific Chromatography Reagents Market Volume Share (%), by Physical State of Mobile Phase 2024 & 2032
- Figure 31: Asia Pacific Chromatography Reagents Market Revenue (Million), by Technology 2024 & 2032
- Figure 32: Asia Pacific Chromatography Reagents Market Volume (K Tons), by Technology 2024 & 2032
- Figure 33: Asia Pacific Chromatography Reagents Market Revenue Share (%), by Technology 2024 & 2032
- Figure 34: Asia Pacific Chromatography Reagents Market Volume Share (%), by Technology 2024 & 2032
- Figure 35: Asia Pacific Chromatography Reagents Market Revenue (Million), by Application 2024 & 2032
- Figure 36: Asia Pacific Chromatography Reagents Market Volume (K Tons), by Application 2024 & 2032
- Figure 37: Asia Pacific Chromatography Reagents Market Revenue Share (%), by Application 2024 & 2032
- Figure 38: Asia Pacific Chromatography Reagents Market Volume Share (%), by Application 2024 & 2032
- Figure 39: Asia Pacific Chromatography Reagents Market Revenue (Million), by Country 2024 & 2032
- Figure 40: Asia Pacific Chromatography Reagents Market Volume (K Tons), by Country 2024 & 2032
- Figure 41: Asia Pacific Chromatography Reagents Market Revenue Share (%), by Country 2024 & 2032
- Figure 42: Asia Pacific Chromatography Reagents Market Volume Share (%), by Country 2024 & 2032
- Figure 43: North America Chromatography Reagents Market Revenue (Million), by Type 2024 & 2032
- Figure 44: North America Chromatography Reagents Market Volume (K Tons), by Type 2024 & 2032
- Figure 45: North America Chromatography Reagents Market Revenue Share (%), by Type 2024 & 2032
- Figure 46: North America Chromatography Reagents Market Volume Share (%), by Type 2024 & 2032
- Figure 47: North America Chromatography Reagents Market Revenue (Million), by Physical State of Mobile Phase 2024 & 2032
- Figure 48: North America Chromatography Reagents Market Volume (K Tons), by Physical State of Mobile Phase 2024 & 2032
- Figure 49: North America Chromatography Reagents Market Revenue Share (%), by Physical State of Mobile Phase 2024 & 2032
- Figure 50: North America Chromatography Reagents Market Volume Share (%), by Physical State of Mobile Phase 2024 & 2032
- Figure 51: North America Chromatography Reagents Market Revenue (Million), by Technology 2024 & 2032
- Figure 52: North America Chromatography Reagents Market Volume (K Tons), by Technology 2024 & 2032
- Figure 53: North America Chromatography Reagents Market Revenue Share (%), by Technology 2024 & 2032
- Figure 54: North America Chromatography Reagents Market Volume Share (%), by Technology 2024 & 2032
- Figure 55: North America Chromatography Reagents Market Revenue (Million), by Application 2024 & 2032
- Figure 56: North America Chromatography Reagents Market Volume (K Tons), by Application 2024 & 2032
- Figure 57: North America Chromatography Reagents Market Revenue Share (%), by Application 2024 & 2032
- Figure 58: North America Chromatography Reagents Market Volume Share (%), by Application 2024 & 2032
- Figure 59: North America Chromatography Reagents Market Revenue (Million), by Country 2024 & 2032
- Figure 60: North America Chromatography Reagents Market Volume (K Tons), by Country 2024 & 2032
- Figure 61: North America Chromatography Reagents Market Revenue Share (%), by Country 2024 & 2032
- Figure 62: North America Chromatography Reagents Market Volume Share (%), by Country 2024 & 2032
- Figure 63: Europe Chromatography Reagents Market Revenue (Million), by Type 2024 & 2032
- Figure 64: Europe Chromatography Reagents Market Volume (K Tons), by Type 2024 & 2032
- Figure 65: Europe Chromatography Reagents Market Revenue Share (%), by Type 2024 & 2032
- Figure 66: Europe Chromatography Reagents Market Volume Share (%), by Type 2024 & 2032
- Figure 67: Europe Chromatography Reagents Market Revenue (Million), by Physical State of Mobile Phase 2024 & 2032
- Figure 68: Europe Chromatography Reagents Market Volume (K Tons), by Physical State of Mobile Phase 2024 & 2032
- Figure 69: Europe Chromatography Reagents Market Revenue Share (%), by Physical State of Mobile Phase 2024 & 2032
- Figure 70: Europe Chromatography Reagents Market Volume Share (%), by Physical State of Mobile Phase 2024 & 2032
- Figure 71: Europe Chromatography Reagents Market Revenue (Million), by Technology 2024 & 2032
- Figure 72: Europe Chromatography Reagents Market Volume (K Tons), by Technology 2024 & 2032
- Figure 73: Europe Chromatography Reagents Market Revenue Share (%), by Technology 2024 & 2032
- Figure 74: Europe Chromatography Reagents Market Volume Share (%), by Technology 2024 & 2032
- Figure 75: Europe Chromatography Reagents Market Revenue (Million), by Application 2024 & 2032
- Figure 76: Europe Chromatography Reagents Market Volume (K Tons), by Application 2024 & 2032
- Figure 77: Europe Chromatography Reagents Market Revenue Share (%), by Application 2024 & 2032
- Figure 78: Europe Chromatography Reagents Market Volume Share (%), by Application 2024 & 2032
- Figure 79: Europe Chromatography Reagents Market Revenue (Million), by Country 2024 & 2032
- Figure 80: Europe Chromatography Reagents Market Volume (K Tons), by Country 2024 & 2032
- Figure 81: Europe Chromatography Reagents Market Revenue Share (%), by Country 2024 & 2032
- Figure 82: Europe Chromatography Reagents Market Volume Share (%), by Country 2024 & 2032
- Figure 83: South America Chromatography Reagents Market Revenue (Million), by Type 2024 & 2032
- Figure 84: South America Chromatography Reagents Market Volume (K Tons), by Type 2024 & 2032
- Figure 85: South America Chromatography Reagents Market Revenue Share (%), by Type 2024 & 2032
- Figure 86: South America Chromatography Reagents Market Volume Share (%), by Type 2024 & 2032
- Figure 87: South America Chromatography Reagents Market Revenue (Million), by Physical State of Mobile Phase 2024 & 2032
- Figure 88: South America Chromatography Reagents Market Volume (K Tons), by Physical State of Mobile Phase 2024 & 2032
- Figure 89: South America Chromatography Reagents Market Revenue Share (%), by Physical State of Mobile Phase 2024 & 2032
- Figure 90: South America Chromatography Reagents Market Volume Share (%), by Physical State of Mobile Phase 2024 & 2032
- Figure 91: South America Chromatography Reagents Market Revenue (Million), by Technology 2024 & 2032
- Figure 92: South America Chromatography Reagents Market Volume (K Tons), by Technology 2024 & 2032
- Figure 93: South America Chromatography Reagents Market Revenue Share (%), by Technology 2024 & 2032
- Figure 94: South America Chromatography Reagents Market Volume Share (%), by Technology 2024 & 2032
- Figure 95: South America Chromatography Reagents Market Revenue (Million), by Application 2024 & 2032
- Figure 96: South America Chromatography Reagents Market Volume (K Tons), by Application 2024 & 2032
- Figure 97: South America Chromatography Reagents Market Revenue Share (%), by Application 2024 & 2032
- Figure 98: South America Chromatography Reagents Market Volume Share (%), by Application 2024 & 2032
- Figure 99: South America Chromatography Reagents Market Revenue (Million), by Country 2024 & 2032
- Figure 100: South America Chromatography Reagents Market Volume (K Tons), by Country 2024 & 2032
- Figure 101: South America Chromatography Reagents Market Revenue Share (%), by Country 2024 & 2032
- Figure 102: South America Chromatography Reagents Market Volume Share (%), by Country 2024 & 2032
- Figure 103: Middle East and Africa Chromatography Reagents Market Revenue (Million), by Type 2024 & 2032
- Figure 104: Middle East and Africa Chromatography Reagents Market Volume (K Tons), by Type 2024 & 2032
- Figure 105: Middle East and Africa Chromatography Reagents Market Revenue Share (%), by Type 2024 & 2032
- Figure 106: Middle East and Africa Chromatography Reagents Market Volume Share (%), by Type 2024 & 2032
- Figure 107: Middle East and Africa Chromatography Reagents Market Revenue (Million), by Physical State of Mobile Phase 2024 & 2032
- Figure 108: Middle East and Africa Chromatography Reagents Market Volume (K Tons), by Physical State of Mobile Phase 2024 & 2032
- Figure 109: Middle East and Africa Chromatography Reagents Market Revenue Share (%), by Physical State of Mobile Phase 2024 & 2032
- Figure 110: Middle East and Africa Chromatography Reagents Market Volume Share (%), by Physical State of Mobile Phase 2024 & 2032
- Figure 111: Middle East and Africa Chromatography Reagents Market Revenue (Million), by Technology 2024 & 2032
- Figure 112: Middle East and Africa Chromatography Reagents Market Volume (K Tons), by Technology 2024 & 2032
- Figure 113: Middle East and Africa Chromatography Reagents Market Revenue Share (%), by Technology 2024 & 2032
- Figure 114: Middle East and Africa Chromatography Reagents Market Volume Share (%), by Technology 2024 & 2032
- Figure 115: Middle East and Africa Chromatography Reagents Market Revenue (Million), by Application 2024 & 2032
- Figure 116: Middle East and Africa Chromatography Reagents Market Volume (K Tons), by Application 2024 & 2032
- Figure 117: Middle East and Africa Chromatography Reagents Market Revenue Share (%), by Application 2024 & 2032
- Figure 118: Middle East and Africa Chromatography Reagents Market Volume Share (%), by Application 2024 & 2032
- Figure 119: Middle East and Africa Chromatography Reagents Market Revenue (Million), by Country 2024 & 2032
- Figure 120: Middle East and Africa Chromatography Reagents Market Volume (K Tons), by Country 2024 & 2032
- Figure 121: Middle East and Africa Chromatography Reagents Market Revenue Share (%), by Country 2024 & 2032
- Figure 122: Middle East and Africa Chromatography Reagents Market Volume Share (%), by Country 2024 & 2032
List of Tables
- Table 1: Global Chromatography Reagents Market Revenue Million Forecast, by Region 2019 & 2032
- Table 2: Global Chromatography Reagents Market Volume K Tons Forecast, by Region 2019 & 2032
- Table 3: Global Chromatography Reagents Market Revenue Million Forecast, by Type 2019 & 2032
- Table 4: Global Chromatography Reagents Market Volume K Tons Forecast, by Type 2019 & 2032
- Table 5: Global Chromatography Reagents Market Revenue Million Forecast, by Physical State of Mobile Phase 2019 & 2032
- Table 6: Global Chromatography Reagents Market Volume K Tons Forecast, by Physical State of Mobile Phase 2019 & 2032
- Table 7: Global Chromatography Reagents Market Revenue Million Forecast, by Technology 2019 & 2032
- Table 8: Global Chromatography Reagents Market Volume K Tons Forecast, by Technology 2019 & 2032
- Table 9: Global Chromatography Reagents Market Revenue Million Forecast, by Application 2019 & 2032
- Table 10: Global Chromatography Reagents Market Volume K Tons Forecast, by Application 2019 & 2032
- Table 11: Global Chromatography Reagents Market Revenue Million Forecast, by Region 2019 & 2032
- Table 12: Global Chromatography Reagents Market Volume K Tons Forecast, by Region 2019 & 2032
- Table 13: Global Chromatography Reagents Market Revenue Million Forecast, by Country 2019 & 2032
- Table 14: Global Chromatography Reagents Market Volume K Tons Forecast, by Country 2019 & 2032
- Table 15: China Chromatography Reagents Market Revenue (Million) Forecast, by Application 2019 & 2032
- Table 16: China Chromatography Reagents Market Volume (K Tons) Forecast, by Application 2019 & 2032
- Table 17: India Chromatography Reagents Market Revenue (Million) Forecast, by Application 2019 & 2032
- Table 18: India Chromatography Reagents Market Volume (K Tons) Forecast, by Application 2019 & 2032
- Table 19: Japan Chromatography Reagents Market Revenue (Million) Forecast, by Application 2019 & 2032
- Table 20: Japan Chromatography Reagents Market Volume (K Tons) Forecast, by Application 2019 & 2032
- Table 21: South Korea Chromatography Reagents Market Revenue (Million) Forecast, by Application 2019 & 2032
- Table 22: South Korea Chromatography Reagents Market Volume (K Tons) Forecast, by Application 2019 & 2032
- Table 23: Rest of Asia Pacific Chromatography Reagents Market Revenue (Million) Forecast, by Application 2019 & 2032
- Table 24: Rest of Asia Pacific Chromatography Reagents Market Volume (K Tons) Forecast, by Application 2019 & 2032
- Table 25: Global Chromatography Reagents Market Revenue Million Forecast, by Country 2019 & 2032
- Table 26: Global Chromatography Reagents Market Volume K Tons Forecast, by Country 2019 & 2032
- Table 27: United States Chromatography Reagents Market Revenue (Million) Forecast, by Application 2019 & 2032
- Table 28: United States Chromatography Reagents Market Volume (K Tons) Forecast, by Application 2019 & 2032
- Table 29: Canada Chromatography Reagents Market Revenue (Million) Forecast, by Application 2019 & 2032
- Table 30: Canada Chromatography Reagents Market Volume (K Tons) Forecast, by Application 2019 & 2032
- Table 31: Mexico Chromatography Reagents Market Revenue (Million) Forecast, by Application 2019 & 2032
- Table 32: Mexico Chromatography Reagents Market Volume (K Tons) Forecast, by Application 2019 & 2032
- Table 33: Global Chromatography Reagents Market Revenue Million Forecast, by Country 2019 & 2032
- Table 34: Global Chromatography Reagents Market Volume K Tons Forecast, by Country 2019 & 2032
- Table 35: Germany Chromatography Reagents Market Revenue (Million) Forecast, by Application 2019 & 2032
- Table 36: Germany Chromatography Reagents Market Volume (K Tons) Forecast, by Application 2019 & 2032
- Table 37: United Kingdom Chromatography Reagents Market Revenue (Million) Forecast, by Application 2019 & 2032
- Table 38: United Kingdom Chromatography Reagents Market Volume (K Tons) Forecast, by Application 2019 & 2032
- Table 39: Italy Chromatography Reagents Market Revenue (Million) Forecast, by Application 2019 & 2032
- Table 40: Italy Chromatography Reagents Market Volume (K Tons) Forecast, by Application 2019 & 2032
- Table 41: France Chromatography Reagents Market Revenue (Million) Forecast, by Application 2019 & 2032
- Table 42: France Chromatography Reagents Market Volume (K Tons) Forecast, by Application 2019 & 2032
- Table 43: Rest of Europe Chromatography Reagents Market Revenue (Million) Forecast, by Application 2019 & 2032
- Table 44: Rest of Europe Chromatography Reagents Market Volume (K Tons) Forecast, by Application 2019 & 2032
- Table 45: Global Chromatography Reagents Market Revenue Million Forecast, by Country 2019 & 2032
- Table 46: Global Chromatography Reagents Market Volume K Tons Forecast, by Country 2019 & 2032
- Table 47: Brazil Chromatography Reagents Market Revenue (Million) Forecast, by Application 2019 & 2032
- Table 48: Brazil Chromatography Reagents Market Volume (K Tons) Forecast, by Application 2019 & 2032
- Table 49: Argentina Chromatography Reagents Market Revenue (Million) Forecast, by Application 2019 & 2032
- Table 50: Argentina Chromatography Reagents Market Volume (K Tons) Forecast, by Application 2019 & 2032
- Table 51: Rest of South America Chromatography Reagents Market Revenue (Million) Forecast, by Application 2019 & 2032
- Table 52: Rest of South America Chromatography Reagents Market Volume (K Tons) Forecast, by Application 2019 & 2032
- Table 53: Global Chromatography Reagents Market Revenue Million Forecast, by Country 2019 & 2032
- Table 54: Global Chromatography Reagents Market Volume K Tons Forecast, by Country 2019 & 2032
- Table 55: Saudi Arabia Chromatography Reagents Market Revenue (Million) Forecast, by Application 2019 & 2032
- Table 56: Saudi Arabia Chromatography Reagents Market Volume (K Tons) Forecast, by Application 2019 & 2032
- Table 57: South Africa Chromatography Reagents Market Revenue (Million) Forecast, by Application 2019 & 2032
- Table 58: South Africa Chromatography Reagents Market Volume (K Tons) Forecast, by Application 2019 & 2032
- Table 59: Rest of Middle East and Africa Chromatography Reagents Market Revenue (Million) Forecast, by Application 2019 & 2032
- Table 60: Rest of Middle East and Africa Chromatography Reagents Market Volume (K Tons) Forecast, by Application 2019 & 2032
- Table 61: Global Chromatography Reagents Market Revenue Million Forecast, by Type 2019 & 2032
- Table 62: Global Chromatography Reagents Market Volume K Tons Forecast, by Type 2019 & 2032
- Table 63: Global Chromatography Reagents Market Revenue Million Forecast, by Physical State of Mobile Phase 2019 & 2032
- Table 64: Global Chromatography Reagents Market Volume K Tons Forecast, by Physical State of Mobile Phase 2019 & 2032
- Table 65: Global Chromatography Reagents Market Revenue Million Forecast, by Technology 2019 & 2032
- Table 66: Global Chromatography Reagents Market Volume K Tons Forecast, by Technology 2019 & 2032
- Table 67: Global Chromatography Reagents Market Revenue Million Forecast, by Application 2019 & 2032
- Table 68: Global Chromatography Reagents Market Volume K Tons Forecast, by Application 2019 & 2032
- Table 69: Global Chromatography Reagents Market Revenue Million Forecast, by Country 2019 & 2032
- Table 70: Global Chromatography Reagents Market Volume K Tons Forecast, by Country 2019 & 2032
- Table 71: China Chromatography Reagents Market Revenue (Million) Forecast, by Application 2019 & 2032
- Table 72: China Chromatography Reagents Market Volume (K Tons) Forecast, by Application 2019 & 2032
- Table 73: India Chromatography Reagents Market Revenue (Million) Forecast, by Application 2019 & 2032
- Table 74: India Chromatography Reagents Market Volume (K Tons) Forecast, by Application 2019 & 2032
- Table 75: Japan Chromatography Reagents Market Revenue (Million) Forecast, by Application 2019 & 2032
- Table 76: Japan Chromatography Reagents Market Volume (K Tons) Forecast, by Application 2019 & 2032
- Table 77: South Korea Chromatography Reagents Market Revenue (Million) Forecast, by Application 2019 & 2032
- Table 78: South Korea Chromatography Reagents Market Volume (K Tons) Forecast, by Application 2019 & 2032
- Table 79: Rest of Asia Pacific Chromatography Reagents Market Revenue (Million) Forecast, by Application 2019 & 2032
- Table 80: Rest of Asia Pacific Chromatography Reagents Market Volume (K Tons) Forecast, by Application 2019 & 2032
- Table 81: Global Chromatography Reagents Market Revenue Million Forecast, by Type 2019 & 2032
- Table 82: Global Chromatography Reagents Market Volume K Tons Forecast, by Type 2019 & 2032
- Table 83: Global Chromatography Reagents Market Revenue Million Forecast, by Physical State of Mobile Phase 2019 & 2032
- Table 84: Global Chromatography Reagents Market Volume K Tons Forecast, by Physical State of Mobile Phase 2019 & 2032
- Table 85: Global Chromatography Reagents Market Revenue Million Forecast, by Technology 2019 & 2032
- Table 86: Global Chromatography Reagents Market Volume K Tons Forecast, by Technology 2019 & 2032
- Table 87: Global Chromatography Reagents Market Revenue Million Forecast, by Application 2019 & 2032
- Table 88: Global Chromatography Reagents Market Volume K Tons Forecast, by Application 2019 & 2032
- Table 89: Global Chromatography Reagents Market Revenue Million Forecast, by Country 2019 & 2032
- Table 90: Global Chromatography Reagents Market Volume K Tons Forecast, by Country 2019 & 2032
- Table 91: United States Chromatography Reagents Market Revenue (Million) Forecast, by Application 2019 & 2032
- Table 92: United States Chromatography Reagents Market Volume (K Tons) Forecast, by Application 2019 & 2032
- Table 93: Canada Chromatography Reagents Market Revenue (Million) Forecast, by Application 2019 & 2032
- Table 94: Canada Chromatography Reagents Market Volume (K Tons) Forecast, by Application 2019 & 2032
- Table 95: Mexico Chromatography Reagents Market Revenue (Million) Forecast, by Application 2019 & 2032
- Table 96: Mexico Chromatography Reagents Market Volume (K Tons) Forecast, by Application 2019 & 2032
- Table 97: Global Chromatography Reagents Market Revenue Million Forecast, by Type 2019 & 2032
- Table 98: Global Chromatography Reagents Market Volume K Tons Forecast, by Type 2019 & 2032
- Table 99: Global Chromatography Reagents Market Revenue Million Forecast, by Physical State of Mobile Phase 2019 & 2032
- Table 100: Global Chromatography Reagents Market Volume K Tons Forecast, by Physical State of Mobile Phase 2019 & 2032
- Table 101: Global Chromatography Reagents Market Revenue Million Forecast, by Technology 2019 & 2032
- Table 102: Global Chromatography Reagents Market Volume K Tons Forecast, by Technology 2019 & 2032
- Table 103: Global Chromatography Reagents Market Revenue Million Forecast, by Application 2019 & 2032
- Table 104: Global Chromatography Reagents Market Volume K Tons Forecast, by Application 2019 & 2032
- Table 105: Global Chromatography Reagents Market Revenue Million Forecast, by Country 2019 & 2032
- Table 106: Global Chromatography Reagents Market Volume K Tons Forecast, by Country 2019 & 2032
- Table 107: Germany Chromatography Reagents Market Revenue (Million) Forecast, by Application 2019 & 2032
- Table 108: Germany Chromatography Reagents Market Volume (K Tons) Forecast, by Application 2019 & 2032
- Table 109: United Kingdom Chromatography Reagents Market Revenue (Million) Forecast, by Application 2019 & 2032
- Table 110: United Kingdom Chromatography Reagents Market Volume (K Tons) Forecast, by Application 2019 & 2032
- Table 111: Italy Chromatography Reagents Market Revenue (Million) Forecast, by Application 2019 & 2032
- Table 112: Italy Chromatography Reagents Market Volume (K Tons) Forecast, by Application 2019 & 2032
- Table 113: France Chromatography Reagents Market Revenue (Million) Forecast, by Application 2019 & 2032
- Table 114: France Chromatography Reagents Market Volume (K Tons) Forecast, by Application 2019 & 2032
- Table 115: Rest of Europe Chromatography Reagents Market Revenue (Million) Forecast, by Application 2019 & 2032
- Table 116: Rest of Europe Chromatography Reagents Market Volume (K Tons) Forecast, by Application 2019 & 2032
- Table 117: Global Chromatography Reagents Market Revenue Million Forecast, by Type 2019 & 2032
- Table 118: Global Chromatography Reagents Market Volume K Tons Forecast, by Type 2019 & 2032
- Table 119: Global Chromatography Reagents Market Revenue Million Forecast, by Physical State of Mobile Phase 2019 & 2032
- Table 120: Global Chromatography Reagents Market Volume K Tons Forecast, by Physical State of Mobile Phase 2019 & 2032
- Table 121: Global Chromatography Reagents Market Revenue Million Forecast, by Technology 2019 & 2032
- Table 122: Global Chromatography Reagents Market Volume K Tons Forecast, by Technology 2019 & 2032
- Table 123: Global Chromatography Reagents Market Revenue Million Forecast, by Application 2019 & 2032
- Table 124: Global Chromatography Reagents Market Volume K Tons Forecast, by Application 2019 & 2032
- Table 125: Global Chromatography Reagents Market Revenue Million Forecast, by Country 2019 & 2032
- Table 126: Global Chromatography Reagents Market Volume K Tons Forecast, by Country 2019 & 2032
- Table 127: Brazil Chromatography Reagents Market Revenue (Million) Forecast, by Application 2019 & 2032
- Table 128: Brazil Chromatography Reagents Market Volume (K Tons) Forecast, by Application 2019 & 2032
- Table 129: Argentina Chromatography Reagents Market Revenue (Million) Forecast, by Application 2019 & 2032
- Table 130: Argentina Chromatography Reagents Market Volume (K Tons) Forecast, by Application 2019 & 2032
- Table 131: Rest of South America Chromatography Reagents Market Revenue (Million) Forecast, by Application 2019 & 2032
- Table 132: Rest of South America Chromatography Reagents Market Volume (K Tons) Forecast, by Application 2019 & 2032
- Table 133: Global Chromatography Reagents Market Revenue Million Forecast, by Type 2019 & 2032
- Table 134: Global Chromatography Reagents Market Volume K Tons Forecast, by Type 2019 & 2032
- Table 135: Global Chromatography Reagents Market Revenue Million Forecast, by Physical State of Mobile Phase 2019 & 2032
- Table 136: Global Chromatography Reagents Market Volume K Tons Forecast, by Physical State of Mobile Phase 2019 & 2032
- Table 137: Global Chromatography Reagents Market Revenue Million Forecast, by Technology 2019 & 2032
- Table 138: Global Chromatography Reagents Market Volume K Tons Forecast, by Technology 2019 & 2032
- Table 139: Global Chromatography Reagents Market Revenue Million Forecast, by Application 2019 & 2032
- Table 140: Global Chromatography Reagents Market Volume K Tons Forecast, by Application 2019 & 2032
- Table 141: Global Chromatography Reagents Market Revenue Million Forecast, by Country 2019 & 2032
- Table 142: Global Chromatography Reagents Market Volume K Tons Forecast, by Country 2019 & 2032
- Table 143: Saudi Arabia Chromatography Reagents Market Revenue (Million) Forecast, by Application 2019 & 2032
- Table 144: Saudi Arabia Chromatography Reagents Market Volume (K Tons) Forecast, by Application 2019 & 2032
- Table 145: South Africa Chromatography Reagents Market Revenue (Million) Forecast, by Application 2019 & 2032
- Table 146: South Africa Chromatography Reagents Market Volume (K Tons) Forecast, by Application 2019 & 2032
- Table 147: Rest of Middle East and Africa Chromatography Reagents Market Revenue (Million) Forecast, by Application 2019 & 2032
- Table 148: Rest of Middle East and Africa Chromatography Reagents Market Volume (K Tons) Forecast, by Application 2019 & 2032
Frequently Asked Questions
1. What is the projected Compound Annual Growth Rate (CAGR) of the Chromatography Reagents Market?
The projected CAGR is approximately > 7.00%.
2. Which companies are prominent players in the Chromatography Reagents Market?
Key companies in the market include Santa Cruz Biotechnology Inc, Regis Technologies Inc, Waters Corporation*List Not Exhaustive, Merck KGaA, Tosoh India Pvt Ltd, ITW Reagents, Thermo Fisher Scientific Inc, Agilent Technologies Inc, Avantor Inc, Tokyo Chemical Industry, Shimadzu Corporation.
3. What are the main segments of the Chromatography Reagents Market?
The market segments include Type, Physical State of Mobile Phase, Technology, Application.
4. Can you provide details about the market size?
The market size is estimated to be USD 11.53 Million as of 2022.
5. What are some drivers contributing to market growth?
Increasing Demand for Chromatography Reagents from the Pharmaceutical Sector; Increasing R&D Investment in Biotechnology Sector; Other Drivers.
6. What are the notable trends driving market growth?
Increasing Demand from Pharmaceutical Sector.
7. Are there any restraints impacting market growth?
High Cost of Chromatography Reagents; Other Restraints.
8. Can you provide examples of recent developments in the market?
March 2023: Avantor was accorded the Best Bioprocessing Company for Chromatography at the Asia-Pacific Bioprocessing Excellence Awards 2023 (ABEA)for providing innovative chromatography solutions that enable biopharmaceutical manufacturers to optimize processes and enhance product quality.
9. What pricing options are available for accessing the report?
Pricing options include single-user, multi-user, and enterprise licenses priced at USD 4750, USD 5250, and USD 8750 respectively.
10. Is the market size provided in terms of value or volume?
The market size is provided in terms of value, measured in Million and volume, measured in K Tons.
11. Are there any specific market keywords associated with the report?
Yes, the market keyword associated with the report is "Chromatography Reagents Market," which aids in identifying and referencing the specific market segment covered.
12. How do I determine which pricing option suits my needs best?
The pricing options vary based on user requirements and access needs. Individual users may opt for single-user licenses, while businesses requiring broader access may choose multi-user or enterprise licenses for cost-effective access to the report.
13. Are there any additional resources or data provided in the Chromatography Reagents Market report?
While the report offers comprehensive insights, it's advisable to review the specific contents or supplementary materials provided to ascertain if additional resources or data are available.
14. How can I stay updated on further developments or reports in the Chromatography Reagents Market?
To stay informed about further developments, trends, and reports in the Chromatography Reagents Market, consider subscribing to industry newsletters, following relevant companies and organizations, or regularly checking reputable industry news sources and publications.
Methodology
Step 1 - Identification of Relevant Samples Size from Population Database


Step 2 - Approaches for Defining Global Market Size (Value, Volume* & Price*)

Note*: In applicable scenarios
Step 3 - Data Sources
Primary Research
- Web Analytics
- Survey Reports
- Research Institute
- Latest Research Reports
- Opinion Leaders
Secondary Research
- Annual Reports
- White Paper
- Latest Press Release
- Industry Association
- Paid Database
- Investor Presentations

Step 4 - Data Triangulation
Involves using different sources of information in order to increase the validity of a study
These sources are likely to be stakeholders in a program - participants, other researchers, program staff, other community members, and so on.
Then we put all data in single framework & apply various statistical tools to find out the dynamic on the market.
During the analysis stage, feedback from the stakeholder groups would be compared to determine areas of agreement as well as areas of divergence


