
Key Insights
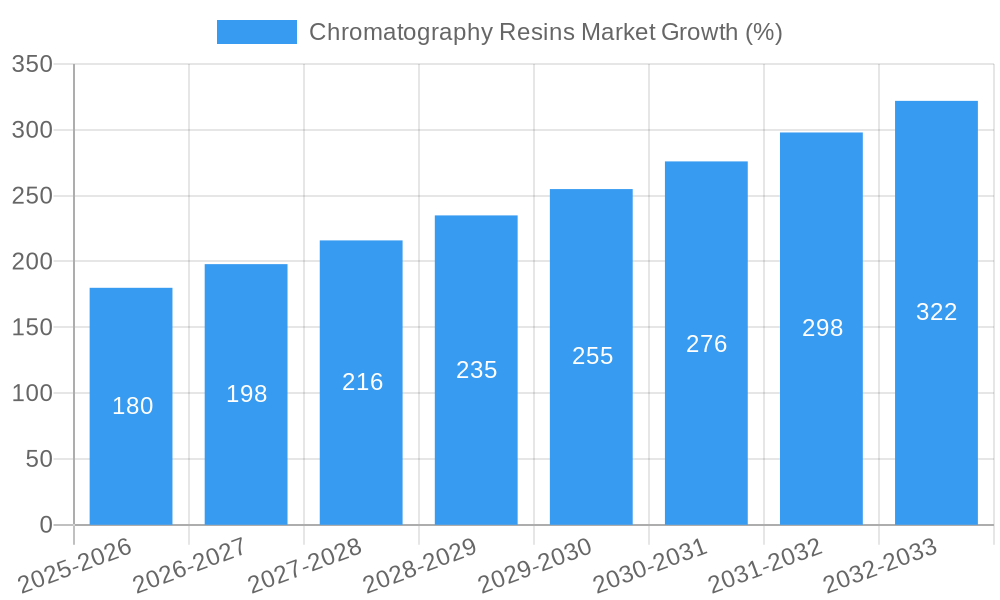
The Chromatography Resins market, valued at $2480 million in 2025, is projected to experience robust growth, exhibiting a Compound Annual Growth Rate (CAGR) exceeding 7.00% from 2025 to 2033. This expansion is driven by several key factors. The increasing demand for biopharmaceuticals and advanced therapeutics fuels the need for high-performance separation and purification technologies, making chromatography resins crucial. Furthermore, stringent regulatory requirements for drug purity and safety necessitate the adoption of advanced resin technologies, stimulating market growth. The growing emphasis on personalized medicine and the development of novel drug delivery systems further contribute to the market's upward trajectory. Technological advancements in resin materials and chromatography techniques, such as the development of high-efficiency, high-capacity resins with improved selectivity, also play a vital role. The market is segmented by end-user industry (pharmaceuticals, drug production, water & environmental agencies, food & beverage, and others), origin (natural-based and synthetic-based, specifically dextran), and technology (ion exchange, affinity, size exclusion, hydrophobic interaction, and others). The pharmaceutical sector currently dominates, but growth in other segments, particularly in the food and beverage industry for quality control and purification, is anticipated.
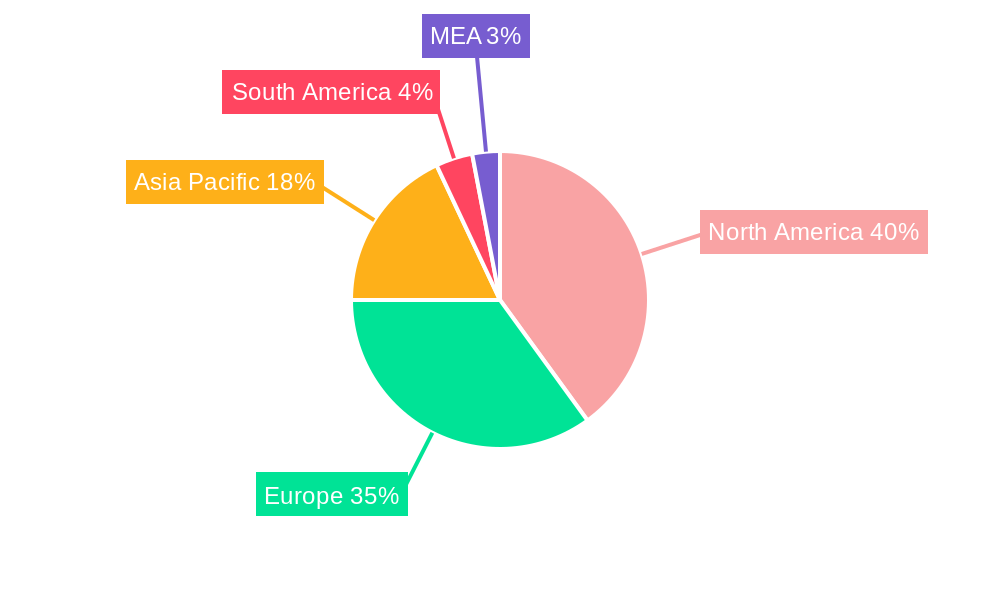
Geographic distribution shows a strong presence in North America and Europe, attributed to established pharmaceutical industries and robust research infrastructure. However, the Asia-Pacific region is expected to witness significant growth, driven by increasing healthcare expenditure and expanding biopharmaceutical manufacturing in countries like China and India. Competitive dynamics are shaped by established players like Repligen Corporation, General Electric, Bio-Rad Laboratories, Merck KGaA, and others, who are continuously innovating and expanding their product portfolios to cater to the evolving needs of the market. The market's future trajectory hinges on the continued advancements in resin technology, expanding applications across diverse industries, and the sustained growth of the biopharmaceutical sector globally. Ongoing research and development efforts in areas such as monolithic resins and continuous chromatography are poised to drive further market expansion in the coming years.
This in-depth report provides a comprehensive analysis of the Chromatography Resins market, offering valuable insights for stakeholders across the industry. The study period spans from 2019 to 2033, with 2025 serving as the base and estimated year. The report covers market size, segmentation, growth drivers, challenges, opportunities, competitive landscape, and key industry developments, enabling informed decision-making and strategic planning. The market is segmented by end-user industry (Pharmaceuticals, Drug Production, Water & Environmental Agencies, Food & Beverages, Other), origin (Natural-based, Synthetic-based (Dextran)), and technology (Ion Exchange, Affinity, Size Exclusion, Hydrophobic Interaction, Other). Key players analyzed include Repligen Corporation, General Electric, Bio-Rad Laboratories Inc, Merck KGaA, Mitsubishi Chemical Corporation, Dupont, Perkinelmer Inc, Pall Corporation, Tosoh Bioscience LLC, Purolite, Agilent Technologies, Avantor Inc, and Thermo Fisher Scientific.

Chromatography Resins Market Concentration & Innovation
The Chromatography Resins market exhibits a moderately concentrated landscape, with a few major players holding significant market share. While precise market share figures require detailed competitive analysis within the full report, it's observed that established companies like Merck KGaA, Thermo Fisher Scientific, and Repligen Corporation maintain a strong presence due to their extensive product portfolios, technological advancements, and global reach. Innovation is a key driver, with companies continuously developing new resins with enhanced selectivity, capacity, and efficiency to meet evolving purification needs in various industries. Regulatory frameworks, particularly in pharmaceuticals, significantly influence resin development and adoption. The market witnesses continuous development of new resin technologies to improve performance. Substitutes are limited, with the unique properties of chromatography resins making them essential in many applications. The recent trend of mergers and acquisitions (M&A) is reshaping the competitive landscape, as exemplified by Repligen Corporation's acquisition of Pall Corporation's Chromatography and Filtration business in 2021. This consolidation is likely to continue, driven by the desire to expand product portfolios and gain market share.
- Market Concentration: Moderately concentrated, with leading players holding a significant but not dominant portion of the market.
- Innovation Drivers: Enhanced selectivity, capacity, efficiency, and cost-effectiveness of resins.
- M&A Activity: High, driven by expansion strategies and increased market consolidation. The Repligen/Pall acquisition represents a significant deal, valued at xx Million. Other M&A activities in the market are estimated to reach xx Million in total value during the historical period.
- Regulatory Frameworks: Stringent regulations, especially in pharmaceuticals, drive the demand for high-quality, consistent resins.
Chromatography Resins Market Industry Trends & Insights
The Chromatography Resins market is experiencing robust growth, driven by increasing demand from the pharmaceutical and biotechnology sectors. The rising prevalence of chronic diseases and the growing biopharmaceutical industry are key factors propelling market expansion. Technological advancements, including the development of novel resin materials and improved purification techniques, are enhancing the efficiency and effectiveness of chromatography processes. The market witnessed a CAGR of xx% during the historical period (2019-2024) and is projected to grow at a CAGR of xx% during the forecast period (2025-2033). Increased demand for high-purity products across industries, particularly in pharmaceuticals and food & beverages, is driving market penetration. The competitive dynamics are characterized by intense rivalry among established players and emerging entrants, leading to continuous innovation and improvement in product offerings. Consumer preference leans towards high-performance, cost-effective resins that streamline purification processes and reduce operational costs.
Dominant Markets & Segments in Chromatography Resins Market
The pharmaceutical industry remains the dominant end-user segment, accounting for the largest market share due to the extensive use of chromatography resins in drug discovery, development, and manufacturing. The strong growth in biopharmaceuticals is a major driver. Within technology segments, Ion Exchange Chromatography Resins holds the largest share, owing to its broad applicability and established use in various applications. Geographically, North America and Europe currently hold the largest market share due to the high concentration of pharmaceutical and biotech companies. However, the Asia-Pacific region shows strong growth potential driven by increasing investments in pharmaceutical R&D and manufacturing facilities.
- Key Drivers for Pharmaceutical Dominance: High demand for high-purity pharmaceutical products, growing biopharmaceutical industry, stringent regulatory requirements.
- Key Drivers for Ion Exchange Chromatography Resins Dominance: Versatility, well-established technology, cost-effectiveness.
- Key Drivers for North American/European Dominance: High concentration of pharmaceutical and biotechnology companies, advanced infrastructure, robust R&D capabilities.
- Asia-Pacific Growth Potential: Rising investments in pharmaceutical infrastructure, increasing awareness of biopharmaceuticals, growing healthcare expenditure.
Chromatography Resins Market Product Developments
Recent product innovations focus on enhancing resin selectivity, capacity, and operational efficiency. This includes the development of novel resin materials with improved binding properties, improved flow characteristics for faster processing, and resins designed for specific applications like high-throughput purification. Companies are also developing customized resins to meet the unique needs of their clients. The market is increasingly favoring resins that minimize production costs and time while maximizing efficiency and purity. The successful launch of new product lines, such as Thermo Fisher Scientific's high-throughput biopharmaceutical purification resins in 2022 demonstrates the market's emphasis on innovation and meeting the demand for faster, more efficient purification processes.
Report Scope & Segmentation Analysis
This report comprehensively analyzes the Chromatography Resins market across various segments:
End-User Industry: Pharmaceuticals (largest segment), Drug Production, Water & Environmental Agencies, Food & Beverages, Other. Each segment’s growth is projected based on its specific industry trends and technological advancements.
Origin: Natural-based resins (e.g., cellulose) and Synthetic-based resins (e.g., Dextran) showing differing growth rates due to their respective advantages and limitations.
Technology: Ion Exchange Chromatography Resins (largest segment due to wide applications), Affinity Chromatography Resins, Size Exclusion Chromatography Resins, Hydrophobic Interaction Chromatography Resins, Other. Growth projections for each technology are driven by factors like technological advancements and industry-specific demands.
Key Drivers of Chromatography Resins Market Growth
The Chromatography Resins market is driven by several key factors: the growing pharmaceutical and biotechnology industries, increasing demand for high-purity products, technological advancements leading to improved resin performance, and stringent regulations promoting the use of high-quality resins. The rising prevalence of chronic diseases is further fueling demand for effective drug therapies, thereby boosting the need for sophisticated purification methods that rely heavily on chromatography resins. Government initiatives promoting innovation in healthcare and environmental protection also contribute to market growth.
Challenges in the Chromatography Resins Market Sector
The market faces challenges including the high cost of resin development and production, competition from substitute technologies, fluctuations in raw material prices, and potential regulatory hurdles in different regions. Supply chain disruptions can also affect the availability and pricing of resins. Intense competition among established players and the entry of new players lead to price pressures and the need for continuous innovation to maintain competitiveness. The impact of these factors on market growth is estimated at approximately xx% for the forecast period.
Emerging Opportunities in Chromatography Resins Market
Emerging opportunities include the development of novel resin materials with enhanced properties, the expansion into new application areas like personalized medicine and environmental remediation, and the increasing adoption of automation and process optimization techniques in chromatography. Growing demand for specialized resins in emerging economies presents significant opportunities for expansion. The focus on sustainability and environmental friendliness will also drive demand for green chromatography resins.
Leading Players in the Chromatography Resins Market Market
- Repligen Corporation
- General Electric
- Bio-Rad Laboratories Inc
- Merck KGaA
- Mitsubishi Chemical Corporation
- Dupont
- Perkinelmer Inc
- Pall Corporation
- Tosoh Bioscience LLC
- Purolite
- Agilent Technologies
- Avantor Inc
- Thermo Fisher Scientific
Key Developments in Chromatography Resins Market Industry
- 2021: Repligen Corporation acquired Pall Corporation's Chromatography and Filtration business, significantly expanding its market share and product portfolio.
- 2022: Thermo Fisher Scientific launched a new line of chromatography resins designed for high-throughput biopharmaceutical purification, enhancing efficiency and meeting industry demands for faster processing.
Strategic Outlook for Chromatography Resins Market Market
The Chromatography Resins market is poised for continued growth, driven by technological advancements, expanding applications, and increasing demand from various industries. The focus on developing sustainable and cost-effective solutions will shape future market dynamics. Opportunities in emerging markets and the ongoing demand for high-performance resins will present significant growth potential in the coming years. Companies should focus on innovation, strategic partnerships, and efficient manufacturing processes to stay competitive in this dynamic market.
Chromatography Resins Market Segmentation
-
1. Origin
-
1.1. Natural-based
- 1.1.1. Agarose
- 1.1.2. Dextran
-
1.2. Synthetic-based
- 1.2.1. Silica Gel
- 1.2.2. Aluminum Oxide
- 1.2.3. Polystyrene
- 1.2.4. Other Synthetic-based Resins
-
1.1. Natural-based
-
2. Technology
- 2.1. Ion Exchange Chromatography Resins
- 2.2. Affinity Chromatography Resins
- 2.3. Size Exclusion Chromatography Resins
- 2.4. Hydrophobic Interaction Chromatography Resins
- 2.5. Other Technologies
-
3. End-user Industry
-
3.1. Pharmaceuticals
- 3.1.1. Biotechnology
- 3.1.2. Drug Discovery
- 3.1.3. Drug Production
- 3.2. Water and Environmental Agencies
- 3.3. Food and Beverages
- 3.4. Other End-user Industries
-
3.1. Pharmaceuticals
Chromatography Resins Market Segmentation By Geography
-
1. Asia Pacific
- 1.1. China
- 1.2. India
- 1.3. Japan
- 1.4. Rest of Asia Pacific
-
2. North America
- 2.1. United States
- 2.2. Canada
- 2.3. Mexico
-
3. Europe
- 3.1. Germany
- 3.2. United Kingdom
- 3.3. Italy
- 3.4. France
- 3.5. Switzerland
- 3.6. Rest of Europe
-
4. Rest of the World
- 4.1. South America
- 4.2. Middle East and Africa
Chromatography Resins Market REPORT HIGHLIGHTS
| Aspects | Details |
|---|---|
| Study Period | 2019-2033 |
| Base Year | 2024 |
| Estimated Year | 2025 |
| Forecast Period | 2025-2033 |
| Historical Period | 2019-2024 |
| Growth Rate | CAGR of > 7.00% from 2019-2033 |
| Segmentation |
|
Table of Contents
- 1. Introduction
- 1.1. Research Scope
- 1.2. Market Segmentation
- 1.3. Research Methodology
- 1.4. Definitions and Assumptions
- 2. Executive Summary
- 2.1. Introduction
- 3. Market Dynamics
- 3.1. Introduction
- 3.2. Market Drivers
- 3.2.1. ; Rising Demand from the Pharmaceutical Sector; Technological Advancements in Chromatography Resins; Increasing Importance of Chromatography Tests in Drug Approvals
- 3.3. Market Restrains
- 3.3.1. ; Lack of Professional Expertise in the Emerging Countries; High Costs vs. Productivity of Chromatography Systems
- 3.4. Market Trends
- 3.4.1. Increasing Demand from Pharmaceutical Sector
- 4. Market Factor Analysis
- 4.1. Porters Five Forces
- 4.2. Supply/Value Chain
- 4.3. PESTEL analysis
- 4.4. Market Entropy
- 4.5. Patent/Trademark Analysis
- 5. Global Chromatography Resins Market Analysis, Insights and Forecast, 2019-2031
- 5.1. Market Analysis, Insights and Forecast - by Origin
- 5.1.1. Natural-based
- 5.1.1.1. Agarose
- 5.1.1.2. Dextran
- 5.1.2. Synthetic-based
- 5.1.2.1. Silica Gel
- 5.1.2.2. Aluminum Oxide
- 5.1.2.3. Polystyrene
- 5.1.2.4. Other Synthetic-based Resins
- 5.1.1. Natural-based
- 5.2. Market Analysis, Insights and Forecast - by Technology
- 5.2.1. Ion Exchange Chromatography Resins
- 5.2.2. Affinity Chromatography Resins
- 5.2.3. Size Exclusion Chromatography Resins
- 5.2.4. Hydrophobic Interaction Chromatography Resins
- 5.2.5. Other Technologies
- 5.3. Market Analysis, Insights and Forecast - by End-user Industry
- 5.3.1. Pharmaceuticals
- 5.3.1.1. Biotechnology
- 5.3.1.2. Drug Discovery
- 5.3.1.3. Drug Production
- 5.3.2. Water and Environmental Agencies
- 5.3.3. Food and Beverages
- 5.3.4. Other End-user Industries
- 5.3.1. Pharmaceuticals
- 5.4. Market Analysis, Insights and Forecast - by Region
- 5.4.1. Asia Pacific
- 5.4.2. North America
- 5.4.3. Europe
- 5.4.4. Rest of the World
- 5.1. Market Analysis, Insights and Forecast - by Origin
- 6. Asia Pacific Chromatography Resins Market Analysis, Insights and Forecast, 2019-2031
- 6.1. Market Analysis, Insights and Forecast - by Origin
- 6.1.1. Natural-based
- 6.1.1.1. Agarose
- 6.1.1.2. Dextran
- 6.1.2. Synthetic-based
- 6.1.2.1. Silica Gel
- 6.1.2.2. Aluminum Oxide
- 6.1.2.3. Polystyrene
- 6.1.2.4. Other Synthetic-based Resins
- 6.1.1. Natural-based
- 6.2. Market Analysis, Insights and Forecast - by Technology
- 6.2.1. Ion Exchange Chromatography Resins
- 6.2.2. Affinity Chromatography Resins
- 6.2.3. Size Exclusion Chromatography Resins
- 6.2.4. Hydrophobic Interaction Chromatography Resins
- 6.2.5. Other Technologies
- 6.3. Market Analysis, Insights and Forecast - by End-user Industry
- 6.3.1. Pharmaceuticals
- 6.3.1.1. Biotechnology
- 6.3.1.2. Drug Discovery
- 6.3.1.3. Drug Production
- 6.3.2. Water and Environmental Agencies
- 6.3.3. Food and Beverages
- 6.3.4. Other End-user Industries
- 6.3.1. Pharmaceuticals
- 6.1. Market Analysis, Insights and Forecast - by Origin
- 7. North America Chromatography Resins Market Analysis, Insights and Forecast, 2019-2031
- 7.1. Market Analysis, Insights and Forecast - by Origin
- 7.1.1. Natural-based
- 7.1.1.1. Agarose
- 7.1.1.2. Dextran
- 7.1.2. Synthetic-based
- 7.1.2.1. Silica Gel
- 7.1.2.2. Aluminum Oxide
- 7.1.2.3. Polystyrene
- 7.1.2.4. Other Synthetic-based Resins
- 7.1.1. Natural-based
- 7.2. Market Analysis, Insights and Forecast - by Technology
- 7.2.1. Ion Exchange Chromatography Resins
- 7.2.2. Affinity Chromatography Resins
- 7.2.3. Size Exclusion Chromatography Resins
- 7.2.4. Hydrophobic Interaction Chromatography Resins
- 7.2.5. Other Technologies
- 7.3. Market Analysis, Insights and Forecast - by End-user Industry
- 7.3.1. Pharmaceuticals
- 7.3.1.1. Biotechnology
- 7.3.1.2. Drug Discovery
- 7.3.1.3. Drug Production
- 7.3.2. Water and Environmental Agencies
- 7.3.3. Food and Beverages
- 7.3.4. Other End-user Industries
- 7.3.1. Pharmaceuticals
- 7.1. Market Analysis, Insights and Forecast - by Origin
- 8. Europe Chromatography Resins Market Analysis, Insights and Forecast, 2019-2031
- 8.1. Market Analysis, Insights and Forecast - by Origin
- 8.1.1. Natural-based
- 8.1.1.1. Agarose
- 8.1.1.2. Dextran
- 8.1.2. Synthetic-based
- 8.1.2.1. Silica Gel
- 8.1.2.2. Aluminum Oxide
- 8.1.2.3. Polystyrene
- 8.1.2.4. Other Synthetic-based Resins
- 8.1.1. Natural-based
- 8.2. Market Analysis, Insights and Forecast - by Technology
- 8.2.1. Ion Exchange Chromatography Resins
- 8.2.2. Affinity Chromatography Resins
- 8.2.3. Size Exclusion Chromatography Resins
- 8.2.4. Hydrophobic Interaction Chromatography Resins
- 8.2.5. Other Technologies
- 8.3. Market Analysis, Insights and Forecast - by End-user Industry
- 8.3.1. Pharmaceuticals
- 8.3.1.1. Biotechnology
- 8.3.1.2. Drug Discovery
- 8.3.1.3. Drug Production
- 8.3.2. Water and Environmental Agencies
- 8.3.3. Food and Beverages
- 8.3.4. Other End-user Industries
- 8.3.1. Pharmaceuticals
- 8.1. Market Analysis, Insights and Forecast - by Origin
- 9. Rest of the World Chromatography Resins Market Analysis, Insights and Forecast, 2019-2031
- 9.1. Market Analysis, Insights and Forecast - by Origin
- 9.1.1. Natural-based
- 9.1.1.1. Agarose
- 9.1.1.2. Dextran
- 9.1.2. Synthetic-based
- 9.1.2.1. Silica Gel
- 9.1.2.2. Aluminum Oxide
- 9.1.2.3. Polystyrene
- 9.1.2.4. Other Synthetic-based Resins
- 9.1.1. Natural-based
- 9.2. Market Analysis, Insights and Forecast - by Technology
- 9.2.1. Ion Exchange Chromatography Resins
- 9.2.2. Affinity Chromatography Resins
- 9.2.3. Size Exclusion Chromatography Resins
- 9.2.4. Hydrophobic Interaction Chromatography Resins
- 9.2.5. Other Technologies
- 9.3. Market Analysis, Insights and Forecast - by End-user Industry
- 9.3.1. Pharmaceuticals
- 9.3.1.1. Biotechnology
- 9.3.1.2. Drug Discovery
- 9.3.1.3. Drug Production
- 9.3.2. Water and Environmental Agencies
- 9.3.3. Food and Beverages
- 9.3.4. Other End-user Industries
- 9.3.1. Pharmaceuticals
- 9.1. Market Analysis, Insights and Forecast - by Origin
- 10. North America Chromatography Resins Market Analysis, Insights and Forecast, 2019-2031
- 10.1. Market Analysis, Insights and Forecast - By Country/Sub-region
- 10.1.1 United States
- 10.1.2 Canada
- 10.1.3 Mexico
- 11. Europe Chromatography Resins Market Analysis, Insights and Forecast, 2019-2031
- 11.1. Market Analysis, Insights and Forecast - By Country/Sub-region
- 11.1.1 Germany
- 11.1.2 United Kingdom
- 11.1.3 France
- 11.1.4 Spain
- 11.1.5 Italy
- 11.1.6 Spain
- 11.1.7 Belgium
- 11.1.8 Netherland
- 11.1.9 Nordics
- 11.1.10 Rest of Europe
- 12. Asia Pacific Chromatography Resins Market Analysis, Insights and Forecast, 2019-2031
- 12.1. Market Analysis, Insights and Forecast - By Country/Sub-region
- 12.1.1 China
- 12.1.2 Japan
- 12.1.3 India
- 12.1.4 South Korea
- 12.1.5 Southeast Asia
- 12.1.6 Australia
- 12.1.7 Indonesia
- 12.1.8 Phillipes
- 12.1.9 Singapore
- 12.1.10 Thailandc
- 12.1.11 Rest of Asia Pacific
- 13. South America Chromatography Resins Market Analysis, Insights and Forecast, 2019-2031
- 13.1. Market Analysis, Insights and Forecast - By Country/Sub-region
- 13.1.1 Brazil
- 13.1.2 Argentina
- 13.1.3 Peru
- 13.1.4 Chile
- 13.1.5 Colombia
- 13.1.6 Ecuador
- 13.1.7 Venezuela
- 13.1.8 Rest of South America
- 14. North America Chromatography Resins Market Analysis, Insights and Forecast, 2019-2031
- 14.1. Market Analysis, Insights and Forecast - By Country/Sub-region
- 14.1.1 United States
- 14.1.2 Canada
- 14.1.3 Mexico
- 15. MEA Chromatography Resins Market Analysis, Insights and Forecast, 2019-2031
- 15.1. Market Analysis, Insights and Forecast - By Country/Sub-region
- 15.1.1 United Arab Emirates
- 15.1.2 Saudi Arabia
- 15.1.3 South Africa
- 15.1.4 Rest of Middle East and Africa
- 16. Competitive Analysis
- 16.1. Global Market Share Analysis 2024
- 16.2. Company Profiles
- 16.2.1 Repligen Corporation
- 16.2.1.1. Overview
- 16.2.1.2. Products
- 16.2.1.3. SWOT Analysis
- 16.2.1.4. Recent Developments
- 16.2.1.5. Financials (Based on Availability)
- 16.2.2 General Electric
- 16.2.2.1. Overview
- 16.2.2.2. Products
- 16.2.2.3. SWOT Analysis
- 16.2.2.4. Recent Developments
- 16.2.2.5. Financials (Based on Availability)
- 16.2.3 Bio-Rad Laboratories Inc
- 16.2.3.1. Overview
- 16.2.3.2. Products
- 16.2.3.3. SWOT Analysis
- 16.2.3.4. Recent Developments
- 16.2.3.5. Financials (Based on Availability)
- 16.2.4 Merck KGaA
- 16.2.4.1. Overview
- 16.2.4.2. Products
- 16.2.4.3. SWOT Analysis
- 16.2.4.4. Recent Developments
- 16.2.4.5. Financials (Based on Availability)
- 16.2.5 Mitsubishi Chemical Corporation
- 16.2.5.1. Overview
- 16.2.5.2. Products
- 16.2.5.3. SWOT Analysis
- 16.2.5.4. Recent Developments
- 16.2.5.5. Financials (Based on Availability)
- 16.2.6 Dupont
- 16.2.6.1. Overview
- 16.2.6.2. Products
- 16.2.6.3. SWOT Analysis
- 16.2.6.4. Recent Developments
- 16.2.6.5. Financials (Based on Availability)
- 16.2.7 Perkinelmer Inc
- 16.2.7.1. Overview
- 16.2.7.2. Products
- 16.2.7.3. SWOT Analysis
- 16.2.7.4. Recent Developments
- 16.2.7.5. Financials (Based on Availability)
- 16.2.8 Pall Corporation
- 16.2.8.1. Overview
- 16.2.8.2. Products
- 16.2.8.3. SWOT Analysis
- 16.2.8.4. Recent Developments
- 16.2.8.5. Financials (Based on Availability)
- 16.2.9 Tosoh Bioscience LLC*List Not Exhaustive
- 16.2.9.1. Overview
- 16.2.9.2. Products
- 16.2.9.3. SWOT Analysis
- 16.2.9.4. Recent Developments
- 16.2.9.5. Financials (Based on Availability)
- 16.2.10 Purolite
- 16.2.10.1. Overview
- 16.2.10.2. Products
- 16.2.10.3. SWOT Analysis
- 16.2.10.4. Recent Developments
- 16.2.10.5. Financials (Based on Availability)
- 16.2.11 Agilient Technologies
- 16.2.11.1. Overview
- 16.2.11.2. Products
- 16.2.11.3. SWOT Analysis
- 16.2.11.4. Recent Developments
- 16.2.11.5. Financials (Based on Availability)
- 16.2.12 Avantor Inc
- 16.2.12.1. Overview
- 16.2.12.2. Products
- 16.2.12.3. SWOT Analysis
- 16.2.12.4. Recent Developments
- 16.2.12.5. Financials (Based on Availability)
- 16.2.13 Thermo Fisher Scientific
- 16.2.13.1. Overview
- 16.2.13.2. Products
- 16.2.13.3. SWOT Analysis
- 16.2.13.4. Recent Developments
- 16.2.13.5. Financials (Based on Availability)
- 16.2.1 Repligen Corporation
List of Figures
- Figure 1: Global Chromatography Resins Market Revenue Breakdown (Million, %) by Region 2024 & 2032
- Figure 2: Global Chromatography Resins Market Volume Breakdown (K Tons, %) by Region 2024 & 2032
- Figure 3: North America Chromatography Resins Market Revenue (Million), by Country 2024 & 2032
- Figure 4: North America Chromatography Resins Market Volume (K Tons), by Country 2024 & 2032
- Figure 5: North America Chromatography Resins Market Revenue Share (%), by Country 2024 & 2032
- Figure 6: North America Chromatography Resins Market Volume Share (%), by Country 2024 & 2032
- Figure 7: Europe Chromatography Resins Market Revenue (Million), by Country 2024 & 2032
- Figure 8: Europe Chromatography Resins Market Volume (K Tons), by Country 2024 & 2032
- Figure 9: Europe Chromatography Resins Market Revenue Share (%), by Country 2024 & 2032
- Figure 10: Europe Chromatography Resins Market Volume Share (%), by Country 2024 & 2032
- Figure 11: Asia Pacific Chromatography Resins Market Revenue (Million), by Country 2024 & 2032
- Figure 12: Asia Pacific Chromatography Resins Market Volume (K Tons), by Country 2024 & 2032
- Figure 13: Asia Pacific Chromatography Resins Market Revenue Share (%), by Country 2024 & 2032
- Figure 14: Asia Pacific Chromatography Resins Market Volume Share (%), by Country 2024 & 2032
- Figure 15: South America Chromatography Resins Market Revenue (Million), by Country 2024 & 2032
- Figure 16: South America Chromatography Resins Market Volume (K Tons), by Country 2024 & 2032
- Figure 17: South America Chromatography Resins Market Revenue Share (%), by Country 2024 & 2032
- Figure 18: South America Chromatography Resins Market Volume Share (%), by Country 2024 & 2032
- Figure 19: North America Chromatography Resins Market Revenue (Million), by Country 2024 & 2032
- Figure 20: North America Chromatography Resins Market Volume (K Tons), by Country 2024 & 2032
- Figure 21: North America Chromatography Resins Market Revenue Share (%), by Country 2024 & 2032
- Figure 22: North America Chromatography Resins Market Volume Share (%), by Country 2024 & 2032
- Figure 23: MEA Chromatography Resins Market Revenue (Million), by Country 2024 & 2032
- Figure 24: MEA Chromatography Resins Market Volume (K Tons), by Country 2024 & 2032
- Figure 25: MEA Chromatography Resins Market Revenue Share (%), by Country 2024 & 2032
- Figure 26: MEA Chromatography Resins Market Volume Share (%), by Country 2024 & 2032
- Figure 27: Asia Pacific Chromatography Resins Market Revenue (Million), by Origin 2024 & 2032
- Figure 28: Asia Pacific Chromatography Resins Market Volume (K Tons), by Origin 2024 & 2032
- Figure 29: Asia Pacific Chromatography Resins Market Revenue Share (%), by Origin 2024 & 2032
- Figure 30: Asia Pacific Chromatography Resins Market Volume Share (%), by Origin 2024 & 2032
- Figure 31: Asia Pacific Chromatography Resins Market Revenue (Million), by Technology 2024 & 2032
- Figure 32: Asia Pacific Chromatography Resins Market Volume (K Tons), by Technology 2024 & 2032
- Figure 33: Asia Pacific Chromatography Resins Market Revenue Share (%), by Technology 2024 & 2032
- Figure 34: Asia Pacific Chromatography Resins Market Volume Share (%), by Technology 2024 & 2032
- Figure 35: Asia Pacific Chromatography Resins Market Revenue (Million), by End-user Industry 2024 & 2032
- Figure 36: Asia Pacific Chromatography Resins Market Volume (K Tons), by End-user Industry 2024 & 2032
- Figure 37: Asia Pacific Chromatography Resins Market Revenue Share (%), by End-user Industry 2024 & 2032
- Figure 38: Asia Pacific Chromatography Resins Market Volume Share (%), by End-user Industry 2024 & 2032
- Figure 39: Asia Pacific Chromatography Resins Market Revenue (Million), by Country 2024 & 2032
- Figure 40: Asia Pacific Chromatography Resins Market Volume (K Tons), by Country 2024 & 2032
- Figure 41: Asia Pacific Chromatography Resins Market Revenue Share (%), by Country 2024 & 2032
- Figure 42: Asia Pacific Chromatography Resins Market Volume Share (%), by Country 2024 & 2032
- Figure 43: North America Chromatography Resins Market Revenue (Million), by Origin 2024 & 2032
- Figure 44: North America Chromatography Resins Market Volume (K Tons), by Origin 2024 & 2032
- Figure 45: North America Chromatography Resins Market Revenue Share (%), by Origin 2024 & 2032
- Figure 46: North America Chromatography Resins Market Volume Share (%), by Origin 2024 & 2032
- Figure 47: North America Chromatography Resins Market Revenue (Million), by Technology 2024 & 2032
- Figure 48: North America Chromatography Resins Market Volume (K Tons), by Technology 2024 & 2032
- Figure 49: North America Chromatography Resins Market Revenue Share (%), by Technology 2024 & 2032
- Figure 50: North America Chromatography Resins Market Volume Share (%), by Technology 2024 & 2032
- Figure 51: North America Chromatography Resins Market Revenue (Million), by End-user Industry 2024 & 2032
- Figure 52: North America Chromatography Resins Market Volume (K Tons), by End-user Industry 2024 & 2032
- Figure 53: North America Chromatography Resins Market Revenue Share (%), by End-user Industry 2024 & 2032
- Figure 54: North America Chromatography Resins Market Volume Share (%), by End-user Industry 2024 & 2032
- Figure 55: North America Chromatography Resins Market Revenue (Million), by Country 2024 & 2032
- Figure 56: North America Chromatography Resins Market Volume (K Tons), by Country 2024 & 2032
- Figure 57: North America Chromatography Resins Market Revenue Share (%), by Country 2024 & 2032
- Figure 58: North America Chromatography Resins Market Volume Share (%), by Country 2024 & 2032
- Figure 59: Europe Chromatography Resins Market Revenue (Million), by Origin 2024 & 2032
- Figure 60: Europe Chromatography Resins Market Volume (K Tons), by Origin 2024 & 2032
- Figure 61: Europe Chromatography Resins Market Revenue Share (%), by Origin 2024 & 2032
- Figure 62: Europe Chromatography Resins Market Volume Share (%), by Origin 2024 & 2032
- Figure 63: Europe Chromatography Resins Market Revenue (Million), by Technology 2024 & 2032
- Figure 64: Europe Chromatography Resins Market Volume (K Tons), by Technology 2024 & 2032
- Figure 65: Europe Chromatography Resins Market Revenue Share (%), by Technology 2024 & 2032
- Figure 66: Europe Chromatography Resins Market Volume Share (%), by Technology 2024 & 2032
- Figure 67: Europe Chromatography Resins Market Revenue (Million), by End-user Industry 2024 & 2032
- Figure 68: Europe Chromatography Resins Market Volume (K Tons), by End-user Industry 2024 & 2032
- Figure 69: Europe Chromatography Resins Market Revenue Share (%), by End-user Industry 2024 & 2032
- Figure 70: Europe Chromatography Resins Market Volume Share (%), by End-user Industry 2024 & 2032
- Figure 71: Europe Chromatography Resins Market Revenue (Million), by Country 2024 & 2032
- Figure 72: Europe Chromatography Resins Market Volume (K Tons), by Country 2024 & 2032
- Figure 73: Europe Chromatography Resins Market Revenue Share (%), by Country 2024 & 2032
- Figure 74: Europe Chromatography Resins Market Volume Share (%), by Country 2024 & 2032
- Figure 75: Rest of the World Chromatography Resins Market Revenue (Million), by Origin 2024 & 2032
- Figure 76: Rest of the World Chromatography Resins Market Volume (K Tons), by Origin 2024 & 2032
- Figure 77: Rest of the World Chromatography Resins Market Revenue Share (%), by Origin 2024 & 2032
- Figure 78: Rest of the World Chromatography Resins Market Volume Share (%), by Origin 2024 & 2032
- Figure 79: Rest of the World Chromatography Resins Market Revenue (Million), by Technology 2024 & 2032
- Figure 80: Rest of the World Chromatography Resins Market Volume (K Tons), by Technology 2024 & 2032
- Figure 81: Rest of the World Chromatography Resins Market Revenue Share (%), by Technology 2024 & 2032
- Figure 82: Rest of the World Chromatography Resins Market Volume Share (%), by Technology 2024 & 2032
- Figure 83: Rest of the World Chromatography Resins Market Revenue (Million), by End-user Industry 2024 & 2032
- Figure 84: Rest of the World Chromatography Resins Market Volume (K Tons), by End-user Industry 2024 & 2032
- Figure 85: Rest of the World Chromatography Resins Market Revenue Share (%), by End-user Industry 2024 & 2032
- Figure 86: Rest of the World Chromatography Resins Market Volume Share (%), by End-user Industry 2024 & 2032
- Figure 87: Rest of the World Chromatography Resins Market Revenue (Million), by Country 2024 & 2032
- Figure 88: Rest of the World Chromatography Resins Market Volume (K Tons), by Country 2024 & 2032
- Figure 89: Rest of the World Chromatography Resins Market Revenue Share (%), by Country 2024 & 2032
- Figure 90: Rest of the World Chromatography Resins Market Volume Share (%), by Country 2024 & 2032
List of Tables
- Table 1: Global Chromatography Resins Market Revenue Million Forecast, by Region 2019 & 2032
- Table 2: Global Chromatography Resins Market Volume K Tons Forecast, by Region 2019 & 2032
- Table 3: Global Chromatography Resins Market Revenue Million Forecast, by Origin 2019 & 2032
- Table 4: Global Chromatography Resins Market Volume K Tons Forecast, by Origin 2019 & 2032
- Table 5: Global Chromatography Resins Market Revenue Million Forecast, by Technology 2019 & 2032
- Table 6: Global Chromatography Resins Market Volume K Tons Forecast, by Technology 2019 & 2032
- Table 7: Global Chromatography Resins Market Revenue Million Forecast, by End-user Industry 2019 & 2032
- Table 8: Global Chromatography Resins Market Volume K Tons Forecast, by End-user Industry 2019 & 2032
- Table 9: Global Chromatography Resins Market Revenue Million Forecast, by Region 2019 & 2032
- Table 10: Global Chromatography Resins Market Volume K Tons Forecast, by Region 2019 & 2032
- Table 11: Global Chromatography Resins Market Revenue Million Forecast, by Country 2019 & 2032
- Table 12: Global Chromatography Resins Market Volume K Tons Forecast, by Country 2019 & 2032
- Table 13: United States Chromatography Resins Market Revenue (Million) Forecast, by Application 2019 & 2032
- Table 14: United States Chromatography Resins Market Volume (K Tons) Forecast, by Application 2019 & 2032
- Table 15: Canada Chromatography Resins Market Revenue (Million) Forecast, by Application 2019 & 2032
- Table 16: Canada Chromatography Resins Market Volume (K Tons) Forecast, by Application 2019 & 2032
- Table 17: Mexico Chromatography Resins Market Revenue (Million) Forecast, by Application 2019 & 2032
- Table 18: Mexico Chromatography Resins Market Volume (K Tons) Forecast, by Application 2019 & 2032
- Table 19: Global Chromatography Resins Market Revenue Million Forecast, by Country 2019 & 2032
- Table 20: Global Chromatography Resins Market Volume K Tons Forecast, by Country 2019 & 2032
- Table 21: Germany Chromatography Resins Market Revenue (Million) Forecast, by Application 2019 & 2032
- Table 22: Germany Chromatography Resins Market Volume (K Tons) Forecast, by Application 2019 & 2032
- Table 23: United Kingdom Chromatography Resins Market Revenue (Million) Forecast, by Application 2019 & 2032
- Table 24: United Kingdom Chromatography Resins Market Volume (K Tons) Forecast, by Application 2019 & 2032
- Table 25: France Chromatography Resins Market Revenue (Million) Forecast, by Application 2019 & 2032
- Table 26: France Chromatography Resins Market Volume (K Tons) Forecast, by Application 2019 & 2032
- Table 27: Spain Chromatography Resins Market Revenue (Million) Forecast, by Application 2019 & 2032
- Table 28: Spain Chromatography Resins Market Volume (K Tons) Forecast, by Application 2019 & 2032
- Table 29: Italy Chromatography Resins Market Revenue (Million) Forecast, by Application 2019 & 2032
- Table 30: Italy Chromatography Resins Market Volume (K Tons) Forecast, by Application 2019 & 2032
- Table 31: Spain Chromatography Resins Market Revenue (Million) Forecast, by Application 2019 & 2032
- Table 32: Spain Chromatography Resins Market Volume (K Tons) Forecast, by Application 2019 & 2032
- Table 33: Belgium Chromatography Resins Market Revenue (Million) Forecast, by Application 2019 & 2032
- Table 34: Belgium Chromatography Resins Market Volume (K Tons) Forecast, by Application 2019 & 2032
- Table 35: Netherland Chromatography Resins Market Revenue (Million) Forecast, by Application 2019 & 2032
- Table 36: Netherland Chromatography Resins Market Volume (K Tons) Forecast, by Application 2019 & 2032
- Table 37: Nordics Chromatography Resins Market Revenue (Million) Forecast, by Application 2019 & 2032
- Table 38: Nordics Chromatography Resins Market Volume (K Tons) Forecast, by Application 2019 & 2032
- Table 39: Rest of Europe Chromatography Resins Market Revenue (Million) Forecast, by Application 2019 & 2032
- Table 40: Rest of Europe Chromatography Resins Market Volume (K Tons) Forecast, by Application 2019 & 2032
- Table 41: Global Chromatography Resins Market Revenue Million Forecast, by Country 2019 & 2032
- Table 42: Global Chromatography Resins Market Volume K Tons Forecast, by Country 2019 & 2032
- Table 43: China Chromatography Resins Market Revenue (Million) Forecast, by Application 2019 & 2032
- Table 44: China Chromatography Resins Market Volume (K Tons) Forecast, by Application 2019 & 2032
- Table 45: Japan Chromatography Resins Market Revenue (Million) Forecast, by Application 2019 & 2032
- Table 46: Japan Chromatography Resins Market Volume (K Tons) Forecast, by Application 2019 & 2032
- Table 47: India Chromatography Resins Market Revenue (Million) Forecast, by Application 2019 & 2032
- Table 48: India Chromatography Resins Market Volume (K Tons) Forecast, by Application 2019 & 2032
- Table 49: South Korea Chromatography Resins Market Revenue (Million) Forecast, by Application 2019 & 2032
- Table 50: South Korea Chromatography Resins Market Volume (K Tons) Forecast, by Application 2019 & 2032
- Table 51: Southeast Asia Chromatography Resins Market Revenue (Million) Forecast, by Application 2019 & 2032
- Table 52: Southeast Asia Chromatography Resins Market Volume (K Tons) Forecast, by Application 2019 & 2032
- Table 53: Australia Chromatography Resins Market Revenue (Million) Forecast, by Application 2019 & 2032
- Table 54: Australia Chromatography Resins Market Volume (K Tons) Forecast, by Application 2019 & 2032
- Table 55: Indonesia Chromatography Resins Market Revenue (Million) Forecast, by Application 2019 & 2032
- Table 56: Indonesia Chromatography Resins Market Volume (K Tons) Forecast, by Application 2019 & 2032
- Table 57: Phillipes Chromatography Resins Market Revenue (Million) Forecast, by Application 2019 & 2032
- Table 58: Phillipes Chromatography Resins Market Volume (K Tons) Forecast, by Application 2019 & 2032
- Table 59: Singapore Chromatography Resins Market Revenue (Million) Forecast, by Application 2019 & 2032
- Table 60: Singapore Chromatography Resins Market Volume (K Tons) Forecast, by Application 2019 & 2032
- Table 61: Thailandc Chromatography Resins Market Revenue (Million) Forecast, by Application 2019 & 2032
- Table 62: Thailandc Chromatography Resins Market Volume (K Tons) Forecast, by Application 2019 & 2032
- Table 63: Rest of Asia Pacific Chromatography Resins Market Revenue (Million) Forecast, by Application 2019 & 2032
- Table 64: Rest of Asia Pacific Chromatography Resins Market Volume (K Tons) Forecast, by Application 2019 & 2032
- Table 65: Global Chromatography Resins Market Revenue Million Forecast, by Country 2019 & 2032
- Table 66: Global Chromatography Resins Market Volume K Tons Forecast, by Country 2019 & 2032
- Table 67: Brazil Chromatography Resins Market Revenue (Million) Forecast, by Application 2019 & 2032
- Table 68: Brazil Chromatography Resins Market Volume (K Tons) Forecast, by Application 2019 & 2032
- Table 69: Argentina Chromatography Resins Market Revenue (Million) Forecast, by Application 2019 & 2032
- Table 70: Argentina Chromatography Resins Market Volume (K Tons) Forecast, by Application 2019 & 2032
- Table 71: Peru Chromatography Resins Market Revenue (Million) Forecast, by Application 2019 & 2032
- Table 72: Peru Chromatography Resins Market Volume (K Tons) Forecast, by Application 2019 & 2032
- Table 73: Chile Chromatography Resins Market Revenue (Million) Forecast, by Application 2019 & 2032
- Table 74: Chile Chromatography Resins Market Volume (K Tons) Forecast, by Application 2019 & 2032
- Table 75: Colombia Chromatography Resins Market Revenue (Million) Forecast, by Application 2019 & 2032
- Table 76: Colombia Chromatography Resins Market Volume (K Tons) Forecast, by Application 2019 & 2032
- Table 77: Ecuador Chromatography Resins Market Revenue (Million) Forecast, by Application 2019 & 2032
- Table 78: Ecuador Chromatography Resins Market Volume (K Tons) Forecast, by Application 2019 & 2032
- Table 79: Venezuela Chromatography Resins Market Revenue (Million) Forecast, by Application 2019 & 2032
- Table 80: Venezuela Chromatography Resins Market Volume (K Tons) Forecast, by Application 2019 & 2032
- Table 81: Rest of South America Chromatography Resins Market Revenue (Million) Forecast, by Application 2019 & 2032
- Table 82: Rest of South America Chromatography Resins Market Volume (K Tons) Forecast, by Application 2019 & 2032
- Table 83: Global Chromatography Resins Market Revenue Million Forecast, by Country 2019 & 2032
- Table 84: Global Chromatography Resins Market Volume K Tons Forecast, by Country 2019 & 2032
- Table 85: United States Chromatography Resins Market Revenue (Million) Forecast, by Application 2019 & 2032
- Table 86: United States Chromatography Resins Market Volume (K Tons) Forecast, by Application 2019 & 2032
- Table 87: Canada Chromatography Resins Market Revenue (Million) Forecast, by Application 2019 & 2032
- Table 88: Canada Chromatography Resins Market Volume (K Tons) Forecast, by Application 2019 & 2032
- Table 89: Mexico Chromatography Resins Market Revenue (Million) Forecast, by Application 2019 & 2032
- Table 90: Mexico Chromatography Resins Market Volume (K Tons) Forecast, by Application 2019 & 2032
- Table 91: Global Chromatography Resins Market Revenue Million Forecast, by Country 2019 & 2032
- Table 92: Global Chromatography Resins Market Volume K Tons Forecast, by Country 2019 & 2032
- Table 93: United Arab Emirates Chromatography Resins Market Revenue (Million) Forecast, by Application 2019 & 2032
- Table 94: United Arab Emirates Chromatography Resins Market Volume (K Tons) Forecast, by Application 2019 & 2032
- Table 95: Saudi Arabia Chromatography Resins Market Revenue (Million) Forecast, by Application 2019 & 2032
- Table 96: Saudi Arabia Chromatography Resins Market Volume (K Tons) Forecast, by Application 2019 & 2032
- Table 97: South Africa Chromatography Resins Market Revenue (Million) Forecast, by Application 2019 & 2032
- Table 98: South Africa Chromatography Resins Market Volume (K Tons) Forecast, by Application 2019 & 2032
- Table 99: Rest of Middle East and Africa Chromatography Resins Market Revenue (Million) Forecast, by Application 2019 & 2032
- Table 100: Rest of Middle East and Africa Chromatography Resins Market Volume (K Tons) Forecast, by Application 2019 & 2032
- Table 101: Global Chromatography Resins Market Revenue Million Forecast, by Origin 2019 & 2032
- Table 102: Global Chromatography Resins Market Volume K Tons Forecast, by Origin 2019 & 2032
- Table 103: Global Chromatography Resins Market Revenue Million Forecast, by Technology 2019 & 2032
- Table 104: Global Chromatography Resins Market Volume K Tons Forecast, by Technology 2019 & 2032
- Table 105: Global Chromatography Resins Market Revenue Million Forecast, by End-user Industry 2019 & 2032
- Table 106: Global Chromatography Resins Market Volume K Tons Forecast, by End-user Industry 2019 & 2032
- Table 107: Global Chromatography Resins Market Revenue Million Forecast, by Country 2019 & 2032
- Table 108: Global Chromatography Resins Market Volume K Tons Forecast, by Country 2019 & 2032
- Table 109: China Chromatography Resins Market Revenue (Million) Forecast, by Application 2019 & 2032
- Table 110: China Chromatography Resins Market Volume (K Tons) Forecast, by Application 2019 & 2032
- Table 111: India Chromatography Resins Market Revenue (Million) Forecast, by Application 2019 & 2032
- Table 112: India Chromatography Resins Market Volume (K Tons) Forecast, by Application 2019 & 2032
- Table 113: Japan Chromatography Resins Market Revenue (Million) Forecast, by Application 2019 & 2032
- Table 114: Japan Chromatography Resins Market Volume (K Tons) Forecast, by Application 2019 & 2032
- Table 115: Rest of Asia Pacific Chromatography Resins Market Revenue (Million) Forecast, by Application 2019 & 2032
- Table 116: Rest of Asia Pacific Chromatography Resins Market Volume (K Tons) Forecast, by Application 2019 & 2032
- Table 117: Global Chromatography Resins Market Revenue Million Forecast, by Origin 2019 & 2032
- Table 118: Global Chromatography Resins Market Volume K Tons Forecast, by Origin 2019 & 2032
- Table 119: Global Chromatography Resins Market Revenue Million Forecast, by Technology 2019 & 2032
- Table 120: Global Chromatography Resins Market Volume K Tons Forecast, by Technology 2019 & 2032
- Table 121: Global Chromatography Resins Market Revenue Million Forecast, by End-user Industry 2019 & 2032
- Table 122: Global Chromatography Resins Market Volume K Tons Forecast, by End-user Industry 2019 & 2032
- Table 123: Global Chromatography Resins Market Revenue Million Forecast, by Country 2019 & 2032
- Table 124: Global Chromatography Resins Market Volume K Tons Forecast, by Country 2019 & 2032
- Table 125: United States Chromatography Resins Market Revenue (Million) Forecast, by Application 2019 & 2032
- Table 126: United States Chromatography Resins Market Volume (K Tons) Forecast, by Application 2019 & 2032
- Table 127: Canada Chromatography Resins Market Revenue (Million) Forecast, by Application 2019 & 2032
- Table 128: Canada Chromatography Resins Market Volume (K Tons) Forecast, by Application 2019 & 2032
- Table 129: Mexico Chromatography Resins Market Revenue (Million) Forecast, by Application 2019 & 2032
- Table 130: Mexico Chromatography Resins Market Volume (K Tons) Forecast, by Application 2019 & 2032
- Table 131: Global Chromatography Resins Market Revenue Million Forecast, by Origin 2019 & 2032
- Table 132: Global Chromatography Resins Market Volume K Tons Forecast, by Origin 2019 & 2032
- Table 133: Global Chromatography Resins Market Revenue Million Forecast, by Technology 2019 & 2032
- Table 134: Global Chromatography Resins Market Volume K Tons Forecast, by Technology 2019 & 2032
- Table 135: Global Chromatography Resins Market Revenue Million Forecast, by End-user Industry 2019 & 2032
- Table 136: Global Chromatography Resins Market Volume K Tons Forecast, by End-user Industry 2019 & 2032
- Table 137: Global Chromatography Resins Market Revenue Million Forecast, by Country 2019 & 2032
- Table 138: Global Chromatography Resins Market Volume K Tons Forecast, by Country 2019 & 2032
- Table 139: Germany Chromatography Resins Market Revenue (Million) Forecast, by Application 2019 & 2032
- Table 140: Germany Chromatography Resins Market Volume (K Tons) Forecast, by Application 2019 & 2032
- Table 141: United Kingdom Chromatography Resins Market Revenue (Million) Forecast, by Application 2019 & 2032
- Table 142: United Kingdom Chromatography Resins Market Volume (K Tons) Forecast, by Application 2019 & 2032
- Table 143: Italy Chromatography Resins Market Revenue (Million) Forecast, by Application 2019 & 2032
- Table 144: Italy Chromatography Resins Market Volume (K Tons) Forecast, by Application 2019 & 2032
- Table 145: France Chromatography Resins Market Revenue (Million) Forecast, by Application 2019 & 2032
- Table 146: France Chromatography Resins Market Volume (K Tons) Forecast, by Application 2019 & 2032
- Table 147: Switzerland Chromatography Resins Market Revenue (Million) Forecast, by Application 2019 & 2032
- Table 148: Switzerland Chromatography Resins Market Volume (K Tons) Forecast, by Application 2019 & 2032
- Table 149: Rest of Europe Chromatography Resins Market Revenue (Million) Forecast, by Application 2019 & 2032
- Table 150: Rest of Europe Chromatography Resins Market Volume (K Tons) Forecast, by Application 2019 & 2032
- Table 151: Global Chromatography Resins Market Revenue Million Forecast, by Origin 2019 & 2032
- Table 152: Global Chromatography Resins Market Volume K Tons Forecast, by Origin 2019 & 2032
- Table 153: Global Chromatography Resins Market Revenue Million Forecast, by Technology 2019 & 2032
- Table 154: Global Chromatography Resins Market Volume K Tons Forecast, by Technology 2019 & 2032
- Table 155: Global Chromatography Resins Market Revenue Million Forecast, by End-user Industry 2019 & 2032
- Table 156: Global Chromatography Resins Market Volume K Tons Forecast, by End-user Industry 2019 & 2032
- Table 157: Global Chromatography Resins Market Revenue Million Forecast, by Country 2019 & 2032
- Table 158: Global Chromatography Resins Market Volume K Tons Forecast, by Country 2019 & 2032
- Table 159: South America Chromatography Resins Market Revenue (Million) Forecast, by Application 2019 & 2032
- Table 160: South America Chromatography Resins Market Volume (K Tons) Forecast, by Application 2019 & 2032
- Table 161: Middle East and Africa Chromatography Resins Market Revenue (Million) Forecast, by Application 2019 & 2032
- Table 162: Middle East and Africa Chromatography Resins Market Volume (K Tons) Forecast, by Application 2019 & 2032
Frequently Asked Questions
1. What is the projected Compound Annual Growth Rate (CAGR) of the Chromatography Resins Market?
The projected CAGR is approximately > 7.00%.
2. Which companies are prominent players in the Chromatography Resins Market?
Key companies in the market include Repligen Corporation, General Electric, Bio-Rad Laboratories Inc, Merck KGaA, Mitsubishi Chemical Corporation, Dupont, Perkinelmer Inc, Pall Corporation, Tosoh Bioscience LLC*List Not Exhaustive, Purolite, Agilient Technologies, Avantor Inc, Thermo Fisher Scientific.
3. What are the main segments of the Chromatography Resins Market?
The market segments include Origin, Technology, End-user Industry.
4. Can you provide details about the market size?
The market size is estimated to be USD 2480 Million as of 2022.
5. What are some drivers contributing to market growth?
; Rising Demand from the Pharmaceutical Sector; Technological Advancements in Chromatography Resins; Increasing Importance of Chromatography Tests in Drug Approvals.
6. What are the notable trends driving market growth?
Increasing Demand from Pharmaceutical Sector.
7. Are there any restraints impacting market growth?
; Lack of Professional Expertise in the Emerging Countries; High Costs vs. Productivity of Chromatography Systems.
8. Can you provide examples of recent developments in the market?
In 2021, Repligen Corporation acquired Pall Corporation's Chromatography and Filtration business. In 2022, Thermo Fisher Scientific launched a new line of chromatography resins designed for high-throughput biopharmaceutical purification.
9. What pricing options are available for accessing the report?
Pricing options include single-user, multi-user, and enterprise licenses priced at USD 4750, USD 5250, and USD 8750 respectively.
10. Is the market size provided in terms of value or volume?
The market size is provided in terms of value, measured in Million and volume, measured in K Tons.
11. Are there any specific market keywords associated with the report?
Yes, the market keyword associated with the report is "Chromatography Resins Market," which aids in identifying and referencing the specific market segment covered.
12. How do I determine which pricing option suits my needs best?
The pricing options vary based on user requirements and access needs. Individual users may opt for single-user licenses, while businesses requiring broader access may choose multi-user or enterprise licenses for cost-effective access to the report.
13. Are there any additional resources or data provided in the Chromatography Resins Market report?
While the report offers comprehensive insights, it's advisable to review the specific contents or supplementary materials provided to ascertain if additional resources or data are available.
14. How can I stay updated on further developments or reports in the Chromatography Resins Market?
To stay informed about further developments, trends, and reports in the Chromatography Resins Market, consider subscribing to industry newsletters, following relevant companies and organizations, or regularly checking reputable industry news sources and publications.
Methodology
Step 1 - Identification of Relevant Samples Size from Population Database


Step 2 - Approaches for Defining Global Market Size (Value, Volume* & Price*)

Note*: In applicable scenarios
Step 3 - Data Sources
Primary Research
- Web Analytics
- Survey Reports
- Research Institute
- Latest Research Reports
- Opinion Leaders
Secondary Research
- Annual Reports
- White Paper
- Latest Press Release
- Industry Association
- Paid Database
- Investor Presentations

Step 4 - Data Triangulation
Involves using different sources of information in order to increase the validity of a study
These sources are likely to be stakeholders in a program - participants, other researchers, program staff, other community members, and so on.
Then we put all data in single framework & apply various statistical tools to find out the dynamic on the market.
During the analysis stage, feedback from the stakeholder groups would be compared to determine areas of agreement as well as areas of divergence


