

Key Insights
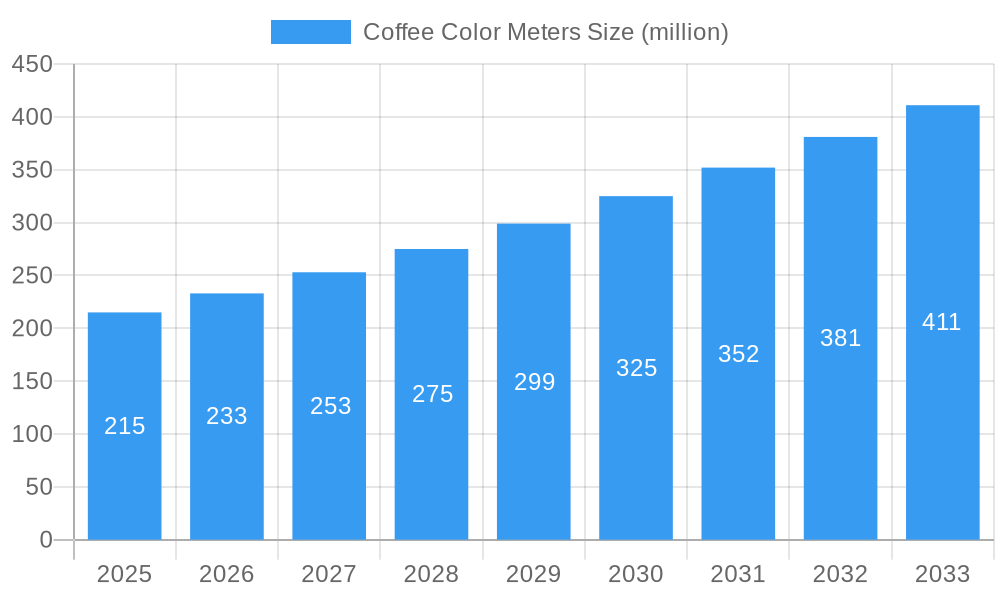
The global Coffee Color Meters market is poised for robust expansion, projected to reach an estimated \$215 million by 2025, with a significant Compound Annual Growth Rate (CAGR) of 8.5% anticipated through 2033. This growth is primarily fueled by the escalating demand for consistent and high-quality coffee across both consumer and industrial sectors. As coffee processing becomes more sophisticated, with an increasing emphasis on precise roasting profiles and bean varietal characteristics, the need for accurate color measurement tools becomes paramount. Key drivers include the burgeoning specialty coffee market, where consumers are increasingly discerning about flavor nuances directly influenced by roast color, and the drive for automation and standardization in large-scale coffee production facilities. Furthermore, regulatory bodies are also implicitly pushing for greater consistency in food products, indirectly benefiting the adoption of advanced measurement technologies.
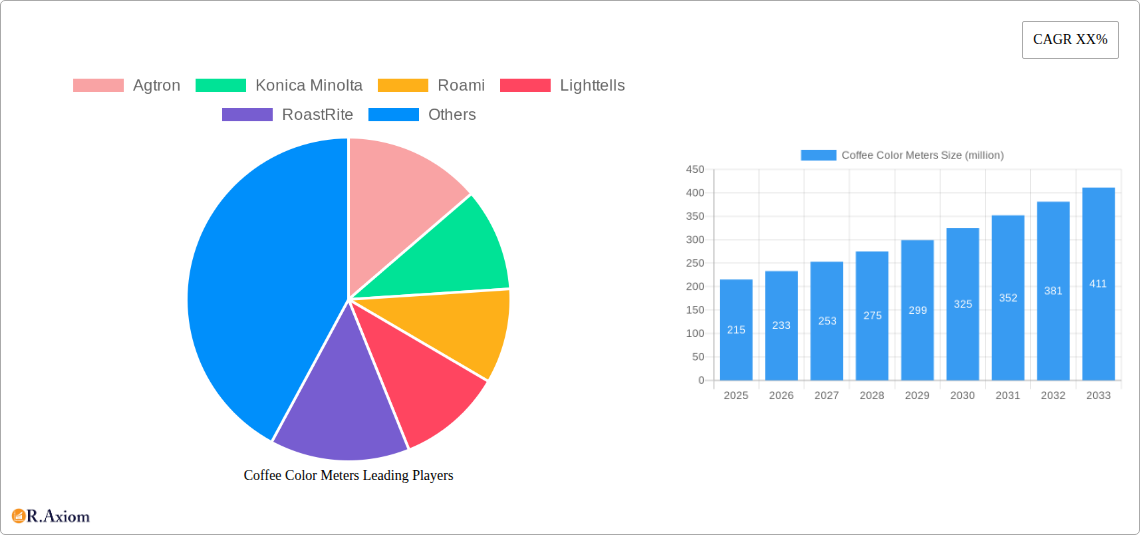
Coffee Color Meters Market Size (In Million)
The market is segmented into Offline Sales and Online Sales, with Offline Sales currently dominating due to the need for hands-on product demonstrations and support, particularly for complex industrial-grade equipment. However, the Online Sales segment is expected to witness accelerated growth as e-commerce platforms mature and provide more detailed product information and virtual support. In terms of product types, Portable Type color meters are gaining traction due to their flexibility and suitability for on-site quality control and field testing by roasters and baristas. Conversely, Desktop Type meters remain crucial for laboratory settings and large-scale processing plants requiring higher precision and data logging capabilities. Geographically, Asia Pacific, particularly China and India, is emerging as a high-growth region, driven by rapid industrialization and a growing middle class with an increasing appetite for premium coffee. North America and Europe continue to represent significant markets due to established coffee cultures and a strong emphasis on quality control.
Coffee Color Meters Company Market Share
This comprehensive report delves into the intricate landscape of the global Coffee Color Meters market, offering an in-depth analysis of its concentration, innovation drivers, and future trajectory. The market, while exhibiting signs of moderate concentration with key players like Agtron, Konica Minolta, and RoastRite holding significant sway, is also characterized by a dynamic innovation ecosystem. Driven by the relentless pursuit of enhanced coffee quality and consistency, advancements in spectral analysis and data processing are at the forefront. Regulatory frameworks, particularly those concerning food safety and quality standards, play a crucial role in shaping product development and market entry strategies. The report meticulously examines the influence of product substitutes, such as visual inspection methods and basic color charts, on the adoption of advanced coffee color meters, highlighting their limitations in precision and objectivity. End-user trends, including the burgeoning demand for specialty coffee and traceable origins, are fueling the need for sophisticated color measurement solutions across the value chain. Mergers and acquisitions (M&A) activities, with recent deal values estimated to be in the range of xx million, are reshaping market dynamics, consolidating expertise and expanding product portfolios. The analysis includes a detailed breakdown of market share for leading companies, projected to be between xx% and xx% for top players, and M&A deal values, estimated at over xx million, providing stakeholders with critical intelligence for strategic decision-making.
Coffee Color Meters Industry Trends & Insights
The global Coffee Color Meters market is poised for robust growth, projected to expand at a Compound Annual Growth Rate (CAGR) of approximately 6.5% during the forecast period of 2025–2033. This sustained expansion is underpinned by a confluence of compelling market growth drivers, chief among them being the escalating consumer demand for high-quality, consistently roasted coffee. As specialty coffee culture permeates global markets, the emphasis on precise roast profiling and color consistency has intensified, making advanced color measurement tools indispensable for roasters of all scales. Technological disruptions are playing a pivotal role, with innovations in spectroscopy, sensor technology, and artificial intelligence enabling more accurate, faster, and user-friendly coffee color measurement. The integration of cloud-based data analytics allows for real-time monitoring, historical trend analysis, and predictive quality control, further enhancing operational efficiency and product consistency. Consumer preferences are evolving towards greater transparency and traceability, driving the need for standardized quality control processes that coffee color meters facilitate. This shift is particularly evident in the online sales segment, where consistent product representation through accurate color data is crucial for building consumer trust and reducing returns. Competitive dynamics are characterized by a healthy interplay between established players and emerging innovators. Companies like Konica Minolta and Agtron are continually refining their existing product lines, while newer entrants like Lighttells and Syncfo are introducing novel technologies that challenge conventional approaches. The market penetration of sophisticated color measurement solutions, currently estimated at around 40%, is expected to rise significantly as awareness of the benefits of objective color analysis grows, particularly among small and medium-sized enterprises (SMEs). The average market penetration in developed regions is expected to reach xx%, while emerging economies are projected to see a CAGR of xx% in adoption rates. The insights gleaned from the study period of 2019–2033, with a base year of 2025, reveal a strong upward trend driven by these multifaceted factors.
Dominant Markets & Segments in Coffee Color Meters
The global Coffee Color Meters market exhibits distinct regional and segment-based dominance, driven by a complex interplay of economic policies, infrastructure development, and evolving consumer demands.
Leading Region: North America North America currently stands as the dominant region in the coffee color meters market. Key drivers for this dominance include:
- Mature Specialty Coffee Market: The region boasts a well-established and continuously growing specialty coffee sector, with a high consumer appreciation for nuanced flavors and precise roast profiles. This has fostered a strong demand for advanced quality control tools.
- Technological Adoption: North American businesses, including roasters and manufacturers, demonstrate a high propensity for adopting new technologies that offer efficiency and quality improvements.
- Economic Stability and Investment: A robust economic environment allows for greater investment in sophisticated equipment, enabling businesses to maintain competitive edges.
- Regulatory Standards: Stringent food safety and quality regulations necessitate objective measurement methods, pushing the adoption of precise color meters.
Dominant Segment by Application: Offline Sales While online sales are growing, the Offline Sales segment currently holds the larger market share for coffee color meters. This dominance is attributable to:
- Physical Retail Presence: The majority of coffee production and processing facilities, including large-scale roasters and manufacturing plants, operate within a traditional offline framework. These entities require on-site quality control.
- Established Supply Chains: Traditional supply chains in the coffee industry are deeply entrenched in offline operations, from sourcing green beans to final product packaging, all requiring consistent quality assurance.
- Direct Quality Control: For immediate feedback on roast batches and batch-to-batch consistency, offline color measurement is critical for production line efficiency and immediate adjustments.
Dominant Segment by Type: Desktop Type The Desktop Type coffee color meters represent the most prevalent category within the market. This preference is driven by:
- Laboratory and Production Line Integration: Desktop models are ideal for integration into quality control laboratories and production lines, offering a stable and precise measurement environment.
- Advanced Features and Accuracy: These units typically offer a higher degree of accuracy, a wider range of measurement capabilities, and more comprehensive data analysis features compared to portable options, catering to professional needs.
- Investment Capacity: Businesses that can afford and justify the investment in desktop units often prioritize the enhanced performance and long-term reliability they offer for critical quality control processes.
The dominance analysis reveals that established markets and traditional operational frameworks currently favor the widespread adoption of sophisticated desktop coffee color meters for offline sales applications. However, the burgeoning online sales sector and the increasing mobility of coffee operations signal future growth opportunities for portable solutions.
Coffee Color Meters Product Developments
Product developments in the coffee color meters sector are primarily focused on enhancing accuracy, portability, and data integration. Companies like Agtron and Konica Minolta are leading with advanced spectral analysis technologies that provide more nuanced color data beyond simple Lab* values, offering insights into roast development and potential defects. Innovations in portable devices, such as those offered by RoastRite and Dipper, are making sophisticated measurement accessible directly at the point of origin or for on-the-go quality checks in dynamic environments. The integration of IoT capabilities and cloud-based platforms by players like Syncfo and Javalytics allows for seamless data logging, remote monitoring, and predictive analytics, providing roasters with unprecedented control over their roasting profiles and product consistency, thereby offering significant competitive advantages in quality assurance.
Report Scope & Segmentation Analysis
This report provides an in-depth analysis of the global Coffee Color Meters market, meticulously segmenting it to offer actionable insights across various dimensions. The segmentation covers:
Application:
- Offline Sales: This segment encompasses the use of coffee color meters in traditional brick-and-mortar retail settings, large-scale roasting facilities, and manufacturing plants where direct physical quality control is paramount. The market size for this segment is estimated at xx million and is projected to grow at a CAGR of xx% from 2025 to 2033. Competitive dynamics here are driven by the need for robust, on-site solutions.
- Online Sales: This segment focuses on the application of coffee color meters in supporting e-commerce and direct-to-consumer coffee sales, where consistent product representation and quality assurance are crucial for brand reputation and customer satisfaction. The market size for this segment is estimated at xx million and is projected to grow at a CAGR of xx% from 2025 to 2033. Growth is fueled by the increasing demand for product consistency in digital marketplaces.
Types:
- Portable Type: This segment covers handheld and portable coffee color meters designed for flexibility and on-the-spot measurements, ideal for field applications, small roasteries, and mobile quality control. The market size for this segment is estimated at xx million and is projected to grow at a CAGR of xx% from 2025 to 2033. Competitive dynamics involve ease of use and battery life.
- Desktop Type: This segment includes benchtop and stationary coffee color meters, typically used in laboratory settings or production lines where high precision, advanced features, and continuous operation are prioritized. The market size for this segment is estimated at xx million and is projected to grow at a CAGR of xx% from 2025 to 2033. Growth is driven by accuracy and comprehensive data analysis capabilities.
Key Drivers of Coffee Color Meters Growth
The coffee color meters market is experiencing significant growth driven by several key factors. Firstly, the escalating global demand for specialty coffee, with its emphasis on precise flavor profiles and consistent quality, necessitates objective color measurement for optimal roast development. Technological advancements, particularly in spectral analysis and sensor technology, are providing more accurate, reliable, and user-friendly devices. The increasing need for quality standardization across the entire coffee supply chain, from green bean sourcing to final product, also fuels adoption. Furthermore, regulatory bodies and industry associations are promoting stricter quality control measures, indirectly boosting the demand for sophisticated measurement tools. The growing trend of direct-to-consumer coffee sales online also requires roasters to ensure product consistency and accurate representation, driving investment in these devices.
Challenges in the Coffee Color Meters Sector
Despite the promising growth trajectory, the coffee color meters sector faces several challenges. High initial investment costs for advanced devices can be a significant barrier, especially for small and medium-sized enterprises (SMEs) in emerging markets, with initial setup costs ranging from xx thousand to xx million. The need for trained personnel to operate and interpret data from sophisticated meters can also pose a challenge, requiring investment in training programs. Furthermore, the existence of more affordable, albeit less precise, traditional methods like visual inspection and basic color charts continues to offer a degree of competition. Supply chain disruptions, particularly for specialized components and manufacturing, can also impact production and lead to price volatility, estimated to affect xx% of component costs. Regulatory hurdles in certain regions related to equipment certification can also slow down market entry.
Emerging Opportunities in Coffee Color Meters
Emerging opportunities in the coffee color meters market are ripe for exploration. The growing demand for traceable and ethically sourced coffee is creating a niche for color meters that can document the quality and consistency of coffee from farm to cup. The expansion of the specialty coffee market into developing economies presents a significant untapped potential, with roasters in these regions increasingly seeking to elevate their product quality. Advancements in AI and machine learning offer opportunities for predictive analytics in coffee roasting, allowing color meters to not just measure color but also predict flavor outcomes. The development of more compact, affordable, and user-friendly portable color meters is also opening up new applications, such as in-field quality assessment at coffee farms and during transportation. Integration with blockchain technology for immutable quality record-keeping is another promising avenue.
Leading Players in the Coffee Color Meters Market
- Agtron
- Konica Minolta
- Roami
- Lighttells
- RoastRite
- Syncfo
- Javalytics
- Dipper
- Tonino
Key Developments in Coffee Color Meters Industry
- 2024 March: Agtron launches its next-generation Agtron Spectro Model, offering enhanced spectral accuracy and real-time data analysis for advanced roast profiling.
- 2023 December: Konica Minolta introduces a new software suite for its color measurement instruments, enabling AI-driven predictive quality control for coffee roasting.
- 2023 September: RoastRite releases a highly portable and durable coffee color meter designed for on-farm quality assessment, targeting emerging markets.
- 2023 June: Lighttells announces strategic partnerships with several large coffee cooperatives to implement its advanced color measurement solutions.
- 2022 November: Syncfo integrates IoT capabilities into its coffee color meters, allowing for remote monitoring and cloud-based data management.
- 2022 April: Javalytics unveils a compact, battery-operated coffee color meter aimed at small-scale artisanal roasters.
- 2021 October: Dipper introduces an innovative color measurement solution with enhanced sensitivity for detecting subtle variations in coffee bean color.
- 2021 July: Tonino expands its distribution network in Southeast Asia, increasing accessibility of its color measurement technologies in the region.
Strategic Outlook for Coffee Color Meters Market
The strategic outlook for the coffee color meters market is highly optimistic, driven by sustained demand for quality and consistency in the global coffee industry. Key growth catalysts include the continued expansion of the specialty coffee segment, which places a premium on precise roast profiling, and the increasing adoption of advanced technologies like AI and IoT for predictive quality control and operational efficiency. The rising consumer awareness and preference for traceable and ethically produced coffee also present a significant opportunity, as color measurement becomes an integral part of quality assurance documentation. Furthermore, the ongoing innovation in portable and user-friendly devices is expected to democratize access to sophisticated color measurement, particularly for smaller businesses and in emerging markets. Strategic collaborations and product development focused on data integration and cloud-based analytics will be crucial for capturing market share and driving future growth.
Coffee Color Meters Segmentation
-
1. Application
- 1.1. Offline Sales
- 1.2. Online Sales
-
2. Types
- 2.1. Portable Type
- 2.2. Desktop Type
Coffee Color Meters Segmentation By Geography
-
1. North America
- 1.1. United States
- 1.2. Canada
- 1.3. Mexico
-
2. South America
- 2.1. Brazil
- 2.2. Argentina
- 2.3. Rest of South America
-
3. Europe
- 3.1. United Kingdom
- 3.2. Germany
- 3.3. France
- 3.4. Italy
- 3.5. Spain
- 3.6. Russia
- 3.7. Benelux
- 3.8. Nordics
- 3.9. Rest of Europe
-
4. Middle East & Africa
- 4.1. Turkey
- 4.2. Israel
- 4.3. GCC
- 4.4. North Africa
- 4.5. South Africa
- 4.6. Rest of Middle East & Africa
-
5. Asia Pacific
- 5.1. China
- 5.2. India
- 5.3. Japan
- 5.4. South Korea
- 5.5. ASEAN
- 5.6. Oceania
- 5.7. Rest of Asia Pacific
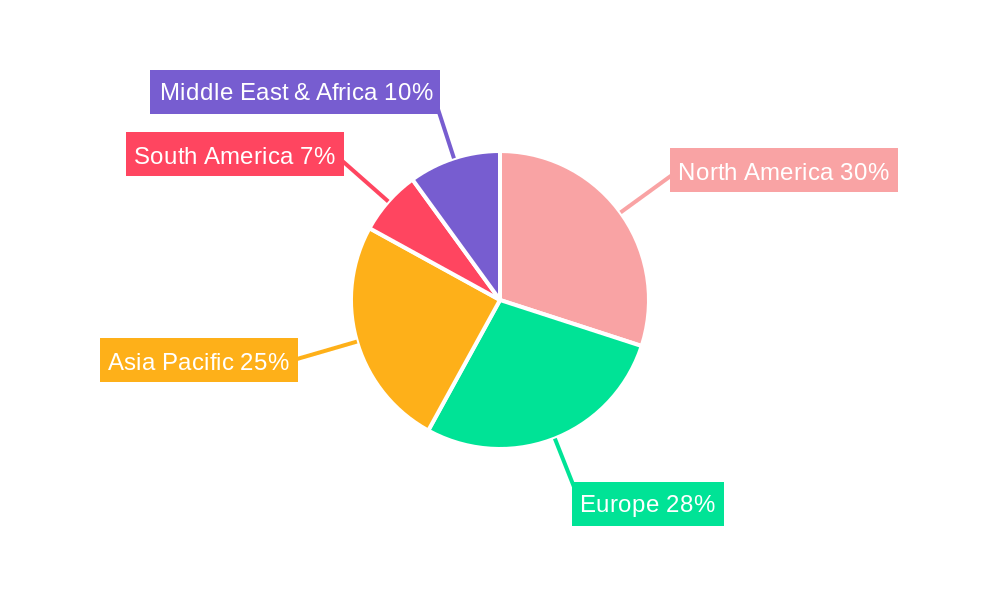
Coffee Color Meters Regional Market Share
Geographic Coverage of Coffee Color Meters
Coffee Color Meters REPORT HIGHLIGHTS
| Aspects | Details |
|---|---|
| Study Period | 2020-2034 |
| Base Year | 2025 |
| Estimated Year | 2026 |
| Forecast Period | 2026-2034 |
| Historical Period | 2020-2025 |
| Growth Rate | CAGR of 7% from 2020-2034 |
| Segmentation |
|
Table of Contents
- 1. Introduction
- 1.1. Research Scope
- 1.2. Market Segmentation
- 1.3. Research Methodology
- 1.4. Definitions and Assumptions
- 2. Executive Summary
- 2.1. Introduction
- 3. Market Dynamics
- 3.1. Introduction
- 3.2. Market Drivers
- 3.3. Market Restrains
- 3.4. Market Trends
- 4. Market Factor Analysis
- 4.1. Porters Five Forces
- 4.2. Supply/Value Chain
- 4.3. PESTEL analysis
- 4.4. Market Entropy
- 4.5. Patent/Trademark Analysis
- 5. Global Coffee Color Meters Analysis, Insights and Forecast, 2020-2032
- 5.1. Market Analysis, Insights and Forecast - by Application
- 5.1.1. Offline Sales
- 5.1.2. Online Sales
- 5.2. Market Analysis, Insights and Forecast - by Types
- 5.2.1. Portable Type
- 5.2.2. Desktop Type
- 5.3. Market Analysis, Insights and Forecast - by Region
- 5.3.1. North America
- 5.3.2. South America
- 5.3.3. Europe
- 5.3.4. Middle East & Africa
- 5.3.5. Asia Pacific
- 5.1. Market Analysis, Insights and Forecast - by Application
- 6. North America Coffee Color Meters Analysis, Insights and Forecast, 2020-2032
- 6.1. Market Analysis, Insights and Forecast - by Application
- 6.1.1. Offline Sales
- 6.1.2. Online Sales
- 6.2. Market Analysis, Insights and Forecast - by Types
- 6.2.1. Portable Type
- 6.2.2. Desktop Type
- 6.1. Market Analysis, Insights and Forecast - by Application
- 7. South America Coffee Color Meters Analysis, Insights and Forecast, 2020-2032
- 7.1. Market Analysis, Insights and Forecast - by Application
- 7.1.1. Offline Sales
- 7.1.2. Online Sales
- 7.2. Market Analysis, Insights and Forecast - by Types
- 7.2.1. Portable Type
- 7.2.2. Desktop Type
- 7.1. Market Analysis, Insights and Forecast - by Application
- 8. Europe Coffee Color Meters Analysis, Insights and Forecast, 2020-2032
- 8.1. Market Analysis, Insights and Forecast - by Application
- 8.1.1. Offline Sales
- 8.1.2. Online Sales
- 8.2. Market Analysis, Insights and Forecast - by Types
- 8.2.1. Portable Type
- 8.2.2. Desktop Type
- 8.1. Market Analysis, Insights and Forecast - by Application
- 9. Middle East & Africa Coffee Color Meters Analysis, Insights and Forecast, 2020-2032
- 9.1. Market Analysis, Insights and Forecast - by Application
- 9.1.1. Offline Sales
- 9.1.2. Online Sales
- 9.2. Market Analysis, Insights and Forecast - by Types
- 9.2.1. Portable Type
- 9.2.2. Desktop Type
- 9.1. Market Analysis, Insights and Forecast - by Application
- 10. Asia Pacific Coffee Color Meters Analysis, Insights and Forecast, 2020-2032
- 10.1. Market Analysis, Insights and Forecast - by Application
- 10.1.1. Offline Sales
- 10.1.2. Online Sales
- 10.2. Market Analysis, Insights and Forecast - by Types
- 10.2.1. Portable Type
- 10.2.2. Desktop Type
- 10.1. Market Analysis, Insights and Forecast - by Application
- 11. Competitive Analysis
- 11.1. Global Market Share Analysis 2025
- 11.2. Company Profiles
- 11.2.1 Agtron
- 11.2.1.1. Overview
- 11.2.1.2. Products
- 11.2.1.3. SWOT Analysis
- 11.2.1.4. Recent Developments
- 11.2.1.5. Financials (Based on Availability)
- 11.2.2 Konica Minolta
- 11.2.2.1. Overview
- 11.2.2.2. Products
- 11.2.2.3. SWOT Analysis
- 11.2.2.4. Recent Developments
- 11.2.2.5. Financials (Based on Availability)
- 11.2.3 Roami
- 11.2.3.1. Overview
- 11.2.3.2. Products
- 11.2.3.3. SWOT Analysis
- 11.2.3.4. Recent Developments
- 11.2.3.5. Financials (Based on Availability)
- 11.2.4 Lighttells
- 11.2.4.1. Overview
- 11.2.4.2. Products
- 11.2.4.3. SWOT Analysis
- 11.2.4.4. Recent Developments
- 11.2.4.5. Financials (Based on Availability)
- 11.2.5 RoastRite
- 11.2.5.1. Overview
- 11.2.5.2. Products
- 11.2.5.3. SWOT Analysis
- 11.2.5.4. Recent Developments
- 11.2.5.5. Financials (Based on Availability)
- 11.2.6 Syncfo
- 11.2.6.1. Overview
- 11.2.6.2. Products
- 11.2.6.3. SWOT Analysis
- 11.2.6.4. Recent Developments
- 11.2.6.5. Financials (Based on Availability)
- 11.2.7 Javalytics
- 11.2.7.1. Overview
- 11.2.7.2. Products
- 11.2.7.3. SWOT Analysis
- 11.2.7.4. Recent Developments
- 11.2.7.5. Financials (Based on Availability)
- 11.2.8 Dipper
- 11.2.8.1. Overview
- 11.2.8.2. Products
- 11.2.8.3. SWOT Analysis
- 11.2.8.4. Recent Developments
- 11.2.8.5. Financials (Based on Availability)
- 11.2.9 Tonino
- 11.2.9.1. Overview
- 11.2.9.2. Products
- 11.2.9.3. SWOT Analysis
- 11.2.9.4. Recent Developments
- 11.2.9.5. Financials (Based on Availability)
- 11.2.1 Agtron
List of Figures
- Figure 1: Global Coffee Color Meters Revenue Breakdown (undefined, %) by Region 2025 & 2033
- Figure 2: Global Coffee Color Meters Volume Breakdown (K, %) by Region 2025 & 2033
- Figure 3: North America Coffee Color Meters Revenue (undefined), by Application 2025 & 2033
- Figure 4: North America Coffee Color Meters Volume (K), by Application 2025 & 2033
- Figure 5: North America Coffee Color Meters Revenue Share (%), by Application 2025 & 2033
- Figure 6: North America Coffee Color Meters Volume Share (%), by Application 2025 & 2033
- Figure 7: North America Coffee Color Meters Revenue (undefined), by Types 2025 & 2033
- Figure 8: North America Coffee Color Meters Volume (K), by Types 2025 & 2033
- Figure 9: North America Coffee Color Meters Revenue Share (%), by Types 2025 & 2033
- Figure 10: North America Coffee Color Meters Volume Share (%), by Types 2025 & 2033
- Figure 11: North America Coffee Color Meters Revenue (undefined), by Country 2025 & 2033
- Figure 12: North America Coffee Color Meters Volume (K), by Country 2025 & 2033
- Figure 13: North America Coffee Color Meters Revenue Share (%), by Country 2025 & 2033
- Figure 14: North America Coffee Color Meters Volume Share (%), by Country 2025 & 2033
- Figure 15: South America Coffee Color Meters Revenue (undefined), by Application 2025 & 2033
- Figure 16: South America Coffee Color Meters Volume (K), by Application 2025 & 2033
- Figure 17: South America Coffee Color Meters Revenue Share (%), by Application 2025 & 2033
- Figure 18: South America Coffee Color Meters Volume Share (%), by Application 2025 & 2033
- Figure 19: South America Coffee Color Meters Revenue (undefined), by Types 2025 & 2033
- Figure 20: South America Coffee Color Meters Volume (K), by Types 2025 & 2033
- Figure 21: South America Coffee Color Meters Revenue Share (%), by Types 2025 & 2033
- Figure 22: South America Coffee Color Meters Volume Share (%), by Types 2025 & 2033
- Figure 23: South America Coffee Color Meters Revenue (undefined), by Country 2025 & 2033
- Figure 24: South America Coffee Color Meters Volume (K), by Country 2025 & 2033
- Figure 25: South America Coffee Color Meters Revenue Share (%), by Country 2025 & 2033
- Figure 26: South America Coffee Color Meters Volume Share (%), by Country 2025 & 2033
- Figure 27: Europe Coffee Color Meters Revenue (undefined), by Application 2025 & 2033
- Figure 28: Europe Coffee Color Meters Volume (K), by Application 2025 & 2033
- Figure 29: Europe Coffee Color Meters Revenue Share (%), by Application 2025 & 2033
- Figure 30: Europe Coffee Color Meters Volume Share (%), by Application 2025 & 2033
- Figure 31: Europe Coffee Color Meters Revenue (undefined), by Types 2025 & 2033
- Figure 32: Europe Coffee Color Meters Volume (K), by Types 2025 & 2033
- Figure 33: Europe Coffee Color Meters Revenue Share (%), by Types 2025 & 2033
- Figure 34: Europe Coffee Color Meters Volume Share (%), by Types 2025 & 2033
- Figure 35: Europe Coffee Color Meters Revenue (undefined), by Country 2025 & 2033
- Figure 36: Europe Coffee Color Meters Volume (K), by Country 2025 & 2033
- Figure 37: Europe Coffee Color Meters Revenue Share (%), by Country 2025 & 2033
- Figure 38: Europe Coffee Color Meters Volume Share (%), by Country 2025 & 2033
- Figure 39: Middle East & Africa Coffee Color Meters Revenue (undefined), by Application 2025 & 2033
- Figure 40: Middle East & Africa Coffee Color Meters Volume (K), by Application 2025 & 2033
- Figure 41: Middle East & Africa Coffee Color Meters Revenue Share (%), by Application 2025 & 2033
- Figure 42: Middle East & Africa Coffee Color Meters Volume Share (%), by Application 2025 & 2033
- Figure 43: Middle East & Africa Coffee Color Meters Revenue (undefined), by Types 2025 & 2033
- Figure 44: Middle East & Africa Coffee Color Meters Volume (K), by Types 2025 & 2033
- Figure 45: Middle East & Africa Coffee Color Meters Revenue Share (%), by Types 2025 & 2033
- Figure 46: Middle East & Africa Coffee Color Meters Volume Share (%), by Types 2025 & 2033
- Figure 47: Middle East & Africa Coffee Color Meters Revenue (undefined), by Country 2025 & 2033
- Figure 48: Middle East & Africa Coffee Color Meters Volume (K), by Country 2025 & 2033
- Figure 49: Middle East & Africa Coffee Color Meters Revenue Share (%), by Country 2025 & 2033
- Figure 50: Middle East & Africa Coffee Color Meters Volume Share (%), by Country 2025 & 2033
- Figure 51: Asia Pacific Coffee Color Meters Revenue (undefined), by Application 2025 & 2033
- Figure 52: Asia Pacific Coffee Color Meters Volume (K), by Application 2025 & 2033
- Figure 53: Asia Pacific Coffee Color Meters Revenue Share (%), by Application 2025 & 2033
- Figure 54: Asia Pacific Coffee Color Meters Volume Share (%), by Application 2025 & 2033
- Figure 55: Asia Pacific Coffee Color Meters Revenue (undefined), by Types 2025 & 2033
- Figure 56: Asia Pacific Coffee Color Meters Volume (K), by Types 2025 & 2033
- Figure 57: Asia Pacific Coffee Color Meters Revenue Share (%), by Types 2025 & 2033
- Figure 58: Asia Pacific Coffee Color Meters Volume Share (%), by Types 2025 & 2033
- Figure 59: Asia Pacific Coffee Color Meters Revenue (undefined), by Country 2025 & 2033
- Figure 60: Asia Pacific Coffee Color Meters Volume (K), by Country 2025 & 2033
- Figure 61: Asia Pacific Coffee Color Meters Revenue Share (%), by Country 2025 & 2033
- Figure 62: Asia Pacific Coffee Color Meters Volume Share (%), by Country 2025 & 2033
List of Tables
- Table 1: Global Coffee Color Meters Revenue undefined Forecast, by Application 2020 & 2033
- Table 2: Global Coffee Color Meters Volume K Forecast, by Application 2020 & 2033
- Table 3: Global Coffee Color Meters Revenue undefined Forecast, by Types 2020 & 2033
- Table 4: Global Coffee Color Meters Volume K Forecast, by Types 2020 & 2033
- Table 5: Global Coffee Color Meters Revenue undefined Forecast, by Region 2020 & 2033
- Table 6: Global Coffee Color Meters Volume K Forecast, by Region 2020 & 2033
- Table 7: Global Coffee Color Meters Revenue undefined Forecast, by Application 2020 & 2033
- Table 8: Global Coffee Color Meters Volume K Forecast, by Application 2020 & 2033
- Table 9: Global Coffee Color Meters Revenue undefined Forecast, by Types 2020 & 2033
- Table 10: Global Coffee Color Meters Volume K Forecast, by Types 2020 & 2033
- Table 11: Global Coffee Color Meters Revenue undefined Forecast, by Country 2020 & 2033
- Table 12: Global Coffee Color Meters Volume K Forecast, by Country 2020 & 2033
- Table 13: United States Coffee Color Meters Revenue (undefined) Forecast, by Application 2020 & 2033
- Table 14: United States Coffee Color Meters Volume (K) Forecast, by Application 2020 & 2033
- Table 15: Canada Coffee Color Meters Revenue (undefined) Forecast, by Application 2020 & 2033
- Table 16: Canada Coffee Color Meters Volume (K) Forecast, by Application 2020 & 2033
- Table 17: Mexico Coffee Color Meters Revenue (undefined) Forecast, by Application 2020 & 2033
- Table 18: Mexico Coffee Color Meters Volume (K) Forecast, by Application 2020 & 2033
- Table 19: Global Coffee Color Meters Revenue undefined Forecast, by Application 2020 & 2033
- Table 20: Global Coffee Color Meters Volume K Forecast, by Application 2020 & 2033
- Table 21: Global Coffee Color Meters Revenue undefined Forecast, by Types 2020 & 2033
- Table 22: Global Coffee Color Meters Volume K Forecast, by Types 2020 & 2033
- Table 23: Global Coffee Color Meters Revenue undefined Forecast, by Country 2020 & 2033
- Table 24: Global Coffee Color Meters Volume K Forecast, by Country 2020 & 2033
- Table 25: Brazil Coffee Color Meters Revenue (undefined) Forecast, by Application 2020 & 2033
- Table 26: Brazil Coffee Color Meters Volume (K) Forecast, by Application 2020 & 2033
- Table 27: Argentina Coffee Color Meters Revenue (undefined) Forecast, by Application 2020 & 2033
- Table 28: Argentina Coffee Color Meters Volume (K) Forecast, by Application 2020 & 2033
- Table 29: Rest of South America Coffee Color Meters Revenue (undefined) Forecast, by Application 2020 & 2033
- Table 30: Rest of South America Coffee Color Meters Volume (K) Forecast, by Application 2020 & 2033
- Table 31: Global Coffee Color Meters Revenue undefined Forecast, by Application 2020 & 2033
- Table 32: Global Coffee Color Meters Volume K Forecast, by Application 2020 & 2033
- Table 33: Global Coffee Color Meters Revenue undefined Forecast, by Types 2020 & 2033
- Table 34: Global Coffee Color Meters Volume K Forecast, by Types 2020 & 2033
- Table 35: Global Coffee Color Meters Revenue undefined Forecast, by Country 2020 & 2033
- Table 36: Global Coffee Color Meters Volume K Forecast, by Country 2020 & 2033
- Table 37: United Kingdom Coffee Color Meters Revenue (undefined) Forecast, by Application 2020 & 2033
- Table 38: United Kingdom Coffee Color Meters Volume (K) Forecast, by Application 2020 & 2033
- Table 39: Germany Coffee Color Meters Revenue (undefined) Forecast, by Application 2020 & 2033
- Table 40: Germany Coffee Color Meters Volume (K) Forecast, by Application 2020 & 2033
- Table 41: France Coffee Color Meters Revenue (undefined) Forecast, by Application 2020 & 2033
- Table 42: France Coffee Color Meters Volume (K) Forecast, by Application 2020 & 2033
- Table 43: Italy Coffee Color Meters Revenue (undefined) Forecast, by Application 2020 & 2033
- Table 44: Italy Coffee Color Meters Volume (K) Forecast, by Application 2020 & 2033
- Table 45: Spain Coffee Color Meters Revenue (undefined) Forecast, by Application 2020 & 2033
- Table 46: Spain Coffee Color Meters Volume (K) Forecast, by Application 2020 & 2033
- Table 47: Russia Coffee Color Meters Revenue (undefined) Forecast, by Application 2020 & 2033
- Table 48: Russia Coffee Color Meters Volume (K) Forecast, by Application 2020 & 2033
- Table 49: Benelux Coffee Color Meters Revenue (undefined) Forecast, by Application 2020 & 2033
- Table 50: Benelux Coffee Color Meters Volume (K) Forecast, by Application 2020 & 2033
- Table 51: Nordics Coffee Color Meters Revenue (undefined) Forecast, by Application 2020 & 2033
- Table 52: Nordics Coffee Color Meters Volume (K) Forecast, by Application 2020 & 2033
- Table 53: Rest of Europe Coffee Color Meters Revenue (undefined) Forecast, by Application 2020 & 2033
- Table 54: Rest of Europe Coffee Color Meters Volume (K) Forecast, by Application 2020 & 2033
- Table 55: Global Coffee Color Meters Revenue undefined Forecast, by Application 2020 & 2033
- Table 56: Global Coffee Color Meters Volume K Forecast, by Application 2020 & 2033
- Table 57: Global Coffee Color Meters Revenue undefined Forecast, by Types 2020 & 2033
- Table 58: Global Coffee Color Meters Volume K Forecast, by Types 2020 & 2033
- Table 59: Global Coffee Color Meters Revenue undefined Forecast, by Country 2020 & 2033
- Table 60: Global Coffee Color Meters Volume K Forecast, by Country 2020 & 2033
- Table 61: Turkey Coffee Color Meters Revenue (undefined) Forecast, by Application 2020 & 2033
- Table 62: Turkey Coffee Color Meters Volume (K) Forecast, by Application 2020 & 2033
- Table 63: Israel Coffee Color Meters Revenue (undefined) Forecast, by Application 2020 & 2033
- Table 64: Israel Coffee Color Meters Volume (K) Forecast, by Application 2020 & 2033
- Table 65: GCC Coffee Color Meters Revenue (undefined) Forecast, by Application 2020 & 2033
- Table 66: GCC Coffee Color Meters Volume (K) Forecast, by Application 2020 & 2033
- Table 67: North Africa Coffee Color Meters Revenue (undefined) Forecast, by Application 2020 & 2033
- Table 68: North Africa Coffee Color Meters Volume (K) Forecast, by Application 2020 & 2033
- Table 69: South Africa Coffee Color Meters Revenue (undefined) Forecast, by Application 2020 & 2033
- Table 70: South Africa Coffee Color Meters Volume (K) Forecast, by Application 2020 & 2033
- Table 71: Rest of Middle East & Africa Coffee Color Meters Revenue (undefined) Forecast, by Application 2020 & 2033
- Table 72: Rest of Middle East & Africa Coffee Color Meters Volume (K) Forecast, by Application 2020 & 2033
- Table 73: Global Coffee Color Meters Revenue undefined Forecast, by Application 2020 & 2033
- Table 74: Global Coffee Color Meters Volume K Forecast, by Application 2020 & 2033
- Table 75: Global Coffee Color Meters Revenue undefined Forecast, by Types 2020 & 2033
- Table 76: Global Coffee Color Meters Volume K Forecast, by Types 2020 & 2033
- Table 77: Global Coffee Color Meters Revenue undefined Forecast, by Country 2020 & 2033
- Table 78: Global Coffee Color Meters Volume K Forecast, by Country 2020 & 2033
- Table 79: China Coffee Color Meters Revenue (undefined) Forecast, by Application 2020 & 2033
- Table 80: China Coffee Color Meters Volume (K) Forecast, by Application 2020 & 2033
- Table 81: India Coffee Color Meters Revenue (undefined) Forecast, by Application 2020 & 2033
- Table 82: India Coffee Color Meters Volume (K) Forecast, by Application 2020 & 2033
- Table 83: Japan Coffee Color Meters Revenue (undefined) Forecast, by Application 2020 & 2033
- Table 84: Japan Coffee Color Meters Volume (K) Forecast, by Application 2020 & 2033
- Table 85: South Korea Coffee Color Meters Revenue (undefined) Forecast, by Application 2020 & 2033
- Table 86: South Korea Coffee Color Meters Volume (K) Forecast, by Application 2020 & 2033
- Table 87: ASEAN Coffee Color Meters Revenue (undefined) Forecast, by Application 2020 & 2033
- Table 88: ASEAN Coffee Color Meters Volume (K) Forecast, by Application 2020 & 2033
- Table 89: Oceania Coffee Color Meters Revenue (undefined) Forecast, by Application 2020 & 2033
- Table 90: Oceania Coffee Color Meters Volume (K) Forecast, by Application 2020 & 2033
- Table 91: Rest of Asia Pacific Coffee Color Meters Revenue (undefined) Forecast, by Application 2020 & 2033
- Table 92: Rest of Asia Pacific Coffee Color Meters Volume (K) Forecast, by Application 2020 & 2033
Frequently Asked Questions
1. What is the projected Compound Annual Growth Rate (CAGR) of the Coffee Color Meters?
The projected CAGR is approximately 7%.
2. Which companies are prominent players in the Coffee Color Meters?
Key companies in the market include Agtron, Konica Minolta, Roami, Lighttells, RoastRite, Syncfo, Javalytics, Dipper, Tonino.
3. What are the main segments of the Coffee Color Meters?
The market segments include Application, Types.
4. Can you provide details about the market size?
The market size is estimated to be USD XXX N/A as of 2022.
5. What are some drivers contributing to market growth?
N/A
6. What are the notable trends driving market growth?
N/A
7. Are there any restraints impacting market growth?
N/A
8. Can you provide examples of recent developments in the market?
N/A
9. What pricing options are available for accessing the report?
Pricing options include single-user, multi-user, and enterprise licenses priced at USD 3350.00, USD 5025.00, and USD 6700.00 respectively.
10. Is the market size provided in terms of value or volume?
The market size is provided in terms of value, measured in N/A and volume, measured in K.
11. Are there any specific market keywords associated with the report?
Yes, the market keyword associated with the report is "Coffee Color Meters," which aids in identifying and referencing the specific market segment covered.
12. How do I determine which pricing option suits my needs best?
The pricing options vary based on user requirements and access needs. Individual users may opt for single-user licenses, while businesses requiring broader access may choose multi-user or enterprise licenses for cost-effective access to the report.
13. Are there any additional resources or data provided in the Coffee Color Meters report?
While the report offers comprehensive insights, it's advisable to review the specific contents or supplementary materials provided to ascertain if additional resources or data are available.
14. How can I stay updated on further developments or reports in the Coffee Color Meters?
To stay informed about further developments, trends, and reports in the Coffee Color Meters, consider subscribing to industry newsletters, following relevant companies and organizations, or regularly checking reputable industry news sources and publications.
Methodology
Step 1 - Identification of Relevant Samples Size from Population Database


Step 2 - Approaches for Defining Global Market Size (Value, Volume* & Price*)

Note*: In applicable scenarios
Step 3 - Data Sources
Primary Research
- Web Analytics
- Survey Reports
- Research Institute
- Latest Research Reports
- Opinion Leaders
Secondary Research
- Annual Reports
- White Paper
- Latest Press Release
- Industry Association
- Paid Database
- Investor Presentations

Step 4 - Data Triangulation
Involves using different sources of information in order to increase the validity of a study
These sources are likely to be stakeholders in a program - participants, other researchers, program staff, other community members, and so on.
Then we put all data in single framework & apply various statistical tools to find out the dynamic on the market.
During the analysis stage, feedback from the stakeholder groups would be compared to determine areas of agreement as well as areas of divergence