
Key Insights
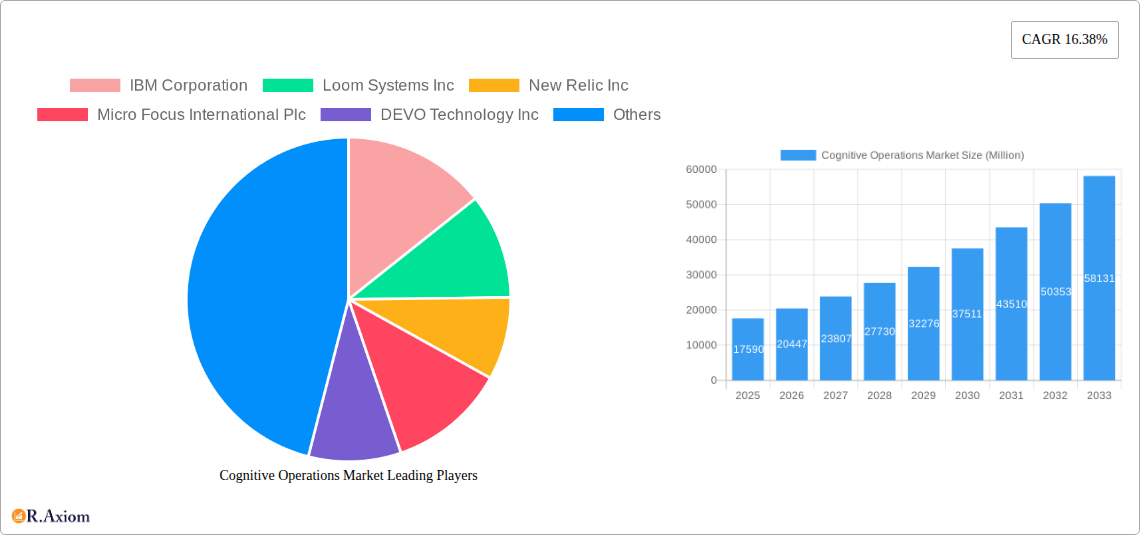
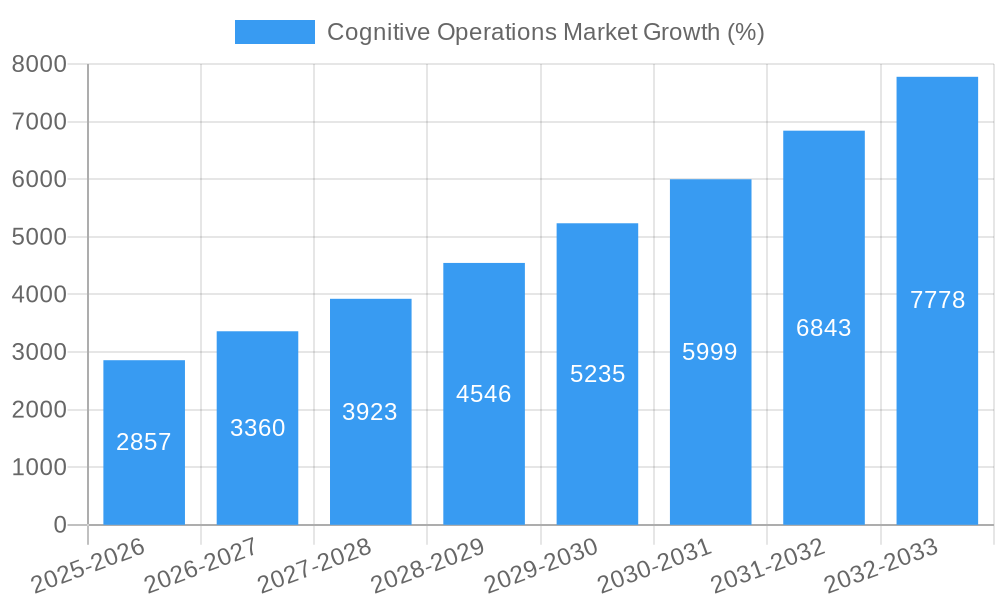
The Cognitive Operations market, valued at $17.59 billion in 2025, is experiencing robust growth, projected to expand at a Compound Annual Growth Rate (CAGR) of 16.38% from 2025 to 2033. This significant expansion is driven by several key factors. The increasing complexity of IT infrastructure, coupled with the rising volume of operational data, necessitates intelligent automation and predictive analytics to maintain efficiency and minimize downtime. Businesses across various sectors, particularly BFSI, Healthcare & Life Sciences, and IT & Telecom, are increasingly adopting cognitive operations solutions to enhance IT operations analytics, application performance management, and security analytics. The shift towards cloud-based deployments further fuels market growth, offering scalability, flexibility, and cost-effectiveness. The market is segmented by component (solutions and services), deployment mode (cloud and on-premises), enterprise size (large and small/medium enterprises), application (IT operations analytics, application performance management, network analytics, security analytics, infrastructure management, and other applications), and industry vertical. Competition is fierce, with established players like IBM, Splunk, and Micro Focus alongside emerging innovators such as Loom Systems and Devo Technology vying for market share. The market's future growth hinges on continued technological advancements, the expanding adoption of AI and machine learning in IT operations, and the increasing demand for proactive and intelligent IT management across diverse industries.
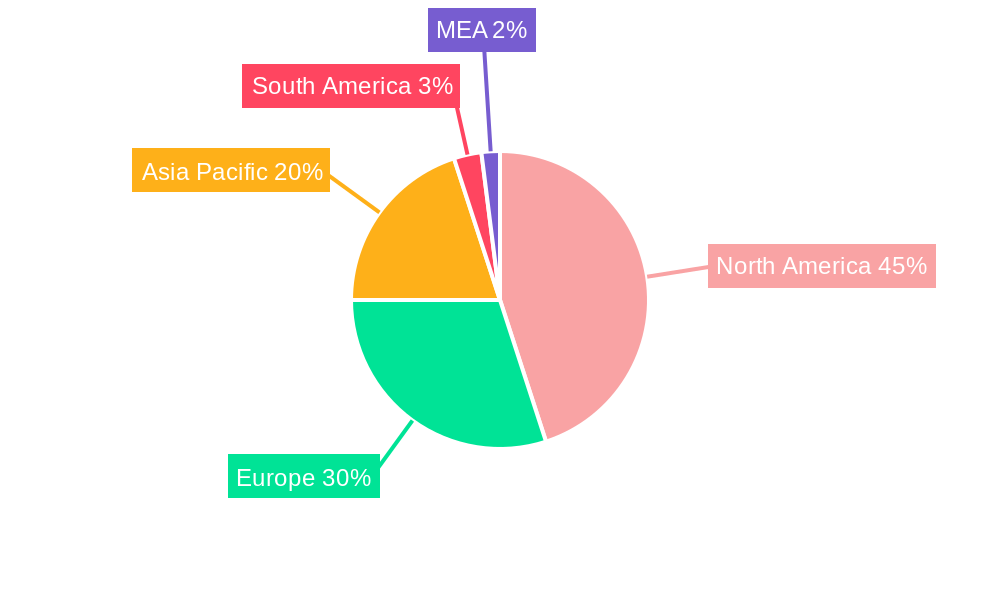
The North American market currently holds a substantial share, driven by early adoption and a mature technological landscape. However, the Asia-Pacific region is anticipated to witness the fastest growth, fueled by rapid digital transformation and increasing investments in IT infrastructure across countries like India and China. The European market is also exhibiting steady growth, driven by increasing regulatory compliance requirements and the adoption of cloud-based solutions. Continued innovation in areas like AIOps (Artificial Intelligence for IT Operations) and the development of more sophisticated analytics platforms will be crucial factors shaping the competitive landscape and influencing the overall market trajectory. The increasing focus on proactive problem resolution and improved operational efficiency will continue to propel the demand for cognitive operations solutions throughout the forecast period.
Cognitive Operations Market: A Comprehensive Report (2019-2033)
This in-depth report provides a comprehensive analysis of the Cognitive Operations Market, offering invaluable insights for industry stakeholders, investors, and businesses seeking to navigate this rapidly evolving landscape. The study covers the period from 2019 to 2033, with 2025 serving as the base and estimated year. The report projects market growth from 2025 to 2033 and analyzes historical data from 2019 to 2024. Key market segments, including solutions, services, deployment modes, enterprise sizes, applications, and industry verticals, are meticulously examined. Leading players like IBM, Splunk, and others are profiled, revealing their market strategies and competitive positioning.
Cognitive Operations Market Market Concentration & Innovation
The Cognitive Operations market is characterized by a moderately concentrated competitive landscape, with a few key players holding significant market share. However, the market also exhibits considerable dynamism due to ongoing innovation and the entry of new players. The market share of the top 5 companies in 2024 was estimated at xx%, indicating room for both consolidation and expansion. M&A activity has been moderate, with a total deal value of approximately $xx Million in 2024, driven by strategic acquisitions aimed at expanding product portfolios and geographical reach. Several factors fuel innovation, including the increasing adoption of AI, machine learning, and big data analytics within IT operations. Regulatory frameworks, while not overly restrictive, are evolving to address data privacy and security concerns, particularly around the use of AI in operations. Product substitutes, primarily traditional IT management solutions, are facing decreasing market penetration due to the efficiency and scalability of cognitive solutions. End-user trends indicate a strong preference for cloud-based solutions and the increasing demand for integrated platforms that can handle multiple operational aspects.
Key Market Drivers for Innovation:
- Advancements in Artificial Intelligence (AI) and Machine Learning (ML)
- Growing adoption of cloud computing and big data analytics
- Increasing demand for automation and improved operational efficiency
- Stringent regulatory compliance requirements
M&A Activity (2024):
- Total Deal Value: Approximately $xx Million
- Number of Deals: xx
- Average Deal Value: $xx Million
Cognitive Operations Market Industry Trends & Insights
The Cognitive Operations market is experiencing robust growth, fueled by several key factors. The market's compound annual growth rate (CAGR) is projected to be xx% during the forecast period (2025-2033). This growth is primarily driven by the rising adoption of cloud-based solutions, increasing digital transformation initiatives across various industries, and the need for proactive and intelligent IT operations management. Technological disruptions, such as the emergence of advanced AI algorithms and the growing sophistication of big data analytics, are significantly impacting the market landscape. Consumer preferences are shifting towards solutions that provide real-time insights, enhanced automation capabilities, and improved operational efficiency. The competitive dynamics are intensifying, with established players investing heavily in R&D and new entrants seeking to disrupt the market with innovative offerings. Market penetration of cognitive operations solutions is steadily increasing across various industries, with a projected xx% penetration rate by 2033.
Dominant Markets & Segments in Cognitive Operations Market
The North American region holds a dominant position in the Cognitive Operations market, driven by factors such as high technological adoption rates, a robust IT infrastructure, and the presence of major technology companies. Within this region, the United States currently represents the largest market. The growth in the North American region is being driven by:
- High Technological Adoption Rates: Early adoption of new technologies, including AI and cloud computing.
- Robust IT Infrastructure: Well-established IT infrastructure, supporting the deployment of advanced solutions.
- Presence of Major Technology Companies: A hub for many leading Cognitive Operations vendors and developers.
- Large Enterprises: Significant investments in IT modernization and digital transformation by large enterprises.
Segment Analysis:
- By Component: The solutions segment is projected to dominate, with a market size of $xx Million in 2025, driven by the increasing demand for comprehensive cognitive operations platforms. Services are also a key contributor, expected to reach $xx Million in 2025, supporting implementation, integration, and ongoing maintenance.
- By Deployment Mode: Cloud deployments are expected to maintain their dominance, fueled by scalability, cost-effectiveness, and accessibility.
- By Enterprise Size: Large enterprises currently represent the largest segment due to their significant IT budgets and complex operational requirements, however, the SME segment is projected for significant growth driven by increasing cloud adoption and the availability of cost-effective solutions.
- By Application: IT Operations Analytics and Application Performance Management currently hold the largest market share, with a combined value of $xx Million in 2025, but the market for Network and Security Analytics is showing a high growth rate.
- By Industry Vertical: BFSI and IT & Telecom sectors are leading adopters, with strong demand for solutions to enhance security, improve customer experience, and optimize operational efficiency.
Cognitive Operations Market Product Developments
Recent product innovations focus on integrating AI, ML, and big data analytics into existing IT operations management platforms. New solutions offer advanced capabilities like predictive analytics, automated incident response, and enhanced security monitoring. These developments cater to the growing demand for proactive and autonomous operations management, leading to improved efficiency and reduced operational costs. The market is witnessing the emergence of specialized solutions for specific industry verticals, such as healthcare and finance, providing tailored capabilities to address their unique needs. Key competitive advantages lie in the ability to provide real-time insights, seamless integration with existing infrastructure, and robust security features.
Report Scope & Segmentation Analysis
This report comprehensively analyzes the Cognitive Operations market across various segments:
- By Component: Solutions and Services. The solutions segment is projected to grow at a CAGR of xx% from 2025 to 2033, while the services segment is expected to grow at a CAGR of xx%.
- By Deployment Mode: Cloud and On-premises. Cloud deployment is anticipated to dominate, driven by scalability and accessibility.
- By Enterprise Size: Large Enterprises and Small and Medium-Sized Enterprises (SMEs). Large enterprises represent a significant market share, but the SME segment shows strong growth potential.
- By Application: IT Operations Analytics, Application Performance Management, Network Analytics, Security Analytics, Infrastructure Management, and Other Applications. Each application segment showcases unique growth drivers and competitive dynamics.
- By Industry Vertical: BFSI, Healthcare & Life Sciences, IT & Telecom, Retail & E-commerce, and Other Industry Verticals. BFSI and IT & Telecom lead in adoption but other verticals show increasing interest.
Key Drivers of Cognitive Operations Market Growth
Several factors contribute to the growth of the Cognitive Operations market: the increasing complexity of IT infrastructure, coupled with the need for greater operational efficiency and automation, is a significant driver. The rising adoption of cloud computing and big data analytics provides the foundation for the implementation of cognitive operations solutions. Furthermore, stringent regulatory compliance requirements and the escalating need for enhanced security are pushing organizations towards adopting these advanced technologies. Finally, advancements in artificial intelligence (AI) and machine learning (ML) are constantly improving the capabilities and effectiveness of cognitive operations platforms.
Challenges in the Cognitive Operations Market Sector
The Cognitive Operations market faces challenges such as the high initial investment costs associated with implementing these solutions. The complexity of integrating cognitive operations platforms with existing IT infrastructure can also hinder adoption. Furthermore, a shortage of skilled professionals with expertise in AI and data analytics can pose a barrier to effective implementation. Finally, concerns about data security and privacy are important factors influencing customer decisions. These challenges, while significant, are being addressed through innovation, partnerships, and the availability of managed services.
Emerging Opportunities in Cognitive Operations Market
The Cognitive Operations market presents significant opportunities. The expanding adoption of 5G technology creates a need for sophisticated network analytics solutions. The rise of edge computing creates opportunities for real-time data processing and analysis at the network edge. Furthermore, the increasing use of IoT devices generates massive amounts of data, requiring advanced cognitive operations platforms to manage and analyze this data effectively. Finally, the growing adoption of AI-powered automation promises to optimize IT operations further.
Leading Players in the Cognitive Operations Market Market
- IBM Corporation (IBM)
- Loom Systems Inc
- New Relic Inc (New Relic)
- Micro Focus International Plc (Micro Focus)
- DEVO Technology Inc
- Broadcom Inc (Broadcom)
- ScienceLogic Inc (ScienceLogic)
- CloudFabrix Software Inc
- BMC Software Inc (BMC Software)
- Correlata Solutions Inc
- Servicenow Inc (ServiceNow)
- Interlink Software Services Ltd
- VMware Inc (VMware)
- Splunk Inc (Splunk)
- Dynatrace LLC (Dynatrace)
- HCL Technologies Limited (HCL Technologies)
Key Developments in Cognitive Operations Market Industry
March 2023: TCS launched its Cognitive Plant Operations Adviser, leveraging AI and ML to improve manufacturing efficiency and resilience across various industries. This launch signifies the growing importance of AI-driven solutions in optimizing industrial operations.
October 2022: Saudi Telecom Company (STC) partnered with Ericsson to deploy AI-based cognitive software for network optimization. This collaboration highlights the role of cognitive solutions in enhancing network performance and subscriber experience.
Strategic Outlook for Cognitive Operations Market Market
The Cognitive Operations market is poised for continued strong growth, driven by the increasing adoption of cloud-based solutions, the growing demand for automation, and the ongoing advancements in AI and big data analytics. The market will continue to witness significant innovation, with new solutions emerging to address the evolving needs of organizations across diverse industries. The focus on enhancing security, improving operational efficiency, and delivering real-time insights will remain key drivers of market growth. The market holds significant potential for expansion into new verticals and geographies, offering exciting opportunities for both established players and new entrants.
Cognitive Operations Market Segmentation
-
1. Component
- 1.1. Solutions
- 1.2. Services
-
2. Deployment Mode
- 2.1. Cloud
- 2.2. On-Premises
-
3. Enterprise Size
- 3.1. Large Enterprises
- 3.2. Small and Medium-Sized Enterprises
-
4. Application
- 4.1. IT Operations Analytics
- 4.2. Application Performance Management
- 4.3. Network Analytics
- 4.4. Security Analytics
- 4.5. Infrastructure Management
- 4.6. Other Applications
-
5. Industry Vertical
- 5.1. BFSI
- 5.2. Healthcare & Life Sciences
- 5.3. IT & Telecom
- 5.4. Retail & E-commerce
- 5.5. Other Industry Verticals
Cognitive Operations Market Segmentation By Geography
- 1. North America
- 2. Europe
- 3. Asia Pacific
- 4. Rest of the World
Cognitive Operations Market REPORT HIGHLIGHTS
| Aspects | Details |
|---|---|
| Study Period | 2019-2033 |
| Base Year | 2024 |
| Estimated Year | 2025 |
| Forecast Period | 2025-2033 |
| Historical Period | 2019-2024 |
| Growth Rate | CAGR of 16.38% from 2019-2033 |
| Segmentation |
|
Table of Contents
- 1. Introduction
- 1.1. Research Scope
- 1.2. Market Segmentation
- 1.3. Research Methodology
- 1.4. Definitions and Assumptions
- 2. Executive Summary
- 2.1. Introduction
- 3. Market Dynamics
- 3.1. Introduction
- 3.2. Market Drivers
- 3.2.1. Growing Focus Toward Selection of Cloud-Based Cognitive IT Operations Solutions; Rising Demand for Monitoring the Complex IT Environment
- 3.3. Market Restrains
- 3.3.1. Integration of Cognitive Operations Capabilities With the Present Systems; Dearth of Skills and Expertise
- 3.4. Market Trends
- 3.4.1. IT and Telecommunication Segment to Grow Significantly
- 4. Market Factor Analysis
- 4.1. Porters Five Forces
- 4.2. Supply/Value Chain
- 4.3. PESTEL analysis
- 4.4. Market Entropy
- 4.5. Patent/Trademark Analysis
- 5. Global Cognitive Operations Market Analysis, Insights and Forecast, 2019-2031
- 5.1. Market Analysis, Insights and Forecast - by Component
- 5.1.1. Solutions
- 5.1.2. Services
- 5.2. Market Analysis, Insights and Forecast - by Deployment Mode
- 5.2.1. Cloud
- 5.2.2. On-Premises
- 5.3. Market Analysis, Insights and Forecast - by Enterprise Size
- 5.3.1. Large Enterprises
- 5.3.2. Small and Medium-Sized Enterprises
- 5.4. Market Analysis, Insights and Forecast - by Application
- 5.4.1. IT Operations Analytics
- 5.4.2. Application Performance Management
- 5.4.3. Network Analytics
- 5.4.4. Security Analytics
- 5.4.5. Infrastructure Management
- 5.4.6. Other Applications
- 5.5. Market Analysis, Insights and Forecast - by Industry Vertical
- 5.5.1. BFSI
- 5.5.2. Healthcare & Life Sciences
- 5.5.3. IT & Telecom
- 5.5.4. Retail & E-commerce
- 5.5.5. Other Industry Verticals
- 5.6. Market Analysis, Insights and Forecast - by Region
- 5.6.1. North America
- 5.6.2. Europe
- 5.6.3. Asia Pacific
- 5.6.4. Rest of the World
- 5.1. Market Analysis, Insights and Forecast - by Component
- 6. North America Cognitive Operations Market Analysis, Insights and Forecast, 2019-2031
- 6.1. Market Analysis, Insights and Forecast - by Component
- 6.1.1. Solutions
- 6.1.2. Services
- 6.2. Market Analysis, Insights and Forecast - by Deployment Mode
- 6.2.1. Cloud
- 6.2.2. On-Premises
- 6.3. Market Analysis, Insights and Forecast - by Enterprise Size
- 6.3.1. Large Enterprises
- 6.3.2. Small and Medium-Sized Enterprises
- 6.4. Market Analysis, Insights and Forecast - by Application
- 6.4.1. IT Operations Analytics
- 6.4.2. Application Performance Management
- 6.4.3. Network Analytics
- 6.4.4. Security Analytics
- 6.4.5. Infrastructure Management
- 6.4.6. Other Applications
- 6.5. Market Analysis, Insights and Forecast - by Industry Vertical
- 6.5.1. BFSI
- 6.5.2. Healthcare & Life Sciences
- 6.5.3. IT & Telecom
- 6.5.4. Retail & E-commerce
- 6.5.5. Other Industry Verticals
- 6.1. Market Analysis, Insights and Forecast - by Component
- 7. Europe Cognitive Operations Market Analysis, Insights and Forecast, 2019-2031
- 7.1. Market Analysis, Insights and Forecast - by Component
- 7.1.1. Solutions
- 7.1.2. Services
- 7.2. Market Analysis, Insights and Forecast - by Deployment Mode
- 7.2.1. Cloud
- 7.2.2. On-Premises
- 7.3. Market Analysis, Insights and Forecast - by Enterprise Size
- 7.3.1. Large Enterprises
- 7.3.2. Small and Medium-Sized Enterprises
- 7.4. Market Analysis, Insights and Forecast - by Application
- 7.4.1. IT Operations Analytics
- 7.4.2. Application Performance Management
- 7.4.3. Network Analytics
- 7.4.4. Security Analytics
- 7.4.5. Infrastructure Management
- 7.4.6. Other Applications
- 7.5. Market Analysis, Insights and Forecast - by Industry Vertical
- 7.5.1. BFSI
- 7.5.2. Healthcare & Life Sciences
- 7.5.3. IT & Telecom
- 7.5.4. Retail & E-commerce
- 7.5.5. Other Industry Verticals
- 7.1. Market Analysis, Insights and Forecast - by Component
- 8. Asia Pacific Cognitive Operations Market Analysis, Insights and Forecast, 2019-2031
- 8.1. Market Analysis, Insights and Forecast - by Component
- 8.1.1. Solutions
- 8.1.2. Services
- 8.2. Market Analysis, Insights and Forecast - by Deployment Mode
- 8.2.1. Cloud
- 8.2.2. On-Premises
- 8.3. Market Analysis, Insights and Forecast - by Enterprise Size
- 8.3.1. Large Enterprises
- 8.3.2. Small and Medium-Sized Enterprises
- 8.4. Market Analysis, Insights and Forecast - by Application
- 8.4.1. IT Operations Analytics
- 8.4.2. Application Performance Management
- 8.4.3. Network Analytics
- 8.4.4. Security Analytics
- 8.4.5. Infrastructure Management
- 8.4.6. Other Applications
- 8.5. Market Analysis, Insights and Forecast - by Industry Vertical
- 8.5.1. BFSI
- 8.5.2. Healthcare & Life Sciences
- 8.5.3. IT & Telecom
- 8.5.4. Retail & E-commerce
- 8.5.5. Other Industry Verticals
- 8.1. Market Analysis, Insights and Forecast - by Component
- 9. Rest of the World Cognitive Operations Market Analysis, Insights and Forecast, 2019-2031
- 9.1. Market Analysis, Insights and Forecast - by Component
- 9.1.1. Solutions
- 9.1.2. Services
- 9.2. Market Analysis, Insights and Forecast - by Deployment Mode
- 9.2.1. Cloud
- 9.2.2. On-Premises
- 9.3. Market Analysis, Insights and Forecast - by Enterprise Size
- 9.3.1. Large Enterprises
- 9.3.2. Small and Medium-Sized Enterprises
- 9.4. Market Analysis, Insights and Forecast - by Application
- 9.4.1. IT Operations Analytics
- 9.4.2. Application Performance Management
- 9.4.3. Network Analytics
- 9.4.4. Security Analytics
- 9.4.5. Infrastructure Management
- 9.4.6. Other Applications
- 9.5. Market Analysis, Insights and Forecast - by Industry Vertical
- 9.5.1. BFSI
- 9.5.2. Healthcare & Life Sciences
- 9.5.3. IT & Telecom
- 9.5.4. Retail & E-commerce
- 9.5.5. Other Industry Verticals
- 9.1. Market Analysis, Insights and Forecast - by Component
- 10. North America Cognitive Operations Market Analysis, Insights and Forecast, 2019-2031
- 10.1. Market Analysis, Insights and Forecast - By Country/Sub-region
- 10.1.1 United States
- 10.1.2 Canada
- 10.1.3 Mexico
- 11. Europe Cognitive Operations Market Analysis, Insights and Forecast, 2019-2031
- 11.1. Market Analysis, Insights and Forecast - By Country/Sub-region
- 11.1.1 Germany
- 11.1.2 United Kingdom
- 11.1.3 France
- 11.1.4 Spain
- 11.1.5 Italy
- 11.1.6 Spain
- 11.1.7 Belgium
- 11.1.8 Netherland
- 11.1.9 Nordics
- 11.1.10 Rest of Europe
- 12. Asia Pacific Cognitive Operations Market Analysis, Insights and Forecast, 2019-2031
- 12.1. Market Analysis, Insights and Forecast - By Country/Sub-region
- 12.1.1 China
- 12.1.2 Japan
- 12.1.3 India
- 12.1.4 South Korea
- 12.1.5 Southeast Asia
- 12.1.6 Australia
- 12.1.7 Indonesia
- 12.1.8 Phillipes
- 12.1.9 Singapore
- 12.1.10 Thailandc
- 12.1.11 Rest of Asia Pacific
- 13. South America Cognitive Operations Market Analysis, Insights and Forecast, 2019-2031
- 13.1. Market Analysis, Insights and Forecast - By Country/Sub-region
- 13.1.1 Brazil
- 13.1.2 Argentina
- 13.1.3 Peru
- 13.1.4 Chile
- 13.1.5 Colombia
- 13.1.6 Ecuador
- 13.1.7 Venezuela
- 13.1.8 Rest of South America
- 14. North America Cognitive Operations Market Analysis, Insights and Forecast, 2019-2031
- 14.1. Market Analysis, Insights and Forecast - By Country/Sub-region
- 14.1.1 United States
- 14.1.2 Canada
- 14.1.3 Mexico
- 15. MEA Cognitive Operations Market Analysis, Insights and Forecast, 2019-2031
- 15.1. Market Analysis, Insights and Forecast - By Country/Sub-region
- 15.1.1 United Arab Emirates
- 15.1.2 Saudi Arabia
- 15.1.3 South Africa
- 15.1.4 Rest of Middle East and Africa
- 16. Competitive Analysis
- 16.1. Global Market Share Analysis 2024
- 16.2. Company Profiles
- 16.2.1 IBM Corporation
- 16.2.1.1. Overview
- 16.2.1.2. Products
- 16.2.1.3. SWOT Analysis
- 16.2.1.4. Recent Developments
- 16.2.1.5. Financials (Based on Availability)
- 16.2.2 Loom Systems Inc
- 16.2.2.1. Overview
- 16.2.2.2. Products
- 16.2.2.3. SWOT Analysis
- 16.2.2.4. Recent Developments
- 16.2.2.5. Financials (Based on Availability)
- 16.2.3 New Relic Inc
- 16.2.3.1. Overview
- 16.2.3.2. Products
- 16.2.3.3. SWOT Analysis
- 16.2.3.4. Recent Developments
- 16.2.3.5. Financials (Based on Availability)
- 16.2.4 Micro Focus International Plc
- 16.2.4.1. Overview
- 16.2.4.2. Products
- 16.2.4.3. SWOT Analysis
- 16.2.4.4. Recent Developments
- 16.2.4.5. Financials (Based on Availability)
- 16.2.5 DEVO Technology Inc
- 16.2.5.1. Overview
- 16.2.5.2. Products
- 16.2.5.3. SWOT Analysis
- 16.2.5.4. Recent Developments
- 16.2.5.5. Financials (Based on Availability)
- 16.2.6 Broadcom Inc
- 16.2.6.1. Overview
- 16.2.6.2. Products
- 16.2.6.3. SWOT Analysis
- 16.2.6.4. Recent Developments
- 16.2.6.5. Financials (Based on Availability)
- 16.2.7 ScienceLogic Inc
- 16.2.7.1. Overview
- 16.2.7.2. Products
- 16.2.7.3. SWOT Analysis
- 16.2.7.4. Recent Developments
- 16.2.7.5. Financials (Based on Availability)
- 16.2.8 CloudFabrix Software Inc
- 16.2.8.1. Overview
- 16.2.8.2. Products
- 16.2.8.3. SWOT Analysis
- 16.2.8.4. Recent Developments
- 16.2.8.5. Financials (Based on Availability)
- 16.2.9 BMC Software Inc
- 16.2.9.1. Overview
- 16.2.9.2. Products
- 16.2.9.3. SWOT Analysis
- 16.2.9.4. Recent Developments
- 16.2.9.5. Financials (Based on Availability)
- 16.2.10 Correlata Solutions Inc
- 16.2.10.1. Overview
- 16.2.10.2. Products
- 16.2.10.3. SWOT Analysis
- 16.2.10.4. Recent Developments
- 16.2.10.5. Financials (Based on Availability)
- 16.2.11 Servicenow Inc
- 16.2.11.1. Overview
- 16.2.11.2. Products
- 16.2.11.3. SWOT Analysis
- 16.2.11.4. Recent Developments
- 16.2.11.5. Financials (Based on Availability)
- 16.2.12 Interlink Software Services Ltd
- 16.2.12.1. Overview
- 16.2.12.2. Products
- 16.2.12.3. SWOT Analysis
- 16.2.12.4. Recent Developments
- 16.2.12.5. Financials (Based on Availability)
- 16.2.13 VMware Inc
- 16.2.13.1. Overview
- 16.2.13.2. Products
- 16.2.13.3. SWOT Analysis
- 16.2.13.4. Recent Developments
- 16.2.13.5. Financials (Based on Availability)
- 16.2.14 Splunk Inc
- 16.2.14.1. Overview
- 16.2.14.2. Products
- 16.2.14.3. SWOT Analysis
- 16.2.14.4. Recent Developments
- 16.2.14.5. Financials (Based on Availability)
- 16.2.15 Dynatrace LLC
- 16.2.15.1. Overview
- 16.2.15.2. Products
- 16.2.15.3. SWOT Analysis
- 16.2.15.4. Recent Developments
- 16.2.15.5. Financials (Based on Availability)
- 16.2.16 HCL Technologies Limited
- 16.2.16.1. Overview
- 16.2.16.2. Products
- 16.2.16.3. SWOT Analysis
- 16.2.16.4. Recent Developments
- 16.2.16.5. Financials (Based on Availability)
- 16.2.1 IBM Corporation
List of Figures
- Figure 1: Global Cognitive Operations Market Revenue Breakdown (Million, %) by Region 2024 & 2032
- Figure 2: North America Cognitive Operations Market Revenue (Million), by Country 2024 & 2032
- Figure 3: North America Cognitive Operations Market Revenue Share (%), by Country 2024 & 2032
- Figure 4: Europe Cognitive Operations Market Revenue (Million), by Country 2024 & 2032
- Figure 5: Europe Cognitive Operations Market Revenue Share (%), by Country 2024 & 2032
- Figure 6: Asia Pacific Cognitive Operations Market Revenue (Million), by Country 2024 & 2032
- Figure 7: Asia Pacific Cognitive Operations Market Revenue Share (%), by Country 2024 & 2032
- Figure 8: South America Cognitive Operations Market Revenue (Million), by Country 2024 & 2032
- Figure 9: South America Cognitive Operations Market Revenue Share (%), by Country 2024 & 2032
- Figure 10: North America Cognitive Operations Market Revenue (Million), by Country 2024 & 2032
- Figure 11: North America Cognitive Operations Market Revenue Share (%), by Country 2024 & 2032
- Figure 12: MEA Cognitive Operations Market Revenue (Million), by Country 2024 & 2032
- Figure 13: MEA Cognitive Operations Market Revenue Share (%), by Country 2024 & 2032
- Figure 14: North America Cognitive Operations Market Revenue (Million), by Component 2024 & 2032
- Figure 15: North America Cognitive Operations Market Revenue Share (%), by Component 2024 & 2032
- Figure 16: North America Cognitive Operations Market Revenue (Million), by Deployment Mode 2024 & 2032
- Figure 17: North America Cognitive Operations Market Revenue Share (%), by Deployment Mode 2024 & 2032
- Figure 18: North America Cognitive Operations Market Revenue (Million), by Enterprise Size 2024 & 2032
- Figure 19: North America Cognitive Operations Market Revenue Share (%), by Enterprise Size 2024 & 2032
- Figure 20: North America Cognitive Operations Market Revenue (Million), by Application 2024 & 2032
- Figure 21: North America Cognitive Operations Market Revenue Share (%), by Application 2024 & 2032
- Figure 22: North America Cognitive Operations Market Revenue (Million), by Industry Vertical 2024 & 2032
- Figure 23: North America Cognitive Operations Market Revenue Share (%), by Industry Vertical 2024 & 2032
- Figure 24: North America Cognitive Operations Market Revenue (Million), by Country 2024 & 2032
- Figure 25: North America Cognitive Operations Market Revenue Share (%), by Country 2024 & 2032
- Figure 26: Europe Cognitive Operations Market Revenue (Million), by Component 2024 & 2032
- Figure 27: Europe Cognitive Operations Market Revenue Share (%), by Component 2024 & 2032
- Figure 28: Europe Cognitive Operations Market Revenue (Million), by Deployment Mode 2024 & 2032
- Figure 29: Europe Cognitive Operations Market Revenue Share (%), by Deployment Mode 2024 & 2032
- Figure 30: Europe Cognitive Operations Market Revenue (Million), by Enterprise Size 2024 & 2032
- Figure 31: Europe Cognitive Operations Market Revenue Share (%), by Enterprise Size 2024 & 2032
- Figure 32: Europe Cognitive Operations Market Revenue (Million), by Application 2024 & 2032
- Figure 33: Europe Cognitive Operations Market Revenue Share (%), by Application 2024 & 2032
- Figure 34: Europe Cognitive Operations Market Revenue (Million), by Industry Vertical 2024 & 2032
- Figure 35: Europe Cognitive Operations Market Revenue Share (%), by Industry Vertical 2024 & 2032
- Figure 36: Europe Cognitive Operations Market Revenue (Million), by Country 2024 & 2032
- Figure 37: Europe Cognitive Operations Market Revenue Share (%), by Country 2024 & 2032
- Figure 38: Asia Pacific Cognitive Operations Market Revenue (Million), by Component 2024 & 2032
- Figure 39: Asia Pacific Cognitive Operations Market Revenue Share (%), by Component 2024 & 2032
- Figure 40: Asia Pacific Cognitive Operations Market Revenue (Million), by Deployment Mode 2024 & 2032
- Figure 41: Asia Pacific Cognitive Operations Market Revenue Share (%), by Deployment Mode 2024 & 2032
- Figure 42: Asia Pacific Cognitive Operations Market Revenue (Million), by Enterprise Size 2024 & 2032
- Figure 43: Asia Pacific Cognitive Operations Market Revenue Share (%), by Enterprise Size 2024 & 2032
- Figure 44: Asia Pacific Cognitive Operations Market Revenue (Million), by Application 2024 & 2032
- Figure 45: Asia Pacific Cognitive Operations Market Revenue Share (%), by Application 2024 & 2032
- Figure 46: Asia Pacific Cognitive Operations Market Revenue (Million), by Industry Vertical 2024 & 2032
- Figure 47: Asia Pacific Cognitive Operations Market Revenue Share (%), by Industry Vertical 2024 & 2032
- Figure 48: Asia Pacific Cognitive Operations Market Revenue (Million), by Country 2024 & 2032
- Figure 49: Asia Pacific Cognitive Operations Market Revenue Share (%), by Country 2024 & 2032
- Figure 50: Rest of the World Cognitive Operations Market Revenue (Million), by Component 2024 & 2032
- Figure 51: Rest of the World Cognitive Operations Market Revenue Share (%), by Component 2024 & 2032
- Figure 52: Rest of the World Cognitive Operations Market Revenue (Million), by Deployment Mode 2024 & 2032
- Figure 53: Rest of the World Cognitive Operations Market Revenue Share (%), by Deployment Mode 2024 & 2032
- Figure 54: Rest of the World Cognitive Operations Market Revenue (Million), by Enterprise Size 2024 & 2032
- Figure 55: Rest of the World Cognitive Operations Market Revenue Share (%), by Enterprise Size 2024 & 2032
- Figure 56: Rest of the World Cognitive Operations Market Revenue (Million), by Application 2024 & 2032
- Figure 57: Rest of the World Cognitive Operations Market Revenue Share (%), by Application 2024 & 2032
- Figure 58: Rest of the World Cognitive Operations Market Revenue (Million), by Industry Vertical 2024 & 2032
- Figure 59: Rest of the World Cognitive Operations Market Revenue Share (%), by Industry Vertical 2024 & 2032
- Figure 60: Rest of the World Cognitive Operations Market Revenue (Million), by Country 2024 & 2032
- Figure 61: Rest of the World Cognitive Operations Market Revenue Share (%), by Country 2024 & 2032
List of Tables
- Table 1: Global Cognitive Operations Market Revenue Million Forecast, by Region 2019 & 2032
- Table 2: Global Cognitive Operations Market Revenue Million Forecast, by Component 2019 & 2032
- Table 3: Global Cognitive Operations Market Revenue Million Forecast, by Deployment Mode 2019 & 2032
- Table 4: Global Cognitive Operations Market Revenue Million Forecast, by Enterprise Size 2019 & 2032
- Table 5: Global Cognitive Operations Market Revenue Million Forecast, by Application 2019 & 2032
- Table 6: Global Cognitive Operations Market Revenue Million Forecast, by Industry Vertical 2019 & 2032
- Table 7: Global Cognitive Operations Market Revenue Million Forecast, by Region 2019 & 2032
- Table 8: Global Cognitive Operations Market Revenue Million Forecast, by Country 2019 & 2032
- Table 9: United States Cognitive Operations Market Revenue (Million) Forecast, by Application 2019 & 2032
- Table 10: Canada Cognitive Operations Market Revenue (Million) Forecast, by Application 2019 & 2032
- Table 11: Mexico Cognitive Operations Market Revenue (Million) Forecast, by Application 2019 & 2032
- Table 12: Global Cognitive Operations Market Revenue Million Forecast, by Country 2019 & 2032
- Table 13: Germany Cognitive Operations Market Revenue (Million) Forecast, by Application 2019 & 2032
- Table 14: United Kingdom Cognitive Operations Market Revenue (Million) Forecast, by Application 2019 & 2032
- Table 15: France Cognitive Operations Market Revenue (Million) Forecast, by Application 2019 & 2032
- Table 16: Spain Cognitive Operations Market Revenue (Million) Forecast, by Application 2019 & 2032
- Table 17: Italy Cognitive Operations Market Revenue (Million) Forecast, by Application 2019 & 2032
- Table 18: Spain Cognitive Operations Market Revenue (Million) Forecast, by Application 2019 & 2032
- Table 19: Belgium Cognitive Operations Market Revenue (Million) Forecast, by Application 2019 & 2032
- Table 20: Netherland Cognitive Operations Market Revenue (Million) Forecast, by Application 2019 & 2032
- Table 21: Nordics Cognitive Operations Market Revenue (Million) Forecast, by Application 2019 & 2032
- Table 22: Rest of Europe Cognitive Operations Market Revenue (Million) Forecast, by Application 2019 & 2032
- Table 23: Global Cognitive Operations Market Revenue Million Forecast, by Country 2019 & 2032
- Table 24: China Cognitive Operations Market Revenue (Million) Forecast, by Application 2019 & 2032
- Table 25: Japan Cognitive Operations Market Revenue (Million) Forecast, by Application 2019 & 2032
- Table 26: India Cognitive Operations Market Revenue (Million) Forecast, by Application 2019 & 2032
- Table 27: South Korea Cognitive Operations Market Revenue (Million) Forecast, by Application 2019 & 2032
- Table 28: Southeast Asia Cognitive Operations Market Revenue (Million) Forecast, by Application 2019 & 2032
- Table 29: Australia Cognitive Operations Market Revenue (Million) Forecast, by Application 2019 & 2032
- Table 30: Indonesia Cognitive Operations Market Revenue (Million) Forecast, by Application 2019 & 2032
- Table 31: Phillipes Cognitive Operations Market Revenue (Million) Forecast, by Application 2019 & 2032
- Table 32: Singapore Cognitive Operations Market Revenue (Million) Forecast, by Application 2019 & 2032
- Table 33: Thailandc Cognitive Operations Market Revenue (Million) Forecast, by Application 2019 & 2032
- Table 34: Rest of Asia Pacific Cognitive Operations Market Revenue (Million) Forecast, by Application 2019 & 2032
- Table 35: Global Cognitive Operations Market Revenue Million Forecast, by Country 2019 & 2032
- Table 36: Brazil Cognitive Operations Market Revenue (Million) Forecast, by Application 2019 & 2032
- Table 37: Argentina Cognitive Operations Market Revenue (Million) Forecast, by Application 2019 & 2032
- Table 38: Peru Cognitive Operations Market Revenue (Million) Forecast, by Application 2019 & 2032
- Table 39: Chile Cognitive Operations Market Revenue (Million) Forecast, by Application 2019 & 2032
- Table 40: Colombia Cognitive Operations Market Revenue (Million) Forecast, by Application 2019 & 2032
- Table 41: Ecuador Cognitive Operations Market Revenue (Million) Forecast, by Application 2019 & 2032
- Table 42: Venezuela Cognitive Operations Market Revenue (Million) Forecast, by Application 2019 & 2032
- Table 43: Rest of South America Cognitive Operations Market Revenue (Million) Forecast, by Application 2019 & 2032
- Table 44: Global Cognitive Operations Market Revenue Million Forecast, by Country 2019 & 2032
- Table 45: United States Cognitive Operations Market Revenue (Million) Forecast, by Application 2019 & 2032
- Table 46: Canada Cognitive Operations Market Revenue (Million) Forecast, by Application 2019 & 2032
- Table 47: Mexico Cognitive Operations Market Revenue (Million) Forecast, by Application 2019 & 2032
- Table 48: Global Cognitive Operations Market Revenue Million Forecast, by Country 2019 & 2032
- Table 49: United Arab Emirates Cognitive Operations Market Revenue (Million) Forecast, by Application 2019 & 2032
- Table 50: Saudi Arabia Cognitive Operations Market Revenue (Million) Forecast, by Application 2019 & 2032
- Table 51: South Africa Cognitive Operations Market Revenue (Million) Forecast, by Application 2019 & 2032
- Table 52: Rest of Middle East and Africa Cognitive Operations Market Revenue (Million) Forecast, by Application 2019 & 2032
- Table 53: Global Cognitive Operations Market Revenue Million Forecast, by Component 2019 & 2032
- Table 54: Global Cognitive Operations Market Revenue Million Forecast, by Deployment Mode 2019 & 2032
- Table 55: Global Cognitive Operations Market Revenue Million Forecast, by Enterprise Size 2019 & 2032
- Table 56: Global Cognitive Operations Market Revenue Million Forecast, by Application 2019 & 2032
- Table 57: Global Cognitive Operations Market Revenue Million Forecast, by Industry Vertical 2019 & 2032
- Table 58: Global Cognitive Operations Market Revenue Million Forecast, by Country 2019 & 2032
- Table 59: Global Cognitive Operations Market Revenue Million Forecast, by Component 2019 & 2032
- Table 60: Global Cognitive Operations Market Revenue Million Forecast, by Deployment Mode 2019 & 2032
- Table 61: Global Cognitive Operations Market Revenue Million Forecast, by Enterprise Size 2019 & 2032
- Table 62: Global Cognitive Operations Market Revenue Million Forecast, by Application 2019 & 2032
- Table 63: Global Cognitive Operations Market Revenue Million Forecast, by Industry Vertical 2019 & 2032
- Table 64: Global Cognitive Operations Market Revenue Million Forecast, by Country 2019 & 2032
- Table 65: Global Cognitive Operations Market Revenue Million Forecast, by Component 2019 & 2032
- Table 66: Global Cognitive Operations Market Revenue Million Forecast, by Deployment Mode 2019 & 2032
- Table 67: Global Cognitive Operations Market Revenue Million Forecast, by Enterprise Size 2019 & 2032
- Table 68: Global Cognitive Operations Market Revenue Million Forecast, by Application 2019 & 2032
- Table 69: Global Cognitive Operations Market Revenue Million Forecast, by Industry Vertical 2019 & 2032
- Table 70: Global Cognitive Operations Market Revenue Million Forecast, by Country 2019 & 2032
- Table 71: Global Cognitive Operations Market Revenue Million Forecast, by Component 2019 & 2032
- Table 72: Global Cognitive Operations Market Revenue Million Forecast, by Deployment Mode 2019 & 2032
- Table 73: Global Cognitive Operations Market Revenue Million Forecast, by Enterprise Size 2019 & 2032
- Table 74: Global Cognitive Operations Market Revenue Million Forecast, by Application 2019 & 2032
- Table 75: Global Cognitive Operations Market Revenue Million Forecast, by Industry Vertical 2019 & 2032
- Table 76: Global Cognitive Operations Market Revenue Million Forecast, by Country 2019 & 2032
Frequently Asked Questions
1. What is the projected Compound Annual Growth Rate (CAGR) of the Cognitive Operations Market?
The projected CAGR is approximately 16.38%.
2. Which companies are prominent players in the Cognitive Operations Market?
Key companies in the market include IBM Corporation, Loom Systems Inc, New Relic Inc, Micro Focus International Plc, DEVO Technology Inc, Broadcom Inc, ScienceLogic Inc, CloudFabrix Software Inc, BMC Software Inc, Correlata Solutions Inc, Servicenow Inc, Interlink Software Services Ltd, VMware Inc, Splunk Inc, Dynatrace LLC, HCL Technologies Limited.
3. What are the main segments of the Cognitive Operations Market?
The market segments include Component, Deployment Mode, Enterprise Size , Application, Industry Vertical.
4. Can you provide details about the market size?
The market size is estimated to be USD 17.59 Million as of 2022.
5. What are some drivers contributing to market growth?
Growing Focus Toward Selection of Cloud-Based Cognitive IT Operations Solutions; Rising Demand for Monitoring the Complex IT Environment.
6. What are the notable trends driving market growth?
IT and Telecommunication Segment to Grow Significantly.
7. Are there any restraints impacting market growth?
Integration of Cognitive Operations Capabilities With the Present Systems; Dearth of Skills and Expertise.
8. Can you provide examples of recent developments in the market?
March 2023: TCS Cognitive Plant Operations Adviser launched for industries in manufacturing, oil and gas, and consumer packaged goods to transform manufacturing by utilizing machine learning and artificial intelligence to make it more intelligent, flexible, and resilient. The TCS Cognitive Plant Operations Adviser connects with Microsoft Azure private mobile edge computing (PMEC) for waste reduction, increased equipment uptime, and eliminating safety problems. For quick and independent decision-making, it gives plant operators insights and data.
9. What pricing options are available for accessing the report?
Pricing options include single-user, multi-user, and enterprise licenses priced at USD 4750, USD 5250, and USD 8750 respectively.
10. Is the market size provided in terms of value or volume?
The market size is provided in terms of value, measured in Million.
11. Are there any specific market keywords associated with the report?
Yes, the market keyword associated with the report is "Cognitive Operations Market," which aids in identifying and referencing the specific market segment covered.
12. How do I determine which pricing option suits my needs best?
The pricing options vary based on user requirements and access needs. Individual users may opt for single-user licenses, while businesses requiring broader access may choose multi-user or enterprise licenses for cost-effective access to the report.
13. Are there any additional resources or data provided in the Cognitive Operations Market report?
While the report offers comprehensive insights, it's advisable to review the specific contents or supplementary materials provided to ascertain if additional resources or data are available.
14. How can I stay updated on further developments or reports in the Cognitive Operations Market?
To stay informed about further developments, trends, and reports in the Cognitive Operations Market, consider subscribing to industry newsletters, following relevant companies and organizations, or regularly checking reputable industry news sources and publications.
Methodology
Step 1 - Identification of Relevant Samples Size from Population Database


Step 2 - Approaches for Defining Global Market Size (Value, Volume* & Price*)

Note*: In applicable scenarios
Step 3 - Data Sources
Primary Research
- Web Analytics
- Survey Reports
- Research Institute
- Latest Research Reports
- Opinion Leaders
Secondary Research
- Annual Reports
- White Paper
- Latest Press Release
- Industry Association
- Paid Database
- Investor Presentations

Step 4 - Data Triangulation
Involves using different sources of information in order to increase the validity of a study
These sources are likely to be stakeholders in a program - participants, other researchers, program staff, other community members, and so on.
Then we put all data in single framework & apply various statistical tools to find out the dynamic on the market.
During the analysis stage, feedback from the stakeholder groups would be compared to determine areas of agreement as well as areas of divergence


