
Key Insights
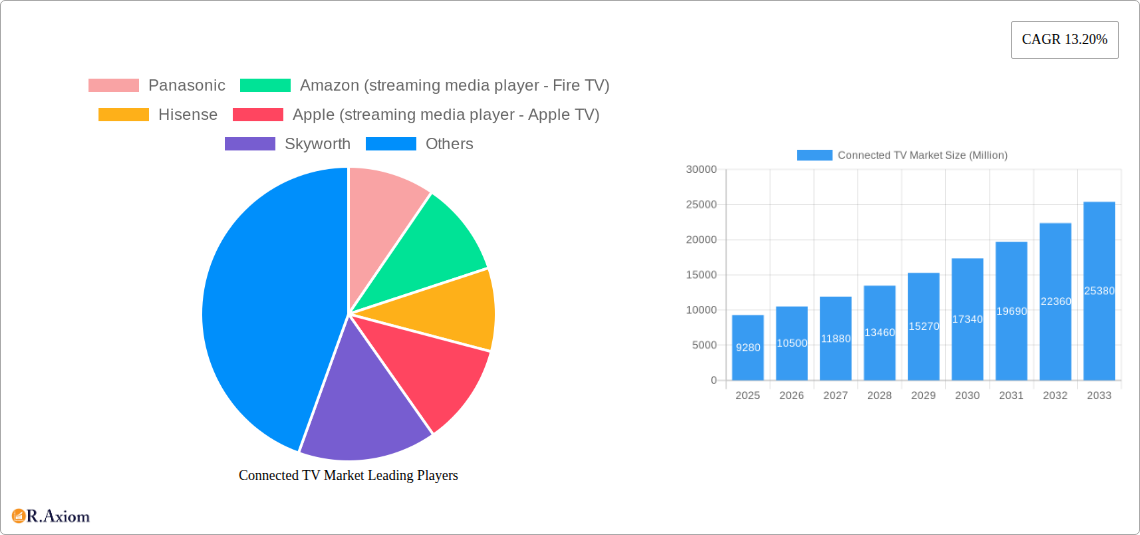
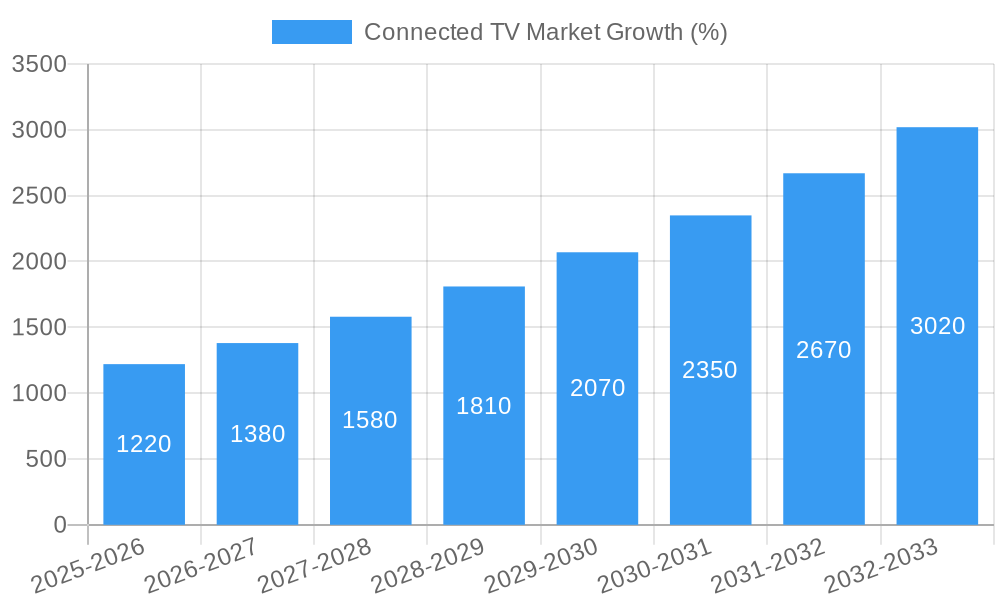
The Connected TV (CTV) market is experiencing robust growth, driven by the increasing adoption of streaming services, the proliferation of smart TVs with enhanced features, and the rising demand for high-resolution viewing experiences. The market size, estimated at $9.28 billion in 2025, is projected to expand significantly over the forecast period (2025-2033), fueled by a Compound Annual Growth Rate (CAGR) of 13.20%. This growth is propelled by several key factors. The shift towards over-the-top (OTT) content consumption is a primary driver, as consumers increasingly cut the cord and opt for streaming platforms offered by companies like Netflix, Amazon Prime Video, and Hulu. Technological advancements in display resolution, including the widespread adoption of 4K and the emergence of 8K technology, are also contributing to market expansion. Furthermore, the continuous improvement of streaming media players, offering enhanced user experience and seamless integration with various devices, fuels this growth. Key players like Samsung, LG, Roku, Amazon, and Google are fiercely competing, driving innovation and affordability, making CTV accessible to a broader audience.
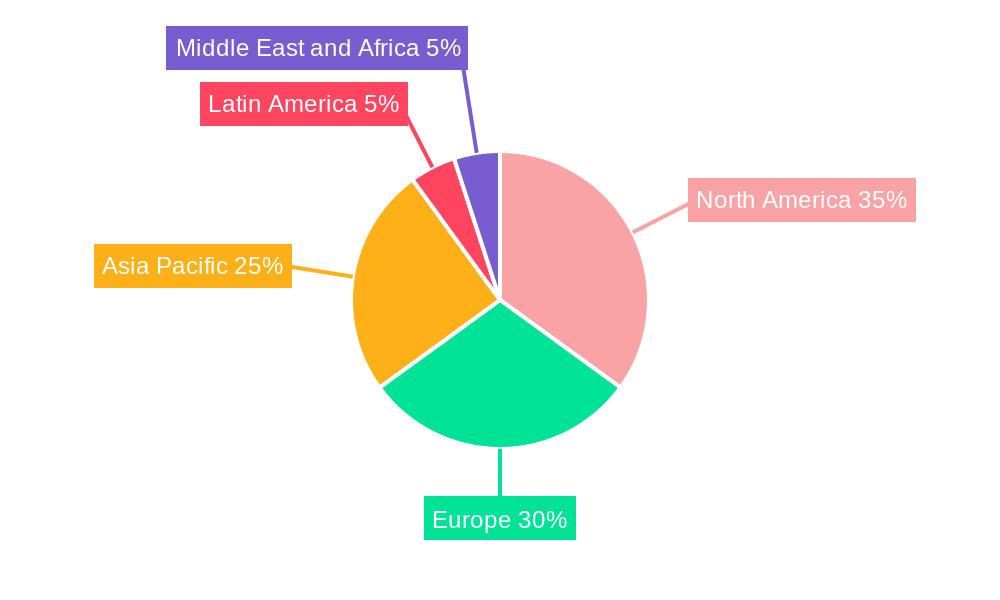
The market segmentation reveals strong growth across various device types. Smart TVs remain the dominant segment, but streaming media players are experiencing rapid growth, indicating a strong demand for flexible and versatile access to streaming content. Geographic distribution shows a strong presence in North America and Europe, with the Asia-Pacific region rapidly catching up due to increasing smartphone and internet penetration. However, market restraints include concerns about data privacy and security related to connected devices, and the potential for increased competition within the streaming media landscape. To overcome these challenges, companies are focusing on enhancing security measures and providing more personalized content experiences. The competitive landscape is characterized by intense competition among established players and emerging start-ups, leading to continuous innovation and pricing pressure, ultimately benefiting consumers.
Connected TV Market: A Comprehensive Market Analysis (2019-2033)
This detailed report provides a comprehensive analysis of the Connected TV market, encompassing market size, growth projections, key players, technological advancements, and emerging trends from 2019 to 2033. The study period covers historical data (2019-2024), the base year (2025), and a forecast period (2025-2033). This report is essential for industry stakeholders, investors, and strategic decision-makers seeking to understand and capitalize on the dynamic Connected TV landscape.
Connected TV Market Market Concentration & Innovation
This section analyzes the competitive landscape of the Connected TV market, examining market concentration, innovation drivers, regulatory frameworks, product substitutes, end-user trends, and mergers and acquisitions (M&A) activities. The analysis includes metrics such as market share and M&A deal values to provide a holistic view of the industry's dynamics. The market is characterized by a moderate level of concentration, with several key players vying for market dominance. Innovation is driven by advancements in display technology (4K, 8K, OLED), improved streaming capabilities, and the integration of smart home features. Regulatory frameworks concerning data privacy and content regulation impact market growth. The emergence of streaming services as substitutes for traditional cable TV significantly influences the market. End-user trends, such as the increasing demand for high-resolution displays and personalized content, shape product development. M&A activities, while not consistently high, play a role in reshaping the competitive landscape, with deal values averaging xx Million in the last 5 years.
- Market Share: Samsung, LG, and TCL hold significant market share, with estimates ranging from xx% to xx% combined.
- M&A Activity: Strategic acquisitions and partnerships are observed, primarily focusing on expanding content libraries and technological capabilities.
Connected TV Market Industry Trends & Insights
This section delves into the key trends and insights shaping the Connected TV market. The market is experiencing robust growth, fueled by factors such as increasing internet penetration, rising disposable incomes in developing economies, and the growing popularity of streaming services. Technological advancements, such as the proliferation of 4K and 8K displays, improvements in HDR technology, and the development of advanced smart TV features, further drive market expansion. Consumer preferences are shifting towards larger screen sizes, higher resolutions, and personalized viewing experiences. Competitive dynamics are intense, with established players and new entrants continuously innovating to capture market share. The Compound Annual Growth Rate (CAGR) for the Connected TV market is projected to be xx% during the forecast period. Market penetration is increasing steadily, with a significant portion of households now owning at least one connected TV.
Dominant Markets & Segments in Connected TV Market
This section identifies the leading regions, countries, and segments within the Connected TV market. The analysis focuses on By Device (Smart TVs and Streaming Media Players) and resolution (4K, Ultra HD, 8K). Smart TVs dominate the market, with a xx Million unit market size in 2025.
Key Drivers for Smart TV Dominance:
- Increasing affordability of Smart TVs.
- Bundled features and convenience.
- Improved user interfaces and functionalities.
Streaming Media Player Market Overview (Million units):
- 2020: xx
- 2021: xx
- 2022: xx
- 2023: xx
- 2024: xx
- 2025: xx
- 2026: xx
- 2027: xx
The Asia-Pacific region is the leading market, driven by strong economic growth, rising disposable incomes, and high internet penetration. North America and Europe also represent substantial markets, although growth rates may be slightly lower compared to Asia-Pacific. The 4K resolution segment holds the largest share, but 8K technology is gaining traction, albeit at a slower pace due to higher costs.
Connected TV Market Product Developments
The Connected TV market is characterized by continuous product innovation. Key developments include advancements in display technology (e.g., Mini-LED, OLED, QLED), improved processing power for enhanced streaming capabilities, integration of voice assistants and smart home features, and the development of more user-friendly interfaces. These innovations aim to provide consumers with more immersive viewing experiences and greater convenience. The market is witnessing the rise of personalized content recommendations and improved accessibility features. Competition is fierce, with companies constantly striving to differentiate their products through enhanced features and competitive pricing.
Report Scope & Segmentation Analysis
This report segments the Connected TV market based on device type (Smart TVs and Streaming Media Players) and resolution (4K, Ultra HD, 8K). Smart TVs are projected to maintain their dominance throughout the forecast period, driven by factors such as affordability and bundled features. Streaming Media Players, while smaller in market size, are expected to experience steady growth due to their affordability and flexibility, offering an upgrade pathway for older TVs. The 4K resolution segment currently holds the largest market share but 8K is showing potential for future growth as costs decrease and content availability increases. Each segment exhibits varying growth projections and competitive dynamics, with intense competition among major players in all segments.
Key Drivers of Connected TV Market Growth
The Connected TV market's growth is propelled by several key factors:
- Technological Advancements: Higher resolutions (4K, 8K), improved picture quality (HDR, OLED), and enhanced smart features.
- Increased Internet Penetration: Broadband access is crucial for streaming content, fueling market expansion, particularly in emerging economies.
- Rising Disposable Incomes: Higher spending power allows consumers to invest in premium connected TVs and streaming services.
- Growth of Streaming Services: The vast array of content offered by streaming platforms is a key driver of adoption.
Challenges in the Connected TV Market Sector
Several challenges hinder the Connected TV market's growth:
- Regulatory Hurdles: Data privacy concerns and content regulations impact market expansion.
- Supply Chain Issues: Component shortages and geopolitical uncertainties can affect production and delivery.
- Competitive Pressures: Intense competition among manufacturers leads to pricing pressures and margin erosion.
Emerging Opportunities in Connected TV Market
Numerous opportunities exist within the Connected TV market:
- Expansion into Emerging Markets: Untapped potential in developing countries with rising internet penetration.
- Next-Generation Technologies: Adoption of 8K, microLED, and other advanced display technologies.
- Integration with Smart Home Ecosystems: Seamless integration with other smart devices and platforms.
Leading Players in the Connected TV Market Market
- Panasonic
- Amazon (streaming media player - Fire TV)
- Hisense
- Apple (streaming media player - Apple TV)
- Skyworth
- Google (Chromecast)
- Sharp Electronics
- Xiaomi Corporation
- TCL
- Haier Group
- Vizio Inc
- Roku (streaming media player - Roku)
- Samsung Corporation
- LG Electronics
- Sony Corporation
Key Developments in Connected TV Market Industry
- May 2023: Blaupunkt and Flipkart partnered to launch the 40-inch Android TV Sigma series, featuring a bezel-less design and enhanced audio-visual capabilities. This partnership expands Blaupunkt's reach in the Indian market.
- May 2023: Hisense launched its ULED X and U8 TV products in the UAE, increasing brand awareness by 25 percentage points. This showcases Hisense's successful market penetration strategy.
- November 2022: Samsung launched the Samsung Crystal 55AU7700 55-inch 4K Smart LED TV in India, highlighting the continued demand for high-resolution Smart TVs in the Indian market.
Strategic Outlook for Connected TV Market Market
The Connected TV market exhibits significant growth potential, driven by technological advancements, increased internet penetration, and the continued rise of streaming services. Future opportunities lie in the expansion into emerging markets, the adoption of next-generation display technologies, and the integration of connected TVs into broader smart home ecosystems. The market is expected to remain highly competitive, with companies focusing on product innovation, strategic partnerships, and aggressive marketing to gain market share. The continued evolution of streaming services and content delivery models will shape the future landscape of the Connected TV market.
Connected TV Market Segmentation
-
1. Device
-
1.1. Smart TV
- 1.1.1. Smart TV
- 1.1.2. Smart TV
- 1.1.3. Key shif
- 1.2. Streamin
-
1.1. Smart TV
Connected TV Market Segmentation By Geography
-
1. North America
- 1.1. United States
- 1.2. Canada
-
2. Europe
- 2.1. United Kingdom
- 2.2. Germany
- 2.3. France
-
3. Asia
- 3.1. China
- 3.2. India
- 3.3. Japan
- 3.4. Australia and New Zealand
- 4. Latin America
- 5. Middle East and Africa
Connected TV Market REPORT HIGHLIGHTS
| Aspects | Details |
|---|---|
| Study Period | 2019-2033 |
| Base Year | 2024 |
| Estimated Year | 2025 |
| Forecast Period | 2025-2033 |
| Historical Period | 2019-2024 |
| Growth Rate | CAGR of 13.20% from 2019-2033 |
| Segmentation |
|
Table of Contents
- 1. Introduction
- 1.1. Research Scope
- 1.2. Market Segmentation
- 1.3. Research Methodology
- 1.4. Definitions and Assumptions
- 2. Executive Summary
- 2.1. Introduction
- 3. Market Dynamics
- 3.1. Introduction
- 3.2. Market Drivers
- 3.2.1. Growing internet penetration and anticipated shift from conventional TVs; Industry collaborations and favorable market conditions (shift from internet TV to smart TV)
- 3.3. Market Restrains
- 3.3.1. The Need for High Investment in Content Creation and Broadcasting; Bandwidth Allocation for 4K Resolution
- 3.4. Market Trends
- 3.4.1. Smart TV Accounts for the Largest Market Share
- 4. Market Factor Analysis
- 4.1. Porters Five Forces
- 4.2. Supply/Value Chain
- 4.3. PESTEL analysis
- 4.4. Market Entropy
- 4.5. Patent/Trademark Analysis
- 5. Global Connected TV Market Analysis, Insights and Forecast, 2019-2031
- 5.1. Market Analysis, Insights and Forecast - by Device
- 5.1.1. Smart TV
- 5.1.1.1. Smart TV
- 5.1.1.2. Smart TV
- 5.1.1.3. Key shif
- 5.1.2. Streamin
- 5.1.1. Smart TV
- 5.2. Market Analysis, Insights and Forecast - by Region
- 5.2.1. North America
- 5.2.2. Europe
- 5.2.3. Asia
- 5.2.4. Latin America
- 5.2.5. Middle East and Africa
- 5.1. Market Analysis, Insights and Forecast - by Device
- 6. North America Connected TV Market Analysis, Insights and Forecast, 2019-2031
- 6.1. Market Analysis, Insights and Forecast - by Device
- 6.1.1. Smart TV
- 6.1.1.1. Smart TV
- 6.1.1.2. Smart TV
- 6.1.1.3. Key shif
- 6.1.2. Streamin
- 6.1.1. Smart TV
- 6.1. Market Analysis, Insights and Forecast - by Device
- 7. Europe Connected TV Market Analysis, Insights and Forecast, 2019-2031
- 7.1. Market Analysis, Insights and Forecast - by Device
- 7.1.1. Smart TV
- 7.1.1.1. Smart TV
- 7.1.1.2. Smart TV
- 7.1.1.3. Key shif
- 7.1.2. Streamin
- 7.1.1. Smart TV
- 7.1. Market Analysis, Insights and Forecast - by Device
- 8. Asia Connected TV Market Analysis, Insights and Forecast, 2019-2031
- 8.1. Market Analysis, Insights and Forecast - by Device
- 8.1.1. Smart TV
- 8.1.1.1. Smart TV
- 8.1.1.2. Smart TV
- 8.1.1.3. Key shif
- 8.1.2. Streamin
- 8.1.1. Smart TV
- 8.1. Market Analysis, Insights and Forecast - by Device
- 9. Latin America Connected TV Market Analysis, Insights and Forecast, 2019-2031
- 9.1. Market Analysis, Insights and Forecast - by Device
- 9.1.1. Smart TV
- 9.1.1.1. Smart TV
- 9.1.1.2. Smart TV
- 9.1.1.3. Key shif
- 9.1.2. Streamin
- 9.1.1. Smart TV
- 9.1. Market Analysis, Insights and Forecast - by Device
- 10. Middle East and Africa Connected TV Market Analysis, Insights and Forecast, 2019-2031
- 10.1. Market Analysis, Insights and Forecast - by Device
- 10.1.1. Smart TV
- 10.1.1.1. Smart TV
- 10.1.1.2. Smart TV
- 10.1.1.3. Key shif
- 10.1.2. Streamin
- 10.1.1. Smart TV
- 10.1. Market Analysis, Insights and Forecast - by Device
- 11. North America Connected TV Market Analysis, Insights and Forecast, 2019-2031
- 11.1. Market Analysis, Insights and Forecast - By Country/Sub-region
- 11.1.1 United States
- 11.1.2 Canada
- 12. Europe Connected TV Market Analysis, Insights and Forecast, 2019-2031
- 12.1. Market Analysis, Insights and Forecast - By Country/Sub-region
- 12.1.1 United Kingdom
- 12.1.2 Germany
- 12.1.3 France
- 12.1.4 Rest of Europe
- 13. Asia Pacific Connected TV Market Analysis, Insights and Forecast, 2019-2031
- 13.1. Market Analysis, Insights and Forecast - By Country/Sub-region
- 13.1.1 China
- 13.1.2 India
- 13.1.3 Japan
- 13.1.4 Rest of Asia Pacific
- 14. Latin America Connected TV Market Analysis, Insights and Forecast, 2019-2031
- 14.1. Market Analysis, Insights and Forecast - By Country/Sub-region
- 14.1.1.
- 15. Middle East and Africa Connected TV Market Analysis, Insights and Forecast, 2019-2031
- 15.1. Market Analysis, Insights and Forecast - By Country/Sub-region
- 15.1.1.
- 16. Competitive Analysis
- 16.1. Global Market Share Analysis 2024
- 16.2. Company Profiles
- 16.2.1 Panasonic
- 16.2.1.1. Overview
- 16.2.1.2. Products
- 16.2.1.3. SWOT Analysis
- 16.2.1.4. Recent Developments
- 16.2.1.5. Financials (Based on Availability)
- 16.2.2 Amazon (streaming media player - Fire TV)
- 16.2.2.1. Overview
- 16.2.2.2. Products
- 16.2.2.3. SWOT Analysis
- 16.2.2.4. Recent Developments
- 16.2.2.5. Financials (Based on Availability)
- 16.2.3 Hisense
- 16.2.3.1. Overview
- 16.2.3.2. Products
- 16.2.3.3. SWOT Analysis
- 16.2.3.4. Recent Developments
- 16.2.3.5. Financials (Based on Availability)
- 16.2.4 Apple (streaming media player - Apple TV)
- 16.2.4.1. Overview
- 16.2.4.2. Products
- 16.2.4.3. SWOT Analysis
- 16.2.4.4. Recent Developments
- 16.2.4.5. Financials (Based on Availability)
- 16.2.5 Skyworth
- 16.2.5.1. Overview
- 16.2.5.2. Products
- 16.2.5.3. SWOT Analysis
- 16.2.5.4. Recent Developments
- 16.2.5.5. Financials (Based on Availability)
- 16.2.6 Google (Chromecast)*List Not Exhaustive
- 16.2.6.1. Overview
- 16.2.6.2. Products
- 16.2.6.3. SWOT Analysis
- 16.2.6.4. Recent Developments
- 16.2.6.5. Financials (Based on Availability)
- 16.2.7 Sharp Electronics
- 16.2.7.1. Overview
- 16.2.7.2. Products
- 16.2.7.3. SWOT Analysis
- 16.2.7.4. Recent Developments
- 16.2.7.5. Financials (Based on Availability)
- 16.2.8 Xiaomi Corporation
- 16.2.8.1. Overview
- 16.2.8.2. Products
- 16.2.8.3. SWOT Analysis
- 16.2.8.4. Recent Developments
- 16.2.8.5. Financials (Based on Availability)
- 16.2.9 TCL
- 16.2.9.1. Overview
- 16.2.9.2. Products
- 16.2.9.3. SWOT Analysis
- 16.2.9.4. Recent Developments
- 16.2.9.5. Financials (Based on Availability)
- 16.2.10 Haier Group
- 16.2.10.1. Overview
- 16.2.10.2. Products
- 16.2.10.3. SWOT Analysis
- 16.2.10.4. Recent Developments
- 16.2.10.5. Financials (Based on Availability)
- 16.2.11 Vizio Inc
- 16.2.11.1. Overview
- 16.2.11.2. Products
- 16.2.11.3. SWOT Analysis
- 16.2.11.4. Recent Developments
- 16.2.11.5. Financials (Based on Availability)
- 16.2.12 Roku (streaming media player - Roku)
- 16.2.12.1. Overview
- 16.2.12.2. Products
- 16.2.12.3. SWOT Analysis
- 16.2.12.4. Recent Developments
- 16.2.12.5. Financials (Based on Availability)
- 16.2.13 Samsung Corporation
- 16.2.13.1. Overview
- 16.2.13.2. Products
- 16.2.13.3. SWOT Analysis
- 16.2.13.4. Recent Developments
- 16.2.13.5. Financials (Based on Availability)
- 16.2.14 LG Electronics
- 16.2.14.1. Overview
- 16.2.14.2. Products
- 16.2.14.3. SWOT Analysis
- 16.2.14.4. Recent Developments
- 16.2.14.5. Financials (Based on Availability)
- 16.2.15 Sony Corporation
- 16.2.15.1. Overview
- 16.2.15.2. Products
- 16.2.15.3. SWOT Analysis
- 16.2.15.4. Recent Developments
- 16.2.15.5. Financials (Based on Availability)
- 16.2.1 Panasonic
List of Figures
- Figure 1: Global Connected TV Market Revenue Breakdown (Million, %) by Region 2024 & 2032
- Figure 2: North America Connected TV Market Revenue (Million), by Country 2024 & 2032
- Figure 3: North America Connected TV Market Revenue Share (%), by Country 2024 & 2032
- Figure 4: Europe Connected TV Market Revenue (Million), by Country 2024 & 2032
- Figure 5: Europe Connected TV Market Revenue Share (%), by Country 2024 & 2032
- Figure 6: Asia Pacific Connected TV Market Revenue (Million), by Country 2024 & 2032
- Figure 7: Asia Pacific Connected TV Market Revenue Share (%), by Country 2024 & 2032
- Figure 8: Latin America Connected TV Market Revenue (Million), by Country 2024 & 2032
- Figure 9: Latin America Connected TV Market Revenue Share (%), by Country 2024 & 2032
- Figure 10: Middle East and Africa Connected TV Market Revenue (Million), by Country 2024 & 2032
- Figure 11: Middle East and Africa Connected TV Market Revenue Share (%), by Country 2024 & 2032
- Figure 12: North America Connected TV Market Revenue (Million), by Device 2024 & 2032
- Figure 13: North America Connected TV Market Revenue Share (%), by Device 2024 & 2032
- Figure 14: North America Connected TV Market Revenue (Million), by Country 2024 & 2032
- Figure 15: North America Connected TV Market Revenue Share (%), by Country 2024 & 2032
- Figure 16: Europe Connected TV Market Revenue (Million), by Device 2024 & 2032
- Figure 17: Europe Connected TV Market Revenue Share (%), by Device 2024 & 2032
- Figure 18: Europe Connected TV Market Revenue (Million), by Country 2024 & 2032
- Figure 19: Europe Connected TV Market Revenue Share (%), by Country 2024 & 2032
- Figure 20: Asia Connected TV Market Revenue (Million), by Device 2024 & 2032
- Figure 21: Asia Connected TV Market Revenue Share (%), by Device 2024 & 2032
- Figure 22: Asia Connected TV Market Revenue (Million), by Country 2024 & 2032
- Figure 23: Asia Connected TV Market Revenue Share (%), by Country 2024 & 2032
- Figure 24: Latin America Connected TV Market Revenue (Million), by Device 2024 & 2032
- Figure 25: Latin America Connected TV Market Revenue Share (%), by Device 2024 & 2032
- Figure 26: Latin America Connected TV Market Revenue (Million), by Country 2024 & 2032
- Figure 27: Latin America Connected TV Market Revenue Share (%), by Country 2024 & 2032
- Figure 28: Middle East and Africa Connected TV Market Revenue (Million), by Device 2024 & 2032
- Figure 29: Middle East and Africa Connected TV Market Revenue Share (%), by Device 2024 & 2032
- Figure 30: Middle East and Africa Connected TV Market Revenue (Million), by Country 2024 & 2032
- Figure 31: Middle East and Africa Connected TV Market Revenue Share (%), by Country 2024 & 2032
List of Tables
- Table 1: Global Connected TV Market Revenue Million Forecast, by Region 2019 & 2032
- Table 2: Global Connected TV Market Revenue Million Forecast, by Device 2019 & 2032
- Table 3: Global Connected TV Market Revenue Million Forecast, by Region 2019 & 2032
- Table 4: Global Connected TV Market Revenue Million Forecast, by Country 2019 & 2032
- Table 5: United States Connected TV Market Revenue (Million) Forecast, by Application 2019 & 2032
- Table 6: Canada Connected TV Market Revenue (Million) Forecast, by Application 2019 & 2032
- Table 7: Global Connected TV Market Revenue Million Forecast, by Country 2019 & 2032
- Table 8: United Kingdom Connected TV Market Revenue (Million) Forecast, by Application 2019 & 2032
- Table 9: Germany Connected TV Market Revenue (Million) Forecast, by Application 2019 & 2032
- Table 10: France Connected TV Market Revenue (Million) Forecast, by Application 2019 & 2032
- Table 11: Rest of Europe Connected TV Market Revenue (Million) Forecast, by Application 2019 & 2032
- Table 12: Global Connected TV Market Revenue Million Forecast, by Country 2019 & 2032
- Table 13: China Connected TV Market Revenue (Million) Forecast, by Application 2019 & 2032
- Table 14: India Connected TV Market Revenue (Million) Forecast, by Application 2019 & 2032
- Table 15: Japan Connected TV Market Revenue (Million) Forecast, by Application 2019 & 2032
- Table 16: Rest of Asia Pacific Connected TV Market Revenue (Million) Forecast, by Application 2019 & 2032
- Table 17: Global Connected TV Market Revenue Million Forecast, by Country 2019 & 2032
- Table 18: Connected TV Market Revenue (Million) Forecast, by Application 2019 & 2032
- Table 19: Global Connected TV Market Revenue Million Forecast, by Country 2019 & 2032
- Table 20: Connected TV Market Revenue (Million) Forecast, by Application 2019 & 2032
- Table 21: Global Connected TV Market Revenue Million Forecast, by Device 2019 & 2032
- Table 22: Global Connected TV Market Revenue Million Forecast, by Country 2019 & 2032
- Table 23: United States Connected TV Market Revenue (Million) Forecast, by Application 2019 & 2032
- Table 24: Canada Connected TV Market Revenue (Million) Forecast, by Application 2019 & 2032
- Table 25: Global Connected TV Market Revenue Million Forecast, by Device 2019 & 2032
- Table 26: Global Connected TV Market Revenue Million Forecast, by Country 2019 & 2032
- Table 27: United Kingdom Connected TV Market Revenue (Million) Forecast, by Application 2019 & 2032
- Table 28: Germany Connected TV Market Revenue (Million) Forecast, by Application 2019 & 2032
- Table 29: France Connected TV Market Revenue (Million) Forecast, by Application 2019 & 2032
- Table 30: Global Connected TV Market Revenue Million Forecast, by Device 2019 & 2032
- Table 31: Global Connected TV Market Revenue Million Forecast, by Country 2019 & 2032
- Table 32: China Connected TV Market Revenue (Million) Forecast, by Application 2019 & 2032
- Table 33: India Connected TV Market Revenue (Million) Forecast, by Application 2019 & 2032
- Table 34: Japan Connected TV Market Revenue (Million) Forecast, by Application 2019 & 2032
- Table 35: Australia and New Zealand Connected TV Market Revenue (Million) Forecast, by Application 2019 & 2032
- Table 36: Global Connected TV Market Revenue Million Forecast, by Device 2019 & 2032
- Table 37: Global Connected TV Market Revenue Million Forecast, by Country 2019 & 2032
- Table 38: Global Connected TV Market Revenue Million Forecast, by Device 2019 & 2032
- Table 39: Global Connected TV Market Revenue Million Forecast, by Country 2019 & 2032
Frequently Asked Questions
1. What is the projected Compound Annual Growth Rate (CAGR) of the Connected TV Market?
The projected CAGR is approximately 13.20%.
2. Which companies are prominent players in the Connected TV Market?
Key companies in the market include Panasonic, Amazon (streaming media player - Fire TV), Hisense, Apple (streaming media player - Apple TV), Skyworth, Google (Chromecast)*List Not Exhaustive, Sharp Electronics, Xiaomi Corporation, TCL, Haier Group, Vizio Inc, Roku (streaming media player - Roku), Samsung Corporation, LG Electronics, Sony Corporation.
3. What are the main segments of the Connected TV Market?
The market segments include Device.
4. Can you provide details about the market size?
The market size is estimated to be USD 9.28 Million as of 2022.
5. What are some drivers contributing to market growth?
Growing internet penetration and anticipated shift from conventional TVs; Industry collaborations and favorable market conditions (shift from internet TV to smart TV).
6. What are the notable trends driving market growth?
Smart TV Accounts for the Largest Market Share.
7. Are there any restraints impacting market growth?
The Need for High Investment in Content Creation and Broadcasting; Bandwidth Allocation for 4K Resolution.
8. Can you provide examples of recent developments in the market?
May 2023: Blaupunkt and Flipkart announced a partnership to launch the 40-inch Android TV Sigma series. The new Blaupunkt Sigma Series Android TV has a bezel-less design, 512 MB RAM, 4 GB ROM, two bottom-firing built-in speakers with surround sound technology, and 3 HDMI and 2 USB ports.
9. What pricing options are available for accessing the report?
Pricing options include single-user, multi-user, and enterprise licenses priced at USD 4750, USD 5250, and USD 8750 respectively.
10. Is the market size provided in terms of value or volume?
The market size is provided in terms of value, measured in Million.
11. Are there any specific market keywords associated with the report?
Yes, the market keyword associated with the report is "Connected TV Market," which aids in identifying and referencing the specific market segment covered.
12. How do I determine which pricing option suits my needs best?
The pricing options vary based on user requirements and access needs. Individual users may opt for single-user licenses, while businesses requiring broader access may choose multi-user or enterprise licenses for cost-effective access to the report.
13. Are there any additional resources or data provided in the Connected TV Market report?
While the report offers comprehensive insights, it's advisable to review the specific contents or supplementary materials provided to ascertain if additional resources or data are available.
14. How can I stay updated on further developments or reports in the Connected TV Market?
To stay informed about further developments, trends, and reports in the Connected TV Market, consider subscribing to industry newsletters, following relevant companies and organizations, or regularly checking reputable industry news sources and publications.
Methodology
Step 1 - Identification of Relevant Samples Size from Population Database


Step 2 - Approaches for Defining Global Market Size (Value, Volume* & Price*)

Note*: In applicable scenarios
Step 3 - Data Sources
Primary Research
- Web Analytics
- Survey Reports
- Research Institute
- Latest Research Reports
- Opinion Leaders
Secondary Research
- Annual Reports
- White Paper
- Latest Press Release
- Industry Association
- Paid Database
- Investor Presentations

Step 4 - Data Triangulation
Involves using different sources of information in order to increase the validity of a study
These sources are likely to be stakeholders in a program - participants, other researchers, program staff, other community members, and so on.
Then we put all data in single framework & apply various statistical tools to find out the dynamic on the market.
During the analysis stage, feedback from the stakeholder groups would be compared to determine areas of agreement as well as areas of divergence


