
Key Insights
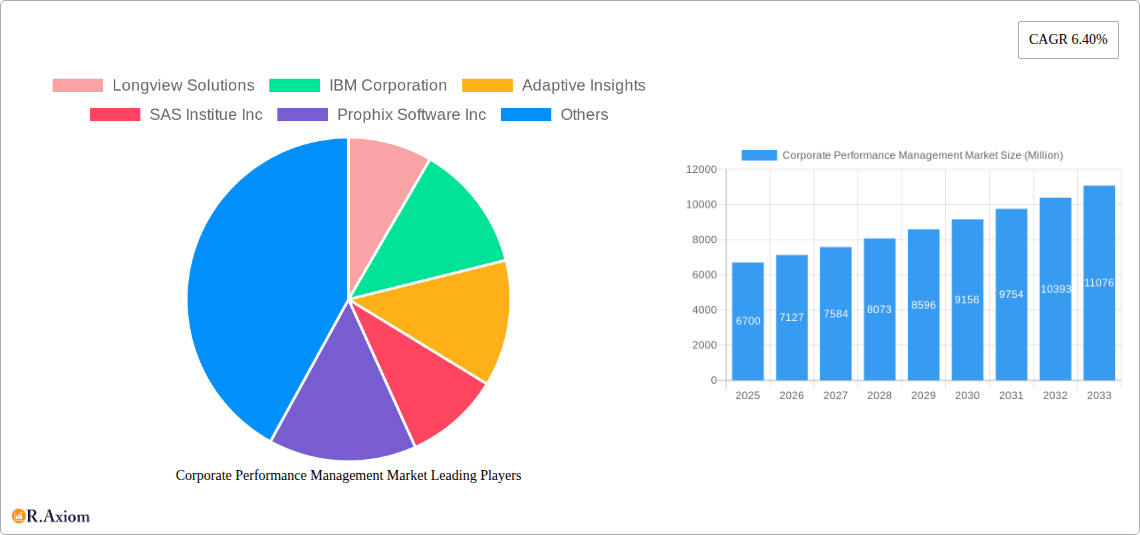
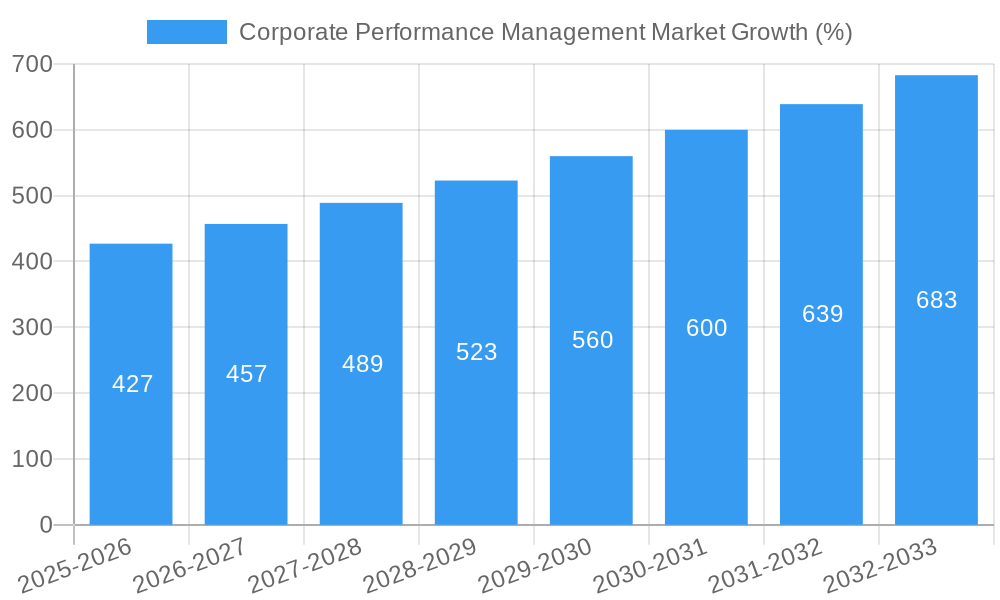
The Corporate Performance Management (CPM) market is experiencing robust growth, projected to reach a market size of $6.70 billion in 2025, expanding at a Compound Annual Growth Rate (CAGR) of 6.40%. This growth is fueled by several key factors. The increasing need for real-time insights into business performance, driven by the rapid adoption of cloud technologies and big data analytics, is a significant driver. Businesses across various sectors, including Retail, BFSI (Banking, Financial Services, and Insurance), Manufacturing, and Energy & Power, are actively seeking CPM solutions to optimize their operations, enhance decision-making, and improve overall profitability. The shift towards cloud-based deployments offers scalability, cost-effectiveness, and accessibility, further propelling market expansion. Furthermore, the growing demand for advanced functionalities like predictive analytics and integrated business planning is contributing to the market's upward trajectory. The market is segmented by deployment mode (on-premises and cloud), organizational size (SMEs and large enterprises), and end-user industry, allowing for targeted solutions and market penetration across various segments. Competition is fierce, with established players like IBM, Oracle, and SAP vying for market share alongside specialized CPM vendors such as Anaplan and Adaptive Insights.
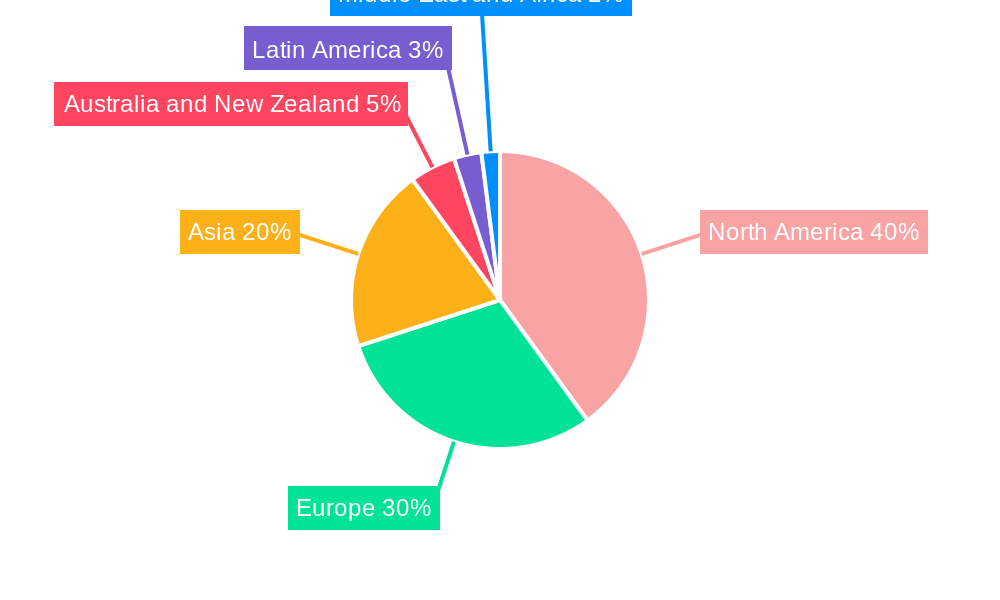
The forecast period from 2025 to 2033 promises continued growth, influenced by factors such as the increasing complexity of business operations, the imperative for improved regulatory compliance, and the growing focus on digital transformation initiatives. While challenges such as the high initial investment costs and the complexity of implementing CPM systems could act as restraints, the overall market outlook remains positive. The competitive landscape is dynamic, with both established players and emerging companies innovating to cater to the evolving needs of businesses. Geographic expansion, particularly in emerging markets, will further drive growth in the coming years. The North American market currently holds a significant share, but Asia and Europe are expected to witness substantial growth, reflecting increasing adoption across diverse industries.
Corporate Performance Management (CPM) Market: A Comprehensive Analysis (2019-2033)
This in-depth report provides a comprehensive analysis of the Corporate Performance Management (CPM) market, offering valuable insights for stakeholders, investors, and industry professionals. The study covers the period from 2019 to 2033, with 2025 as the base and estimated year, and a forecast period spanning 2025-2033. The report meticulously analyzes market dynamics, including key trends, growth drivers, challenges, and opportunities, across various segments. The report includes detailed analysis of major players like Longview Solutions, IBM Corporation, Adaptive Insights, SAS Institute Inc, Prophix Software Inc, Anaplan Inc, Oracle Corporation, Tagetik Software S.r.l, Host Analytics, Board International, Axiom Software, and SAP SE.
Corporate Performance Management Market Concentration & Innovation
The Corporate Performance Management (CPM) market exhibits a moderately concentrated landscape, with a few dominant players holding significant market share. However, the market is also characterized by ongoing innovation, driving competition and market expansion.
Market Concentration: While precise market share data for each vendor requires further investigation, the top 5 vendors likely account for approximately xx% of the overall market revenue in 2025. This concentration is attributed to established brand recognition, extensive product portfolios, and strong customer relationships.
Innovation Drivers: Key innovation drivers include the increasing adoption of cloud-based solutions, the integration of artificial intelligence (AI) and machine learning (ML) for enhanced data analysis and predictive capabilities, and the growing demand for real-time performance monitoring and reporting. The development of advanced analytics capabilities within CPM platforms is also a significant driver.
Regulatory Frameworks: Compliance requirements, particularly within the financial services industry, significantly influence the demand for robust and reliable CPM solutions. These regulations drive the adoption of secure and auditable CPM systems, providing a substantial market impetus.
Product Substitutes: While dedicated CPM solutions offer a comprehensive suite of functionalities, there are some substitute options that offer specific functionality such as spreadsheets and other business intelligence (BI) tools. However, the holistic capabilities of CPM solutions offer a distinct advantage for larger organizations.
End-User Trends: End-user trends show a growing preference for cloud-based deployments due to their scalability, accessibility, and cost-effectiveness. The adoption of mobile-first and data visualization tools is rapidly increasing within the end-user community.
M&A Activities: The CPM market has witnessed several mergers and acquisitions (M&A) activities in recent years, with deal values ranging from xx Million to xx Million. These acquisitions primarily focus on expanding product portfolios, enhancing technological capabilities, and broadening market reach. Some significant M&A activities include (Specific examples require further research to identify relevant acquisitions in the specified timeframe).
Corporate Performance Management Market Industry Trends & Insights
The Corporate Performance Management (CPM) market is experiencing robust growth, driven by several key factors. The market's Compound Annual Growth Rate (CAGR) is estimated to be xx% during the forecast period (2025-2033). This growth is fuelled by the increasing need for real-time data insights, improved operational efficiency, and enhanced decision-making capabilities across various industries.
Technological disruptions, particularly the advancements in cloud computing, big data analytics, and AI, are reshaping the CPM landscape. Cloud-based CPM solutions offer significant advantages over traditional on-premise deployments, including improved scalability, reduced IT infrastructure costs, and enhanced accessibility. The market penetration of cloud-based CPM solutions is rapidly increasing, expected to reach xx% by 2033.
Consumer preferences are shifting towards user-friendly, intuitive interfaces and robust data visualization capabilities. CPM vendors are adapting their offerings to meet these demands, focusing on enhanced user experience and the integration of advanced analytics features. The competitive dynamics within the CPM market are intense, with established players and emerging vendors vying for market share through product innovation, strategic partnerships, and aggressive pricing strategies.
Dominant Markets & Segments in Corporate Performance Management Market
The global Corporate Performance Management (CPM) market is dominated by the Cloud deployment segment, which is experiencing significantly higher growth than on-premise deployments due to its scalability and cost-effectiveness. The Large Enterprises segment also holds a significant share of the market, reflecting the higher adoption rates among larger organizations with complex business operations and the need for sophisticated CPM solutions. Within end-user industries, BFSI (Banking, Financial Services, and Insurance) stands out as a leading segment due to stringent regulatory requirements and the critical need for accurate financial reporting and risk management.
- Key Drivers for Cloud Deployment: Cost reduction, scalability, accessibility, and enhanced collaboration.
- Key Drivers for Large Enterprises: Complex business operations, need for sophisticated analytics, and higher budgets for technology investments.
- Key Drivers for BFSI: Stringent regulatory compliance, need for accurate financial reporting and risk management, and robust security requirements.
- Key Drivers for Retail: Need for real-time sales data analysis, inventory management, and improved supply chain efficiency.
- Key Drivers for Manufacturing: Optimizing production processes, reducing costs, and improving operational efficiency.
- Key Drivers for Energy and Power: Managing complex assets, optimizing energy production, and ensuring regulatory compliance.
Corporate Performance Management Market Product Developments
Recent product innovations in the CPM market have focused on integrating advanced analytics, AI, and machine learning capabilities to enhance predictive modeling and decision support. These improvements aim to provide businesses with a more holistic view of their performance, enabling better forecasting, risk management, and strategic planning. Cloud-based offerings are continually enhanced to improve usability and accessibility, including mobile capabilities and real-time dashboards. The integration of these technologies provides users with enhanced reporting and visualization tools, allowing them to make data-driven decisions effectively and efficiently.
Report Scope & Segmentation Analysis
This report segments the Corporate Performance Management market in three key dimensions: Mode of Deployment (On-Premises, Cloud), Size of Organization (Small and Medium Enterprises, Large Enterprises), and End-user Industry (Retail, BFSI, Manufacturing, Energy and Power, Other End-user Industries). Each segment's growth projections, market size, and competitive dynamics are analyzed in detail. The cloud deployment segment exhibits the highest growth rate, and large enterprises dominate the market due to their higher budgets and need for sophisticated solutions. The BFSI segment is the largest end-user industry, driven by regulatory requirements.
Key Drivers of Corporate Performance Management Market Growth
The Corporate Performance Management market is experiencing significant growth due to several key factors: the increasing adoption of cloud-based solutions, the need for real-time data-driven decision making, improved operational efficiency and cost reduction, regulatory compliance requirements, particularly within financial services, and the growing need for advanced analytics capabilities for effective forecasting and risk mitigation.
Challenges in the Corporate Performance Management Market Sector
Challenges facing the CPM market include the complexity of integrating disparate data sources, the need for skilled professionals to implement and manage CPM systems, the high cost of implementation and maintenance, especially for large-scale deployments, and the ongoing need to adapt to evolving technological advancements and regulatory changes. These factors can create barriers to entry for smaller companies and increase the total cost of ownership for all vendors.
Emerging Opportunities in Corporate Performance Management Market
Emerging opportunities in the CPM market include the growing adoption of AI and machine learning for predictive analytics, the increasing demand for mobile-first and data visualization tools, the expansion of cloud-based solutions into new markets such as small and medium enterprises (SMEs), and the integration of CPM systems with other enterprise applications for holistic performance management. These trends are expected to further propel market expansion and drive innovation.
Leading Players in the Corporate Performance Management Market Market
- Longview Solutions
- IBM Corporation
- Adaptive Insights
- SAS Institute Inc
- Prophix Software Inc
- Anaplan Inc
- Oracle Corporation
- Tagetik Software S.r.l
- Host Analytics
- Board International
- Axiom Software
- SAP SE
Key Developments in Corporate Performance Management Market Industry
- [Month, Year]: Company X launched a new cloud-based CPM solution with advanced AI capabilities. This significantly increased its market share.
- [Month, Year]: Company Y acquired Company Z, expanding its product portfolio and market reach.
- [Month, Year]: New regulatory compliance mandates increased demand for CPM solutions with enhanced security features.
- [Month, Year]: A major technological advancement in data integration improved the efficiency of CPM systems.
Strategic Outlook for Corporate Performance Management Market Market
The future of the Corporate Performance Management market is bright, driven by continuous technological advancements, increasing demand for real-time data insights, and the growing need for robust and reliable performance management systems across various industries. The market is poised for further expansion, with cloud-based solutions and advanced analytics playing a pivotal role. Opportunities exist for vendors who can provide innovative and user-friendly solutions that meet the evolving needs of businesses.
Corporate Performance Management Market Segmentation
-
1. Mode of Deployment
- 1.1. On-Premises
- 1.2. Cloud
-
2. Size of Organization
- 2.1. Small and Medium Enterprises
- 2.2. Large Enterprises
-
3. End-user Industry
- 3.1. Retail
- 3.2. BFSI
- 3.3. Manufacturing
- 3.4. Energy and Power
- 3.5. Other End-user Industries
Corporate Performance Management Market Segmentation By Geography
- 1. North America
- 2. Europe
- 3. Asia
- 4. Australia and New Zealand
- 5. Latin America
- 6. Middle East and Africa
Corporate Performance Management Market REPORT HIGHLIGHTS
| Aspects | Details |
|---|---|
| Study Period | 2019-2033 |
| Base Year | 2024 |
| Estimated Year | 2025 |
| Forecast Period | 2025-2033 |
| Historical Period | 2019-2024 |
| Growth Rate | CAGR of 6.40% from 2019-2033 |
| Segmentation |
|
Table of Contents
- 1. Introduction
- 1.1. Research Scope
- 1.2. Market Segmentation
- 1.3. Research Methodology
- 1.4. Definitions and Assumptions
- 2. Executive Summary
- 2.1. Introduction
- 3. Market Dynamics
- 3.1. Introduction
- 3.2. Market Drivers
- 3.2.1. Proliferation of Data Driven Decision Making; Growing Focus on Organizational Compliance
- 3.3. Market Restrains
- 3.3.1. Rise of Cloud-based Cyber Threats
- 3.4. Market Trends
- 3.4.1. Cloud Segment is Expected to Hold a Significant Share of the Market
- 4. Market Factor Analysis
- 4.1. Porters Five Forces
- 4.2. Supply/Value Chain
- 4.3. PESTEL analysis
- 4.4. Market Entropy
- 4.5. Patent/Trademark Analysis
- 5. Global Corporate Performance Management Market Analysis, Insights and Forecast, 2019-2031
- 5.1. Market Analysis, Insights and Forecast - by Mode of Deployment
- 5.1.1. On-Premises
- 5.1.2. Cloud
- 5.2. Market Analysis, Insights and Forecast - by Size of Organization
- 5.2.1. Small and Medium Enterprises
- 5.2.2. Large Enterprises
- 5.3. Market Analysis, Insights and Forecast - by End-user Industry
- 5.3.1. Retail
- 5.3.2. BFSI
- 5.3.3. Manufacturing
- 5.3.4. Energy and Power
- 5.3.5. Other End-user Industries
- 5.4. Market Analysis, Insights and Forecast - by Region
- 5.4.1. North America
- 5.4.2. Europe
- 5.4.3. Asia
- 5.4.4. Australia and New Zealand
- 5.4.5. Latin America
- 5.4.6. Middle East and Africa
- 5.1. Market Analysis, Insights and Forecast - by Mode of Deployment
- 6. North America Corporate Performance Management Market Analysis, Insights and Forecast, 2019-2031
- 6.1. Market Analysis, Insights and Forecast - by Mode of Deployment
- 6.1.1. On-Premises
- 6.1.2. Cloud
- 6.2. Market Analysis, Insights and Forecast - by Size of Organization
- 6.2.1. Small and Medium Enterprises
- 6.2.2. Large Enterprises
- 6.3. Market Analysis, Insights and Forecast - by End-user Industry
- 6.3.1. Retail
- 6.3.2. BFSI
- 6.3.3. Manufacturing
- 6.3.4. Energy and Power
- 6.3.5. Other End-user Industries
- 6.1. Market Analysis, Insights and Forecast - by Mode of Deployment
- 7. Europe Corporate Performance Management Market Analysis, Insights and Forecast, 2019-2031
- 7.1. Market Analysis, Insights and Forecast - by Mode of Deployment
- 7.1.1. On-Premises
- 7.1.2. Cloud
- 7.2. Market Analysis, Insights and Forecast - by Size of Organization
- 7.2.1. Small and Medium Enterprises
- 7.2.2. Large Enterprises
- 7.3. Market Analysis, Insights and Forecast - by End-user Industry
- 7.3.1. Retail
- 7.3.2. BFSI
- 7.3.3. Manufacturing
- 7.3.4. Energy and Power
- 7.3.5. Other End-user Industries
- 7.1. Market Analysis, Insights and Forecast - by Mode of Deployment
- 8. Asia Corporate Performance Management Market Analysis, Insights and Forecast, 2019-2031
- 8.1. Market Analysis, Insights and Forecast - by Mode of Deployment
- 8.1.1. On-Premises
- 8.1.2. Cloud
- 8.2. Market Analysis, Insights and Forecast - by Size of Organization
- 8.2.1. Small and Medium Enterprises
- 8.2.2. Large Enterprises
- 8.3. Market Analysis, Insights and Forecast - by End-user Industry
- 8.3.1. Retail
- 8.3.2. BFSI
- 8.3.3. Manufacturing
- 8.3.4. Energy and Power
- 8.3.5. Other End-user Industries
- 8.1. Market Analysis, Insights and Forecast - by Mode of Deployment
- 9. Australia and New Zealand Corporate Performance Management Market Analysis, Insights and Forecast, 2019-2031
- 9.1. Market Analysis, Insights and Forecast - by Mode of Deployment
- 9.1.1. On-Premises
- 9.1.2. Cloud
- 9.2. Market Analysis, Insights and Forecast - by Size of Organization
- 9.2.1. Small and Medium Enterprises
- 9.2.2. Large Enterprises
- 9.3. Market Analysis, Insights and Forecast - by End-user Industry
- 9.3.1. Retail
- 9.3.2. BFSI
- 9.3.3. Manufacturing
- 9.3.4. Energy and Power
- 9.3.5. Other End-user Industries
- 9.1. Market Analysis, Insights and Forecast - by Mode of Deployment
- 10. Latin America Corporate Performance Management Market Analysis, Insights and Forecast, 2019-2031
- 10.1. Market Analysis, Insights and Forecast - by Mode of Deployment
- 10.1.1. On-Premises
- 10.1.2. Cloud
- 10.2. Market Analysis, Insights and Forecast - by Size of Organization
- 10.2.1. Small and Medium Enterprises
- 10.2.2. Large Enterprises
- 10.3. Market Analysis, Insights and Forecast - by End-user Industry
- 10.3.1. Retail
- 10.3.2. BFSI
- 10.3.3. Manufacturing
- 10.3.4. Energy and Power
- 10.3.5. Other End-user Industries
- 10.1. Market Analysis, Insights and Forecast - by Mode of Deployment
- 11. Middle East and Africa Corporate Performance Management Market Analysis, Insights and Forecast, 2019-2031
- 11.1. Market Analysis, Insights and Forecast - by Mode of Deployment
- 11.1.1. On-Premises
- 11.1.2. Cloud
- 11.2. Market Analysis, Insights and Forecast - by Size of Organization
- 11.2.1. Small and Medium Enterprises
- 11.2.2. Large Enterprises
- 11.3. Market Analysis, Insights and Forecast - by End-user Industry
- 11.3.1. Retail
- 11.3.2. BFSI
- 11.3.3. Manufacturing
- 11.3.4. Energy and Power
- 11.3.5. Other End-user Industries
- 11.1. Market Analysis, Insights and Forecast - by Mode of Deployment
- 12. North America Corporate Performance Management Market Analysis, Insights and Forecast, 2019-2031
- 12.1. Market Analysis, Insights and Forecast - By Country/Sub-region
- 12.1.1.
- 13. Europe Corporate Performance Management Market Analysis, Insights and Forecast, 2019-2031
- 13.1. Market Analysis, Insights and Forecast - By Country/Sub-region
- 13.1.1.
- 14. Asia Corporate Performance Management Market Analysis, Insights and Forecast, 2019-2031
- 14.1. Market Analysis, Insights and Forecast - By Country/Sub-region
- 14.1.1.
- 15. Australia and New Zealand Corporate Performance Management Market Analysis, Insights and Forecast, 2019-2031
- 15.1. Market Analysis, Insights and Forecast - By Country/Sub-region
- 15.1.1.
- 16. Latin America Corporate Performance Management Market Analysis, Insights and Forecast, 2019-2031
- 16.1. Market Analysis, Insights and Forecast - By Country/Sub-region
- 16.1.1.
- 17. Middle East and Africa Corporate Performance Management Market Analysis, Insights and Forecast, 2019-2031
- 17.1. Market Analysis, Insights and Forecast - By Country/Sub-region
- 17.1.1.
- 18. Competitive Analysis
- 18.1. Global Market Share Analysis 2024
- 18.2. Company Profiles
- 18.2.1 Longview Solutions
- 18.2.1.1. Overview
- 18.2.1.2. Products
- 18.2.1.3. SWOT Analysis
- 18.2.1.4. Recent Developments
- 18.2.1.5. Financials (Based on Availability)
- 18.2.2 IBM Corporation
- 18.2.2.1. Overview
- 18.2.2.2. Products
- 18.2.2.3. SWOT Analysis
- 18.2.2.4. Recent Developments
- 18.2.2.5. Financials (Based on Availability)
- 18.2.3 Adaptive Insights
- 18.2.3.1. Overview
- 18.2.3.2. Products
- 18.2.3.3. SWOT Analysis
- 18.2.3.4. Recent Developments
- 18.2.3.5. Financials (Based on Availability)
- 18.2.4 SAS Institue Inc
- 18.2.4.1. Overview
- 18.2.4.2. Products
- 18.2.4.3. SWOT Analysis
- 18.2.4.4. Recent Developments
- 18.2.4.5. Financials (Based on Availability)
- 18.2.5 Prophix Software Inc
- 18.2.5.1. Overview
- 18.2.5.2. Products
- 18.2.5.3. SWOT Analysis
- 18.2.5.4. Recent Developments
- 18.2.5.5. Financials (Based on Availability)
- 18.2.6 Anaplan Inc
- 18.2.6.1. Overview
- 18.2.6.2. Products
- 18.2.6.3. SWOT Analysis
- 18.2.6.4. Recent Developments
- 18.2.6.5. Financials (Based on Availability)
- 18.2.7 Oracle Corporation
- 18.2.7.1. Overview
- 18.2.7.2. Products
- 18.2.7.3. SWOT Analysis
- 18.2.7.4. Recent Developments
- 18.2.7.5. Financials (Based on Availability)
- 18.2.8 Tagetik Software S r l
- 18.2.8.1. Overview
- 18.2.8.2. Products
- 18.2.8.3. SWOT Analysis
- 18.2.8.4. Recent Developments
- 18.2.8.5. Financials (Based on Availability)
- 18.2.9 Host Analytics
- 18.2.9.1. Overview
- 18.2.9.2. Products
- 18.2.9.3. SWOT Analysis
- 18.2.9.4. Recent Developments
- 18.2.9.5. Financials (Based on Availability)
- 18.2.10 Board International
- 18.2.10.1. Overview
- 18.2.10.2. Products
- 18.2.10.3. SWOT Analysis
- 18.2.10.4. Recent Developments
- 18.2.10.5. Financials (Based on Availability)
- 18.2.11 Axiom Softwar
- 18.2.11.1. Overview
- 18.2.11.2. Products
- 18.2.11.3. SWOT Analysis
- 18.2.11.4. Recent Developments
- 18.2.11.5. Financials (Based on Availability)
- 18.2.12 SAP SE
- 18.2.12.1. Overview
- 18.2.12.2. Products
- 18.2.12.3. SWOT Analysis
- 18.2.12.4. Recent Developments
- 18.2.12.5. Financials (Based on Availability)
- 18.2.1 Longview Solutions
List of Figures
- Figure 1: Global Corporate Performance Management Market Revenue Breakdown (Million, %) by Region 2024 & 2032
- Figure 2: North America Corporate Performance Management Market Revenue (Million), by Country 2024 & 2032
- Figure 3: North America Corporate Performance Management Market Revenue Share (%), by Country 2024 & 2032
- Figure 4: Europe Corporate Performance Management Market Revenue (Million), by Country 2024 & 2032
- Figure 5: Europe Corporate Performance Management Market Revenue Share (%), by Country 2024 & 2032
- Figure 6: Asia Corporate Performance Management Market Revenue (Million), by Country 2024 & 2032
- Figure 7: Asia Corporate Performance Management Market Revenue Share (%), by Country 2024 & 2032
- Figure 8: Australia and New Zealand Corporate Performance Management Market Revenue (Million), by Country 2024 & 2032
- Figure 9: Australia and New Zealand Corporate Performance Management Market Revenue Share (%), by Country 2024 & 2032
- Figure 10: Latin America Corporate Performance Management Market Revenue (Million), by Country 2024 & 2032
- Figure 11: Latin America Corporate Performance Management Market Revenue Share (%), by Country 2024 & 2032
- Figure 12: Middle East and Africa Corporate Performance Management Market Revenue (Million), by Country 2024 & 2032
- Figure 13: Middle East and Africa Corporate Performance Management Market Revenue Share (%), by Country 2024 & 2032
- Figure 14: North America Corporate Performance Management Market Revenue (Million), by Mode of Deployment 2024 & 2032
- Figure 15: North America Corporate Performance Management Market Revenue Share (%), by Mode of Deployment 2024 & 2032
- Figure 16: North America Corporate Performance Management Market Revenue (Million), by Size of Organization 2024 & 2032
- Figure 17: North America Corporate Performance Management Market Revenue Share (%), by Size of Organization 2024 & 2032
- Figure 18: North America Corporate Performance Management Market Revenue (Million), by End-user Industry 2024 & 2032
- Figure 19: North America Corporate Performance Management Market Revenue Share (%), by End-user Industry 2024 & 2032
- Figure 20: North America Corporate Performance Management Market Revenue (Million), by Country 2024 & 2032
- Figure 21: North America Corporate Performance Management Market Revenue Share (%), by Country 2024 & 2032
- Figure 22: Europe Corporate Performance Management Market Revenue (Million), by Mode of Deployment 2024 & 2032
- Figure 23: Europe Corporate Performance Management Market Revenue Share (%), by Mode of Deployment 2024 & 2032
- Figure 24: Europe Corporate Performance Management Market Revenue (Million), by Size of Organization 2024 & 2032
- Figure 25: Europe Corporate Performance Management Market Revenue Share (%), by Size of Organization 2024 & 2032
- Figure 26: Europe Corporate Performance Management Market Revenue (Million), by End-user Industry 2024 & 2032
- Figure 27: Europe Corporate Performance Management Market Revenue Share (%), by End-user Industry 2024 & 2032
- Figure 28: Europe Corporate Performance Management Market Revenue (Million), by Country 2024 & 2032
- Figure 29: Europe Corporate Performance Management Market Revenue Share (%), by Country 2024 & 2032
- Figure 30: Asia Corporate Performance Management Market Revenue (Million), by Mode of Deployment 2024 & 2032
- Figure 31: Asia Corporate Performance Management Market Revenue Share (%), by Mode of Deployment 2024 & 2032
- Figure 32: Asia Corporate Performance Management Market Revenue (Million), by Size of Organization 2024 & 2032
- Figure 33: Asia Corporate Performance Management Market Revenue Share (%), by Size of Organization 2024 & 2032
- Figure 34: Asia Corporate Performance Management Market Revenue (Million), by End-user Industry 2024 & 2032
- Figure 35: Asia Corporate Performance Management Market Revenue Share (%), by End-user Industry 2024 & 2032
- Figure 36: Asia Corporate Performance Management Market Revenue (Million), by Country 2024 & 2032
- Figure 37: Asia Corporate Performance Management Market Revenue Share (%), by Country 2024 & 2032
- Figure 38: Australia and New Zealand Corporate Performance Management Market Revenue (Million), by Mode of Deployment 2024 & 2032
- Figure 39: Australia and New Zealand Corporate Performance Management Market Revenue Share (%), by Mode of Deployment 2024 & 2032
- Figure 40: Australia and New Zealand Corporate Performance Management Market Revenue (Million), by Size of Organization 2024 & 2032
- Figure 41: Australia and New Zealand Corporate Performance Management Market Revenue Share (%), by Size of Organization 2024 & 2032
- Figure 42: Australia and New Zealand Corporate Performance Management Market Revenue (Million), by End-user Industry 2024 & 2032
- Figure 43: Australia and New Zealand Corporate Performance Management Market Revenue Share (%), by End-user Industry 2024 & 2032
- Figure 44: Australia and New Zealand Corporate Performance Management Market Revenue (Million), by Country 2024 & 2032
- Figure 45: Australia and New Zealand Corporate Performance Management Market Revenue Share (%), by Country 2024 & 2032
- Figure 46: Latin America Corporate Performance Management Market Revenue (Million), by Mode of Deployment 2024 & 2032
- Figure 47: Latin America Corporate Performance Management Market Revenue Share (%), by Mode of Deployment 2024 & 2032
- Figure 48: Latin America Corporate Performance Management Market Revenue (Million), by Size of Organization 2024 & 2032
- Figure 49: Latin America Corporate Performance Management Market Revenue Share (%), by Size of Organization 2024 & 2032
- Figure 50: Latin America Corporate Performance Management Market Revenue (Million), by End-user Industry 2024 & 2032
- Figure 51: Latin America Corporate Performance Management Market Revenue Share (%), by End-user Industry 2024 & 2032
- Figure 52: Latin America Corporate Performance Management Market Revenue (Million), by Country 2024 & 2032
- Figure 53: Latin America Corporate Performance Management Market Revenue Share (%), by Country 2024 & 2032
- Figure 54: Middle East and Africa Corporate Performance Management Market Revenue (Million), by Mode of Deployment 2024 & 2032
- Figure 55: Middle East and Africa Corporate Performance Management Market Revenue Share (%), by Mode of Deployment 2024 & 2032
- Figure 56: Middle East and Africa Corporate Performance Management Market Revenue (Million), by Size of Organization 2024 & 2032
- Figure 57: Middle East and Africa Corporate Performance Management Market Revenue Share (%), by Size of Organization 2024 & 2032
- Figure 58: Middle East and Africa Corporate Performance Management Market Revenue (Million), by End-user Industry 2024 & 2032
- Figure 59: Middle East and Africa Corporate Performance Management Market Revenue Share (%), by End-user Industry 2024 & 2032
- Figure 60: Middle East and Africa Corporate Performance Management Market Revenue (Million), by Country 2024 & 2032
- Figure 61: Middle East and Africa Corporate Performance Management Market Revenue Share (%), by Country 2024 & 2032
List of Tables
- Table 1: Global Corporate Performance Management Market Revenue Million Forecast, by Region 2019 & 2032
- Table 2: Global Corporate Performance Management Market Revenue Million Forecast, by Mode of Deployment 2019 & 2032
- Table 3: Global Corporate Performance Management Market Revenue Million Forecast, by Size of Organization 2019 & 2032
- Table 4: Global Corporate Performance Management Market Revenue Million Forecast, by End-user Industry 2019 & 2032
- Table 5: Global Corporate Performance Management Market Revenue Million Forecast, by Region 2019 & 2032
- Table 6: Global Corporate Performance Management Market Revenue Million Forecast, by Country 2019 & 2032
- Table 7: Corporate Performance Management Market Revenue (Million) Forecast, by Application 2019 & 2032
- Table 8: Global Corporate Performance Management Market Revenue Million Forecast, by Country 2019 & 2032
- Table 9: Corporate Performance Management Market Revenue (Million) Forecast, by Application 2019 & 2032
- Table 10: Global Corporate Performance Management Market Revenue Million Forecast, by Country 2019 & 2032
- Table 11: Corporate Performance Management Market Revenue (Million) Forecast, by Application 2019 & 2032
- Table 12: Global Corporate Performance Management Market Revenue Million Forecast, by Country 2019 & 2032
- Table 13: Corporate Performance Management Market Revenue (Million) Forecast, by Application 2019 & 2032
- Table 14: Global Corporate Performance Management Market Revenue Million Forecast, by Country 2019 & 2032
- Table 15: Corporate Performance Management Market Revenue (Million) Forecast, by Application 2019 & 2032
- Table 16: Global Corporate Performance Management Market Revenue Million Forecast, by Country 2019 & 2032
- Table 17: Corporate Performance Management Market Revenue (Million) Forecast, by Application 2019 & 2032
- Table 18: Global Corporate Performance Management Market Revenue Million Forecast, by Mode of Deployment 2019 & 2032
- Table 19: Global Corporate Performance Management Market Revenue Million Forecast, by Size of Organization 2019 & 2032
- Table 20: Global Corporate Performance Management Market Revenue Million Forecast, by End-user Industry 2019 & 2032
- Table 21: Global Corporate Performance Management Market Revenue Million Forecast, by Country 2019 & 2032
- Table 22: Global Corporate Performance Management Market Revenue Million Forecast, by Mode of Deployment 2019 & 2032
- Table 23: Global Corporate Performance Management Market Revenue Million Forecast, by Size of Organization 2019 & 2032
- Table 24: Global Corporate Performance Management Market Revenue Million Forecast, by End-user Industry 2019 & 2032
- Table 25: Global Corporate Performance Management Market Revenue Million Forecast, by Country 2019 & 2032
- Table 26: Global Corporate Performance Management Market Revenue Million Forecast, by Mode of Deployment 2019 & 2032
- Table 27: Global Corporate Performance Management Market Revenue Million Forecast, by Size of Organization 2019 & 2032
- Table 28: Global Corporate Performance Management Market Revenue Million Forecast, by End-user Industry 2019 & 2032
- Table 29: Global Corporate Performance Management Market Revenue Million Forecast, by Country 2019 & 2032
- Table 30: Global Corporate Performance Management Market Revenue Million Forecast, by Mode of Deployment 2019 & 2032
- Table 31: Global Corporate Performance Management Market Revenue Million Forecast, by Size of Organization 2019 & 2032
- Table 32: Global Corporate Performance Management Market Revenue Million Forecast, by End-user Industry 2019 & 2032
- Table 33: Global Corporate Performance Management Market Revenue Million Forecast, by Country 2019 & 2032
- Table 34: Global Corporate Performance Management Market Revenue Million Forecast, by Mode of Deployment 2019 & 2032
- Table 35: Global Corporate Performance Management Market Revenue Million Forecast, by Size of Organization 2019 & 2032
- Table 36: Global Corporate Performance Management Market Revenue Million Forecast, by End-user Industry 2019 & 2032
- Table 37: Global Corporate Performance Management Market Revenue Million Forecast, by Country 2019 & 2032
- Table 38: Global Corporate Performance Management Market Revenue Million Forecast, by Mode of Deployment 2019 & 2032
- Table 39: Global Corporate Performance Management Market Revenue Million Forecast, by Size of Organization 2019 & 2032
- Table 40: Global Corporate Performance Management Market Revenue Million Forecast, by End-user Industry 2019 & 2032
- Table 41: Global Corporate Performance Management Market Revenue Million Forecast, by Country 2019 & 2032
Frequently Asked Questions
1. What is the projected Compound Annual Growth Rate (CAGR) of the Corporate Performance Management Market?
The projected CAGR is approximately 6.40%.
2. Which companies are prominent players in the Corporate Performance Management Market?
Key companies in the market include Longview Solutions, IBM Corporation, Adaptive Insights, SAS Institue Inc, Prophix Software Inc, Anaplan Inc, Oracle Corporation, Tagetik Software S r l, Host Analytics, Board International, Axiom Softwar, SAP SE.
3. What are the main segments of the Corporate Performance Management Market?
The market segments include Mode of Deployment, Size of Organization, End-user Industry.
4. Can you provide details about the market size?
The market size is estimated to be USD 6.70 Million as of 2022.
5. What are some drivers contributing to market growth?
Proliferation of Data Driven Decision Making; Growing Focus on Organizational Compliance.
6. What are the notable trends driving market growth?
Cloud Segment is Expected to Hold a Significant Share of the Market.
7. Are there any restraints impacting market growth?
Rise of Cloud-based Cyber Threats.
8. Can you provide examples of recent developments in the market?
N/A
9. What pricing options are available for accessing the report?
Pricing options include single-user, multi-user, and enterprise licenses priced at USD 4750, USD 5250, and USD 8750 respectively.
10. Is the market size provided in terms of value or volume?
The market size is provided in terms of value, measured in Million.
11. Are there any specific market keywords associated with the report?
Yes, the market keyword associated with the report is "Corporate Performance Management Market," which aids in identifying and referencing the specific market segment covered.
12. How do I determine which pricing option suits my needs best?
The pricing options vary based on user requirements and access needs. Individual users may opt for single-user licenses, while businesses requiring broader access may choose multi-user or enterprise licenses for cost-effective access to the report.
13. Are there any additional resources or data provided in the Corporate Performance Management Market report?
While the report offers comprehensive insights, it's advisable to review the specific contents or supplementary materials provided to ascertain if additional resources or data are available.
14. How can I stay updated on further developments or reports in the Corporate Performance Management Market?
To stay informed about further developments, trends, and reports in the Corporate Performance Management Market, consider subscribing to industry newsletters, following relevant companies and organizations, or regularly checking reputable industry news sources and publications.
Methodology
Step 1 - Identification of Relevant Samples Size from Population Database


Step 2 - Approaches for Defining Global Market Size (Value, Volume* & Price*)

Note*: In applicable scenarios
Step 3 - Data Sources
Primary Research
- Web Analytics
- Survey Reports
- Research Institute
- Latest Research Reports
- Opinion Leaders
Secondary Research
- Annual Reports
- White Paper
- Latest Press Release
- Industry Association
- Paid Database
- Investor Presentations

Step 4 - Data Triangulation
Involves using different sources of information in order to increase the validity of a study
These sources are likely to be stakeholders in a program - participants, other researchers, program staff, other community members, and so on.
Then we put all data in single framework & apply various statistical tools to find out the dynamic on the market.
During the analysis stage, feedback from the stakeholder groups would be compared to determine areas of agreement as well as areas of divergence


