

Key Insights
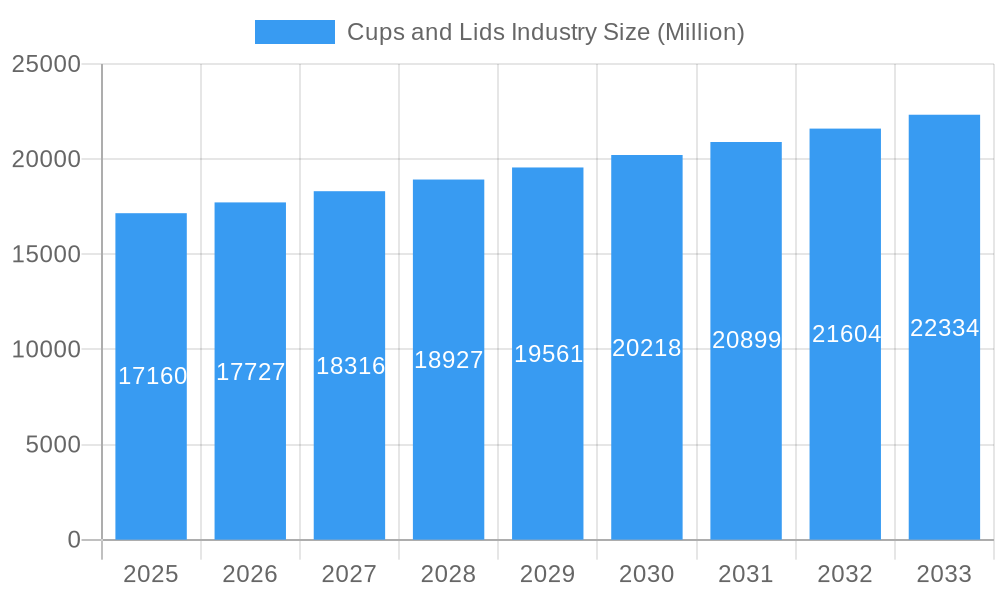
The global cups and lids market, valued at $17.16 billion in 2025, is projected to experience steady growth, driven by the expanding food and beverage industry, rising consumer demand for convenient packaging, and the increasing popularity of takeaway and delivery services. The market's Compound Annual Growth Rate (CAGR) of 3.40% from 2025 to 2033 indicates a consistent upward trajectory, although this rate may fluctuate depending on economic conditions and shifts in consumer preferences. Key market segments include plastic, paper, and foam cups, with plastic currently dominating due to its cost-effectiveness and versatility. However, growing environmental concerns are pushing a shift towards sustainable alternatives like paper and biodegradable materials, creating opportunities for companies focusing on eco-friendly options. The foodservice sector is a significant end-user, contributing substantially to market revenue, followed by retail and other end-user verticals. Geographic growth is expected across all regions, with North America and Europe maintaining significant market shares, while Asia-Pacific is poised for substantial expansion driven by increasing disposable incomes and urbanization. Competition is intense, with established players like Huhtamaki Oyj and Berry Global competing against smaller, specialized companies focusing on niche segments, such as sustainable or custom-designed cups and lids.
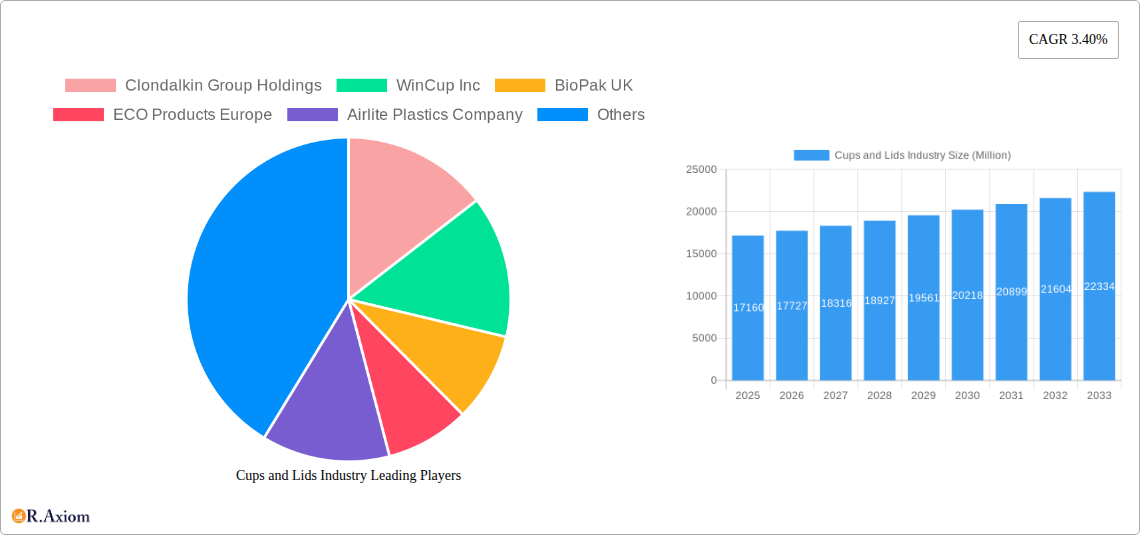
Cups and Lids Industry Market Size (In Billion)
The market faces several challenges, including fluctuating raw material prices and concerns about plastic waste. Companies are responding by investing in research and development to create innovative, sustainable materials and packaging solutions. For instance, the integration of recycled content into cup and lid manufacturing is becoming increasingly prevalent. Furthermore, advancements in printing technologies are enabling personalized and aesthetically appealing packaging, enhancing brand appeal and driving product differentiation. This competitive landscape necessitates continuous innovation and adaptation to meet evolving consumer preferences and regulatory requirements related to environmental sustainability. Future growth will likely be shaped by factors such as the adoption of new materials, improvements in manufacturing processes, and the increasing focus on circular economy models within the packaging industry.
Cups and Lids Industry Company Market Share
Cups and Lids Industry Market Report: 2019-2033
This comprehensive report provides a detailed analysis of the global cups and lids industry, offering actionable insights for industry stakeholders. With a study period spanning 2019-2033, a base year of 2025, and a forecast period of 2025-2033, this report covers market size, segmentation, competitive landscape, and future growth projections. The report's value surpasses $XX Million and is expected to reach $XX Million by 2033.
Cups and Lids Industry Market Concentration & Innovation
The global cups and lids industry is characterized by a moderately concentrated market structure, with several large players holding significant market share. Key players like Clondalkin Group Holdings, WinCup Inc, and Huhtamaki Oyj dominate various segments. Market share data for 2024 indicates that the top 5 players hold approximately XX% of the global market. The industry witnesses continuous innovation driven by consumer demand for sustainable and functional products.
- Market Concentration: Top 5 players hold approximately XX% of the market share.
- Innovation Drivers: Sustainability concerns (recycled materials, biodegradable options), convenience (design improvements, functionality), and cost optimization are key drivers.
- Regulatory Frameworks: Stringent regulations concerning material composition (e.g., BPA-free plastics) and recyclability are shaping product development.
- Product Substitutes: Reusable cups and alternative packaging options pose a moderate threat to the market.
- End-User Trends: Growing demand from the foodservice and retail sectors, particularly for on-the-go consumption, is propelling industry growth.
- M&A Activities: The industry has seen several mergers and acquisitions in recent years, with deal values exceeding $XX Million in the last 5 years. These transactions mainly focus on expanding product portfolios and geographic reach.
Cups and Lids Industry Industry Trends & Insights
The cups and lids industry is experiencing robust growth, driven by several factors. The Compound Annual Growth Rate (CAGR) from 2025 to 2033 is projected at XX%, exceeding previous growth rates. This surge is fueled by increasing disposable incomes, particularly in emerging economies, alongside the expansion of the foodservice and takeaway sectors. Market penetration of eco-friendly alternatives is steadily rising, driven by increased consumer awareness about environmental sustainability. Technological advancements in materials science and manufacturing processes are also driving innovation and efficiency. However, fluctuating raw material costs and intense competition among established and emerging players represent considerable challenges. Consumer preferences are shifting towards reusable, recyclable, and compostable options, impacting the demand for traditional products. The competitive dynamics are characterized by both consolidation through M&A and the entry of innovative startups focusing on sustainable solutions.
Dominant Markets & Segments in Cups and Lids Industry
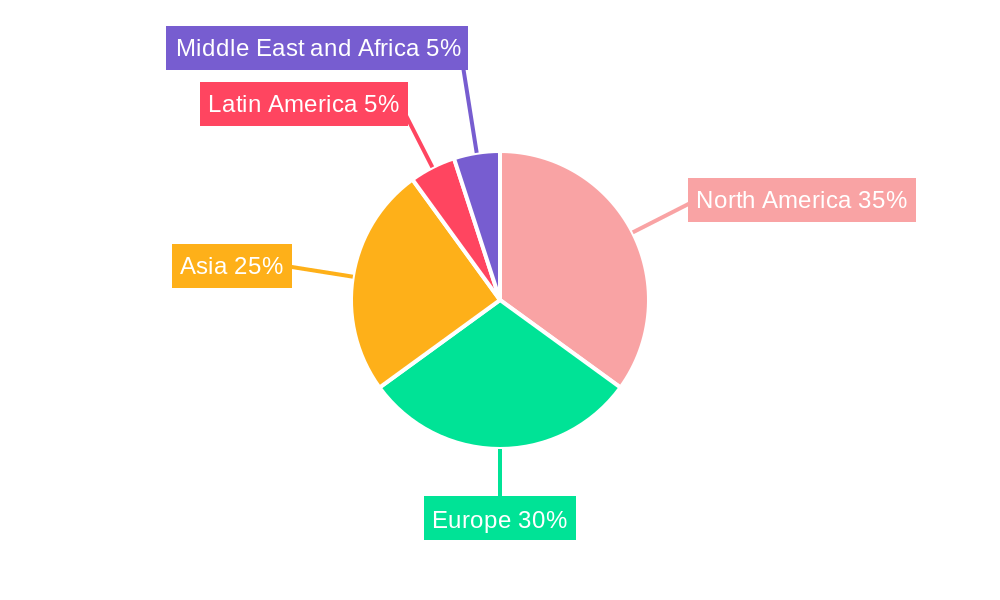
The North American region currently dominates the cups and lids market, followed by Europe and Asia-Pacific. Within segments:
- By Material: Plastic remains the dominant material due to its cost-effectiveness and versatility. However, paper and other sustainable alternatives are experiencing significant growth due to growing environmental concerns.
- By Product: Drinking cups constitute the largest segment by volume, driven by high demand from the foodservice and beverage industries. Packaging cups and lids are also showing significant growth potential.
- By End-User Vertical: The food and beverage industry accounts for the largest share, followed closely by the foodservice sector.
Key Drivers for Dominant Markets:
- North America: Robust foodservice sector, high disposable incomes, and advanced manufacturing infrastructure contribute to the region's dominance.
- Europe: Stringent environmental regulations and a growing focus on sustainable packaging are driving growth in the eco-friendly segment.
- Asia-Pacific: Rapid economic growth, rising disposable incomes, and urbanization are fueling demand for convenient packaging solutions.
Cups and Lids Industry Product Developments
Recent innovations focus on eco-friendly materials like rPET (recycled polyethylene terephthalate) and plant-based bioplastics. Companies are also developing innovative designs for enhanced recyclability and compostability. The use of advanced manufacturing technologies, such as injection molding and dry molding fiber technology, is improving efficiency and reducing environmental impact. These innovations offer competitive advantages by aligning with growing consumer preferences for sustainable packaging solutions.
Report Scope & Segmentation Analysis
This report segments the cups and lids market comprehensively across various parameters:
- By Material: Plastic, Paper, Foam, Other Materials (with individual growth projections and competitive analysis for each segment).
- By Product: Drinking Cups, Packaging Cups and Other Cups (Portion Cups and Food Cups), Lids (including market size estimates and competitive landscapes).
- By End-User Vertical: Food and Beverage, Foodservices, Retail and Other End User Verticals (with detailed analysis of growth drivers and competitive dynamics for each segment).
Key Drivers of Cups and Lids Industry Growth
Key growth drivers include the expanding foodservice sector, rising consumer demand for convenience, and the increasing popularity of single-serve packaging. Technological advancements, enabling the development of sustainable and efficient materials and manufacturing processes, also play a significant role. Favorable economic conditions in key markets further contribute to market expansion.
Challenges in the Cups and Lids Industry Sector
The industry faces challenges from fluctuating raw material costs, intensifying competition, and stringent environmental regulations. Supply chain disruptions and the need to meet growing consumer demand for sustainable packaging present additional hurdles. These factors can significantly impact profitability and market growth.
Emerging Opportunities in Cups and Lids Industry
The industry is witnessing increased interest in biodegradable and compostable materials, creating significant growth opportunities for companies investing in these areas. Emerging markets in developing countries also offer lucrative expansion potential. Furthermore, innovation in design and functionality is crucial to cater to evolving consumer preferences.
Leading Players in the Cups and Lids Industry Market
- Clondalkin Group Holdings
- WinCup Inc
- BioPak UK
- ECO Products Europe
- Airlite Plastics Company
- Brendos Ltd
- Dart Container
- Paper Cup Company
- Solo Cup Operating Corporation
- Mondi Group
- Georgia-Pacific LLC
- Greiner Holding AG
- Greiner AG
- Graphic Packaging International LLC
- Berry Global
- Printpack Inc
- Reynolds Consumer Products
- Huhtamaki Oyj
- Michael Procos SA
Key Developments in Cups and Lids Industry Industry
- April 2023: Greiner Packaging, Engel, and Brink jointly developed a thin-walled rPET cup using injection molding, reducing CO2e emissions. This significantly impacts the sustainable packaging segment.
- April 2022: PulPac and HSMG collaborated on water and oil barriers for PulPac Dry Molded fiber technology, enhancing the recyclability of molded fiber packaging for coffee cups and lids, impacting the recyclability aspects of the industry.
Strategic Outlook for Cups and Lids Industry Market
The cups and lids industry is poised for continued growth, driven by ongoing innovation in sustainable materials, efficient manufacturing processes, and expanding consumer demand. Focusing on eco-friendly options and catering to the evolving needs of the foodservice and retail sectors will be crucial for success. The market shows strong potential for growth, particularly in emerging markets and segments focused on sustainability.
Cups and Lids Industry Segmentation
-
1. Material
- 1.1. Plastic
- 1.2. Paper
- 1.3. Foam
- 1.4. Other Materials
-
2. Product
- 2.1. Drinking Cups
- 2.2. Packagin
- 2.3. Lids
-
3. End-User Vertical
- 3.1. Food and Beverage
- 3.2. Foodservices
- 3.3. Retail and Other End User Verticals
Cups and Lids Industry Segmentation By Geography
-
1. North America
- 1.1. United States
- 1.2. Canada
-
2. Europe
- 2.1. United kingdom
- 2.2. France
- 2.3. Germany
-
3. Asia
- 3.1. China
- 3.2. Japan
- 3.3. India
- 3.4. Australia and New Zealand
-
4. Latin America
- 4.1. Brazil
- 4.2. Mexico
-
5. Middle East and Africa
- 5.1. United Arab Emirates
- 5.2. South Africa
- 5.3. Saudi Arabia
Cups and Lids Industry Regional Market Share
Geographic Coverage of Cups and Lids Industry
Cups and Lids Industry REPORT HIGHLIGHTS
| Aspects | Details |
|---|---|
| Study Period | 2020-2034 |
| Base Year | 2025 |
| Estimated Year | 2026 |
| Forecast Period | 2026-2034 |
| Historical Period | 2020-2025 |
| Growth Rate | CAGR of 3.40% from 2020-2034 |
| Segmentation |
|
Table of Contents
- 1. Introduction
- 1.1. Research Scope
- 1.2. Market Segmentation
- 1.3. Research Objective
- 1.4. Definitions and Assumptions
- 2. Executive Summary
- 2.1. Market Snapshot
- 3. Market Dynamics
- 3.1. Market Drivers
- 3.2. Market Restrains
- 3.3. Market Trends
- 3.4. Market Opportunities
- 4. Market Factor Analysis
- 4.1. Porters Five Forces
- 4.1.1. Bargaining Power of Suppliers
- 4.1.2. Bargaining Power of Buyers
- 4.1.3. Threat of New Entrants
- 4.1.4. Threat of Substitutes
- 4.1.5. Competitive Rivalry
- 4.2. PESTEL analysis
- 4.3. BCG Analysis
- 4.3.1. Stars (High Growth, High Market Share)
- 4.3.2. Cash Cows (Low Growth, High Market Share)
- 4.3.3. Question Mark (High Growth, Low Market Share)
- 4.3.4. Dogs (Low Growth, Low Market Share)
- 4.4. Ansoff Matrix Analysis
- 4.5. Supply Chain Analysis
- 4.6. Regulatory Landscape
- 4.7. Current Market Potential and Opportunity Assessment (TAM–SAM–SOM Framework)
- 4.8. RAX Analyst Note
- 4.1. Porters Five Forces
- 5. Market Analysis, Insights and Forecast 2021-2033
- 5.1. Market Analysis, Insights and Forecast - by Material
- 5.1.1. Plastic
- 5.1.2. Paper
- 5.1.3. Foam
- 5.1.4. Other Materials
- 5.2. Market Analysis, Insights and Forecast - by Product
- 5.2.1. Drinking Cups
- 5.2.2. Packagin
- 5.2.3. Lids
- 5.3. Market Analysis, Insights and Forecast - by End-User Vertical
- 5.3.1. Food and Beverage
- 5.3.2. Foodservices
- 5.3.3. Retail and Other End User Verticals
- 5.4. Market Analysis, Insights and Forecast - by Region
- 5.4.1. North America
- 5.4.2. Europe
- 5.4.3. Asia
- 5.4.4. Latin America
- 5.4.5. Middle East and Africa
- 5.1. Market Analysis, Insights and Forecast - by Material
- 6. Global Cups and Lids Industry Analysis, Insights and Forecast, 2021-2033
- 6.1. Market Analysis, Insights and Forecast - by Material
- 6.1.1. Plastic
- 6.1.2. Paper
- 6.1.3. Foam
- 6.1.4. Other Materials
- 6.2. Market Analysis, Insights and Forecast - by Product
- 6.2.1. Drinking Cups
- 6.2.2. Packagin
- 6.2.3. Lids
- 6.3. Market Analysis, Insights and Forecast - by End-User Vertical
- 6.3.1. Food and Beverage
- 6.3.2. Foodservices
- 6.3.3. Retail and Other End User Verticals
- 6.1. Market Analysis, Insights and Forecast - by Material
- 7. North America Cups and Lids Industry Analysis, Insights and Forecast, 2020-2032
- 7.1. Market Analysis, Insights and Forecast - by Material
- 7.1.1. Plastic
- 7.1.2. Paper
- 7.1.3. Foam
- 7.1.4. Other Materials
- 7.2. Market Analysis, Insights and Forecast - by Product
- 7.2.1. Drinking Cups
- 7.2.2. Packagin
- 7.2.3. Lids
- 7.3. Market Analysis, Insights and Forecast - by End-User Vertical
- 7.3.1. Food and Beverage
- 7.3.2. Foodservices
- 7.3.3. Retail and Other End User Verticals
- 7.1. Market Analysis, Insights and Forecast - by Material
- 8. Europe Cups and Lids Industry Analysis, Insights and Forecast, 2020-2032
- 8.1. Market Analysis, Insights and Forecast - by Material
- 8.1.1. Plastic
- 8.1.2. Paper
- 8.1.3. Foam
- 8.1.4. Other Materials
- 8.2. Market Analysis, Insights and Forecast - by Product
- 8.2.1. Drinking Cups
- 8.2.2. Packagin
- 8.2.3. Lids
- 8.3. Market Analysis, Insights and Forecast - by End-User Vertical
- 8.3.1. Food and Beverage
- 8.3.2. Foodservices
- 8.3.3. Retail and Other End User Verticals
- 8.1. Market Analysis, Insights and Forecast - by Material
- 9. Asia Cups and Lids Industry Analysis, Insights and Forecast, 2020-2032
- 9.1. Market Analysis, Insights and Forecast - by Material
- 9.1.1. Plastic
- 9.1.2. Paper
- 9.1.3. Foam
- 9.1.4. Other Materials
- 9.2. Market Analysis, Insights and Forecast - by Product
- 9.2.1. Drinking Cups
- 9.2.2. Packagin
- 9.2.3. Lids
- 9.3. Market Analysis, Insights and Forecast - by End-User Vertical
- 9.3.1. Food and Beverage
- 9.3.2. Foodservices
- 9.3.3. Retail and Other End User Verticals
- 9.1. Market Analysis, Insights and Forecast - by Material
- 10. Latin America Cups and Lids Industry Analysis, Insights and Forecast, 2020-2032
- 10.1. Market Analysis, Insights and Forecast - by Material
- 10.1.1. Plastic
- 10.1.2. Paper
- 10.1.3. Foam
- 10.1.4. Other Materials
- 10.2. Market Analysis, Insights and Forecast - by Product
- 10.2.1. Drinking Cups
- 10.2.2. Packagin
- 10.2.3. Lids
- 10.3. Market Analysis, Insights and Forecast - by End-User Vertical
- 10.3.1. Food and Beverage
- 10.3.2. Foodservices
- 10.3.3. Retail and Other End User Verticals
- 10.1. Market Analysis, Insights and Forecast - by Material
- 11. Middle East and Africa Cups and Lids Industry Analysis, Insights and Forecast, 2020-2032
- 11.1. Market Analysis, Insights and Forecast - by Material
- 11.1.1. Plastic
- 11.1.2. Paper
- 11.1.3. Foam
- 11.1.4. Other Materials
- 11.2. Market Analysis, Insights and Forecast - by Product
- 11.2.1. Drinking Cups
- 11.2.2. Packagin
- 11.2.3. Lids
- 11.3. Market Analysis, Insights and Forecast - by End-User Vertical
- 11.3.1. Food and Beverage
- 11.3.2. Foodservices
- 11.3.3. Retail and Other End User Verticals
- 11.1. Market Analysis, Insights and Forecast - by Material
- 12. Competitive Analysis
- 12.1. Company Profiles
- 12.1.1 Clondalkin Group Holdings
- 12.1.1.1. Company Overview
- 12.1.1.2. Products
- 12.1.1.3. Company Financials
- 12.1.1.4. SWOT Analysis
- 12.1.2 WinCup Inc
- 12.1.2.1. Company Overview
- 12.1.2.2. Products
- 12.1.2.3. Company Financials
- 12.1.2.4. SWOT Analysis
- 12.1.3 BioPak UK
- 12.1.3.1. Company Overview
- 12.1.3.2. Products
- 12.1.3.3. Company Financials
- 12.1.3.4. SWOT Analysis
- 12.1.4 ECO Products Europe
- 12.1.4.1. Company Overview
- 12.1.4.2. Products
- 12.1.4.3. Company Financials
- 12.1.4.4. SWOT Analysis
- 12.1.5 Airlite Plastics Company
- 12.1.5.1. Company Overview
- 12.1.5.2. Products
- 12.1.5.3. Company Financials
- 12.1.5.4. SWOT Analysis
- 12.1.6 Brendos Ltd
- 12.1.6.1. Company Overview
- 12.1.6.2. Products
- 12.1.6.3. Company Financials
- 12.1.6.4. SWOT Analysis
- 12.1.7 Dart Containe
- 12.1.7.1. Company Overview
- 12.1.7.2. Products
- 12.1.7.3. Company Financials
- 12.1.7.4. SWOT Analysis
- 12.1.8 Paper Cup Company
- 12.1.8.1. Company Overview
- 12.1.8.2. Products
- 12.1.8.3. Company Financials
- 12.1.8.4. SWOT Analysis
- 12.1.9 Solo Cup Operating Corporation
- 12.1.9.1. Company Overview
- 12.1.9.2. Products
- 12.1.9.3. Company Financials
- 12.1.9.4. SWOT Analysis
- 12.1.10 Mondi Group
- 12.1.10.1. Company Overview
- 12.1.10.2. Products
- 12.1.10.3. Company Financials
- 12.1.10.4. SWOT Analysis
- 12.1.11 Georgia-Pacific LLC
- 12.1.11.1. Company Overview
- 12.1.11.2. Products
- 12.1.11.3. Company Financials
- 12.1.11.4. SWOT Analysis
- 12.1.12 Greiner Holding AG
- 12.1.12.1. Company Overview
- 12.1.12.2. Products
- 12.1.12.3. Company Financials
- 12.1.12.4. SWOT Analysis
- 12.1.13 Greiner AG
- 12.1.13.1. Company Overview
- 12.1.13.2. Products
- 12.1.13.3. Company Financials
- 12.1.13.4. SWOT Analysis
- 12.1.14 Graphic Packaging International LLC
- 12.1.14.1. Company Overview
- 12.1.14.2. Products
- 12.1.14.3. Company Financials
- 12.1.14.4. SWOT Analysis
- 12.1.15 Berry Global
- 12.1.15.1. Company Overview
- 12.1.15.2. Products
- 12.1.15.3. Company Financials
- 12.1.15.4. SWOT Analysis
- 12.1.16 Printpack Inc
- 12.1.16.1. Company Overview
- 12.1.16.2. Products
- 12.1.16.3. Company Financials
- 12.1.16.4. SWOT Analysis
- 12.1.17 Reynolds Consumer Products
- 12.1.17.1. Company Overview
- 12.1.17.2. Products
- 12.1.17.3. Company Financials
- 12.1.17.4. SWOT Analysis
- 12.1.18 Huhtamaki Oyj
- 12.1.18.1. Company Overview
- 12.1.18.2. Products
- 12.1.18.3. Company Financials
- 12.1.18.4. SWOT Analysis
- 12.1.19 Michael Procos SA
- 12.1.19.1. Company Overview
- 12.1.19.2. Products
- 12.1.19.3. Company Financials
- 12.1.19.4. SWOT Analysis
- 12.1.1 Clondalkin Group Holdings
- 12.2. Market Entropy
- 12.2.1 Company's Key Areas Served
- 12.2.2 Recent Developments
- 12.3. Company Market Share Analysis 2025
- 12.3.1 Top 5 Companies Market Share Analysis
- 12.3.2 Top 3 Companies Market Share Analysis
- 12.4. List of Potential Customers
- 13. Research Methodology
List of Figures
- Figure 1: Global Cups and Lids Industry Revenue Breakdown (Million, %) by Region 2025 & 2033
- Figure 2: North America Cups and Lids Industry Revenue (Million), by Material 2025 & 2033
- Figure 3: North America Cups and Lids Industry Revenue Share (%), by Material 2025 & 2033
- Figure 4: North America Cups and Lids Industry Revenue (Million), by Product 2025 & 2033
- Figure 5: North America Cups and Lids Industry Revenue Share (%), by Product 2025 & 2033
- Figure 6: North America Cups and Lids Industry Revenue (Million), by End-User Vertical 2025 & 2033
- Figure 7: North America Cups and Lids Industry Revenue Share (%), by End-User Vertical 2025 & 2033
- Figure 8: North America Cups and Lids Industry Revenue (Million), by Country 2025 & 2033
- Figure 9: North America Cups and Lids Industry Revenue Share (%), by Country 2025 & 2033
- Figure 10: Europe Cups and Lids Industry Revenue (Million), by Material 2025 & 2033
- Figure 11: Europe Cups and Lids Industry Revenue Share (%), by Material 2025 & 2033
- Figure 12: Europe Cups and Lids Industry Revenue (Million), by Product 2025 & 2033
- Figure 13: Europe Cups and Lids Industry Revenue Share (%), by Product 2025 & 2033
- Figure 14: Europe Cups and Lids Industry Revenue (Million), by End-User Vertical 2025 & 2033
- Figure 15: Europe Cups and Lids Industry Revenue Share (%), by End-User Vertical 2025 & 2033
- Figure 16: Europe Cups and Lids Industry Revenue (Million), by Country 2025 & 2033
- Figure 17: Europe Cups and Lids Industry Revenue Share (%), by Country 2025 & 2033
- Figure 18: Asia Cups and Lids Industry Revenue (Million), by Material 2025 & 2033
- Figure 19: Asia Cups and Lids Industry Revenue Share (%), by Material 2025 & 2033
- Figure 20: Asia Cups and Lids Industry Revenue (Million), by Product 2025 & 2033
- Figure 21: Asia Cups and Lids Industry Revenue Share (%), by Product 2025 & 2033
- Figure 22: Asia Cups and Lids Industry Revenue (Million), by End-User Vertical 2025 & 2033
- Figure 23: Asia Cups and Lids Industry Revenue Share (%), by End-User Vertical 2025 & 2033
- Figure 24: Asia Cups and Lids Industry Revenue (Million), by Country 2025 & 2033
- Figure 25: Asia Cups and Lids Industry Revenue Share (%), by Country 2025 & 2033
- Figure 26: Latin America Cups and Lids Industry Revenue (Million), by Material 2025 & 2033
- Figure 27: Latin America Cups and Lids Industry Revenue Share (%), by Material 2025 & 2033
- Figure 28: Latin America Cups and Lids Industry Revenue (Million), by Product 2025 & 2033
- Figure 29: Latin America Cups and Lids Industry Revenue Share (%), by Product 2025 & 2033
- Figure 30: Latin America Cups and Lids Industry Revenue (Million), by End-User Vertical 2025 & 2033
- Figure 31: Latin America Cups and Lids Industry Revenue Share (%), by End-User Vertical 2025 & 2033
- Figure 32: Latin America Cups and Lids Industry Revenue (Million), by Country 2025 & 2033
- Figure 33: Latin America Cups and Lids Industry Revenue Share (%), by Country 2025 & 2033
- Figure 34: Middle East and Africa Cups and Lids Industry Revenue (Million), by Material 2025 & 2033
- Figure 35: Middle East and Africa Cups and Lids Industry Revenue Share (%), by Material 2025 & 2033
- Figure 36: Middle East and Africa Cups and Lids Industry Revenue (Million), by Product 2025 & 2033
- Figure 37: Middle East and Africa Cups and Lids Industry Revenue Share (%), by Product 2025 & 2033
- Figure 38: Middle East and Africa Cups and Lids Industry Revenue (Million), by End-User Vertical 2025 & 2033
- Figure 39: Middle East and Africa Cups and Lids Industry Revenue Share (%), by End-User Vertical 2025 & 2033
- Figure 40: Middle East and Africa Cups and Lids Industry Revenue (Million), by Country 2025 & 2033
- Figure 41: Middle East and Africa Cups and Lids Industry Revenue Share (%), by Country 2025 & 2033
List of Tables
- Table 1: Global Cups and Lids Industry Revenue Million Forecast, by Material 2020 & 2033
- Table 2: Global Cups and Lids Industry Revenue Million Forecast, by Product 2020 & 2033
- Table 3: Global Cups and Lids Industry Revenue Million Forecast, by End-User Vertical 2020 & 2033
- Table 4: Global Cups and Lids Industry Revenue Million Forecast, by Region 2020 & 2033
- Table 5: Global Cups and Lids Industry Revenue Million Forecast, by Material 2020 & 2033
- Table 6: Global Cups and Lids Industry Revenue Million Forecast, by Product 2020 & 2033
- Table 7: Global Cups and Lids Industry Revenue Million Forecast, by End-User Vertical 2020 & 2033
- Table 8: Global Cups and Lids Industry Revenue Million Forecast, by Country 2020 & 2033
- Table 9: United States Cups and Lids Industry Revenue (Million) Forecast, by Application 2020 & 2033
- Table 10: Canada Cups and Lids Industry Revenue (Million) Forecast, by Application 2020 & 2033
- Table 11: Global Cups and Lids Industry Revenue Million Forecast, by Material 2020 & 2033
- Table 12: Global Cups and Lids Industry Revenue Million Forecast, by Product 2020 & 2033
- Table 13: Global Cups and Lids Industry Revenue Million Forecast, by End-User Vertical 2020 & 2033
- Table 14: Global Cups and Lids Industry Revenue Million Forecast, by Country 2020 & 2033
- Table 15: United kingdom Cups and Lids Industry Revenue (Million) Forecast, by Application 2020 & 2033
- Table 16: France Cups and Lids Industry Revenue (Million) Forecast, by Application 2020 & 2033
- Table 17: Germany Cups and Lids Industry Revenue (Million) Forecast, by Application 2020 & 2033
- Table 18: Global Cups and Lids Industry Revenue Million Forecast, by Material 2020 & 2033
- Table 19: Global Cups and Lids Industry Revenue Million Forecast, by Product 2020 & 2033
- Table 20: Global Cups and Lids Industry Revenue Million Forecast, by End-User Vertical 2020 & 2033
- Table 21: Global Cups and Lids Industry Revenue Million Forecast, by Country 2020 & 2033
- Table 22: China Cups and Lids Industry Revenue (Million) Forecast, by Application 2020 & 2033
- Table 23: Japan Cups and Lids Industry Revenue (Million) Forecast, by Application 2020 & 2033
- Table 24: India Cups and Lids Industry Revenue (Million) Forecast, by Application 2020 & 2033
- Table 25: Australia and New Zealand Cups and Lids Industry Revenue (Million) Forecast, by Application 2020 & 2033
- Table 26: Global Cups and Lids Industry Revenue Million Forecast, by Material 2020 & 2033
- Table 27: Global Cups and Lids Industry Revenue Million Forecast, by Product 2020 & 2033
- Table 28: Global Cups and Lids Industry Revenue Million Forecast, by End-User Vertical 2020 & 2033
- Table 29: Global Cups and Lids Industry Revenue Million Forecast, by Country 2020 & 2033
- Table 30: Brazil Cups and Lids Industry Revenue (Million) Forecast, by Application 2020 & 2033
- Table 31: Mexico Cups and Lids Industry Revenue (Million) Forecast, by Application 2020 & 2033
- Table 32: Global Cups and Lids Industry Revenue Million Forecast, by Material 2020 & 2033
- Table 33: Global Cups and Lids Industry Revenue Million Forecast, by Product 2020 & 2033
- Table 34: Global Cups and Lids Industry Revenue Million Forecast, by End-User Vertical 2020 & 2033
- Table 35: Global Cups and Lids Industry Revenue Million Forecast, by Country 2020 & 2033
- Table 36: United Arab Emirates Cups and Lids Industry Revenue (Million) Forecast, by Application 2020 & 2033
- Table 37: South Africa Cups and Lids Industry Revenue (Million) Forecast, by Application 2020 & 2033
- Table 38: Saudi Arabia Cups and Lids Industry Revenue (Million) Forecast, by Application 2020 & 2033
Frequently Asked Questions
1. What is the projected Compound Annual Growth Rate (CAGR) of the Cups and Lids Industry?
The projected CAGR is approximately 3.40%.
2. Which companies are prominent players in the Cups and Lids Industry?
Key companies in the market include Clondalkin Group Holdings, WinCup Inc, BioPak UK, ECO Products Europe, Airlite Plastics Company, Brendos Ltd, Dart Containe, Paper Cup Company, Solo Cup Operating Corporation, Mondi Group, Georgia-Pacific LLC, Greiner Holding AG, Greiner AG, Graphic Packaging International LLC, Berry Global, Printpack Inc, Reynolds Consumer Products, Huhtamaki Oyj, Michael Procos SA.
3. What are the main segments of the Cups and Lids Industry?
The market segments include Material, Product, End-User Vertical.
4. Can you provide details about the market size?
The market size is estimated to be USD 17.16 Million as of 2022.
5. What are some drivers contributing to market growth?
Food and Beverage Segment to Witness Significant Growth; Growing Number of QSR Aids to Market Growth.
6. What are the notable trends driving market growth?
Food and Beverage Segment to Witness Significant Growth.
7. Are there any restraints impacting market growth?
Various Regulations Pertaining to Plastic Usage.
8. Can you provide examples of recent developments in the market?
April 2023 - Greiner Packaging, Engel, and Brink have jointly developed a thin-walled cup of rPET that can be produced using injection molding technology and claims to reduce CO2 equivalent CO2e emissions.
9. What pricing options are available for accessing the report?
Pricing options include single-user, multi-user, and enterprise licenses priced at USD 4750, USD 5250, and USD 8750 respectively.
10. Is the market size provided in terms of value or volume?
The market size is provided in terms of value, measured in Million.
11. Are there any specific market keywords associated with the report?
Yes, the market keyword associated with the report is "Cups and Lids Industry," which aids in identifying and referencing the specific market segment covered.
12. How do I determine which pricing option suits my needs best?
The pricing options vary based on user requirements and access needs. Individual users may opt for single-user licenses, while businesses requiring broader access may choose multi-user or enterprise licenses for cost-effective access to the report.
13. Are there any additional resources or data provided in the Cups and Lids Industry report?
While the report offers comprehensive insights, it's advisable to review the specific contents or supplementary materials provided to ascertain if additional resources or data are available.
14. How can I stay updated on further developments or reports in the Cups and Lids Industry?
To stay informed about further developments, trends, and reports in the Cups and Lids Industry, consider subscribing to industry newsletters, following relevant companies and organizations, or regularly checking reputable industry news sources and publications.
Methodology
Step 1 - Identification of Relevant Samples Size from Population Database


Step 2 - Approaches for Defining Global Market Size (Value, Volume* & Price*)

Note*: In applicable scenarios
Step 3 - Data Sources
Primary Research
- Web Analytics
- Survey Reports
- Research Institute
- Latest Research Reports
- Opinion Leaders
Secondary Research
- Annual Reports
- White Paper
- Latest Press Release
- Industry Association
- Paid Database
- Investor Presentations

Step 4 - Data Triangulation
Involves using different sources of information in order to increase the validity of a study
These sources are likely to be stakeholders in a program - participants, other researchers, program staff, other community members, and so on.
Then we put all data in single framework & apply various statistical tools to find out the dynamic on the market.
During the analysis stage, feedback from the stakeholder groups would be compared to determine areas of agreement as well as areas of divergence