
Key Insights
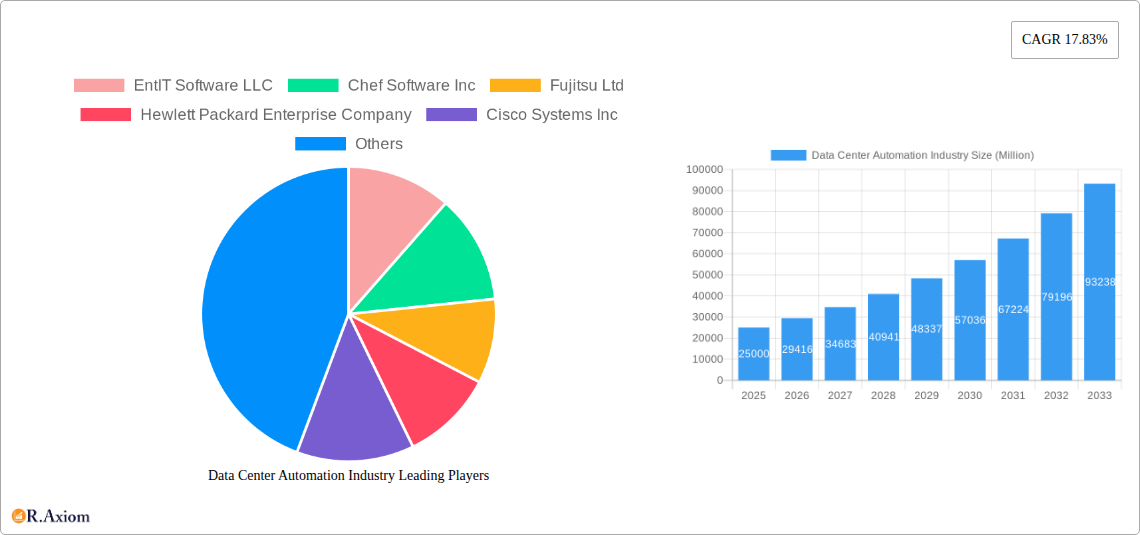
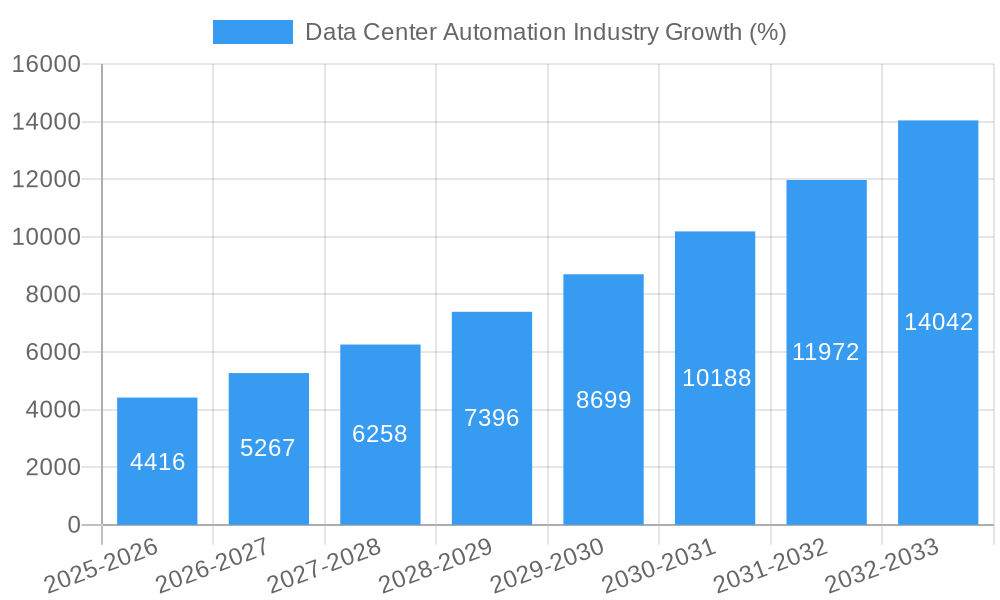
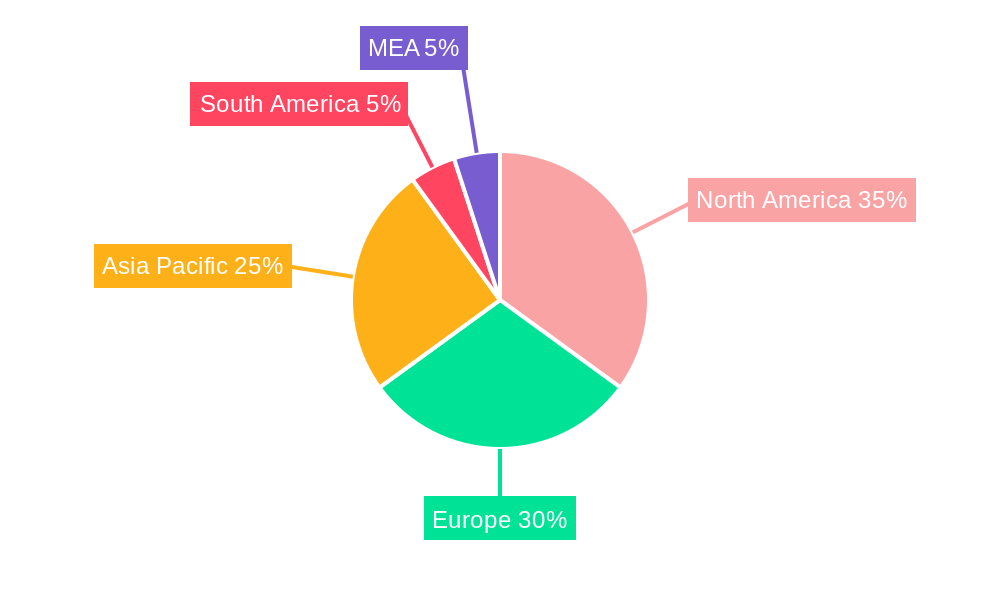
The Data Center Automation market is experiencing robust growth, projected to reach a substantial size by 2033. The 17.83% CAGR signifies a rapidly evolving landscape driven by several key factors. The increasing complexity of data centers, coupled with the burgeoning demand for enhanced efficiency and reduced operational costs, is fueling the adoption of automation solutions. Cloud adoption continues its upward trajectory, significantly impacting the market's growth, as businesses seek scalable and flexible infrastructure. Furthermore, the rising prevalence of AI and machine learning within data center management is creating new opportunities for automation vendors, allowing for proactive problem-solving and predictive maintenance. Segment-wise, the cloud deployment mode is expected to dominate, followed by on-premise solutions. The BFSI, Healthcare, and IT & Telecom verticals represent significant end-user segments due to their stringent regulatory requirements and high data volumes. Within solutions, server and network automation are currently leading, though database automation is gaining rapid traction. Geographically, North America and Europe are currently leading markets, with the Asia-Pacific region projected to witness the fastest growth in the forecast period due to increasing digitalization efforts and expanding data center infrastructure in emerging economies. While some constraints like high initial investment costs and the need for skilled professionals exist, the long-term benefits of improved efficiency, reduced downtime, and enhanced security significantly outweigh these challenges.
The competitive landscape is highly dynamic, with established players like Cisco, Hewlett Packard Enterprise, and Microsoft competing alongside specialized automation vendors. Strategic partnerships, mergers, and acquisitions are common strategies to enhance market presence and technological capabilities. The market's future growth will depend on the continued advancement of automation technologies, including advancements in AI/ML-driven automation, the expansion of 5G networks further boosting the need for automated management, and the increasing adoption of edge computing, driving demand for automation solutions at the network edge. The industry is poised for continued expansion, driven by the ever-growing need for reliable, efficient, and secure data center operations.
This comprehensive report provides an in-depth analysis of the Data Center Automation industry, encompassing market size, growth drivers, key players, and future trends. The study period covers 2019-2033, with 2025 as the base and estimated year. The forecast period is 2025-2033, and the historical period is 2019-2024. This report is crucial for industry stakeholders, investors, and businesses seeking to understand and capitalize on the opportunities within this rapidly evolving market. The total market size in 2025 is estimated to be $xx Million.
Data Center Automation Industry Market Concentration & Innovation
The Data Center Automation market exhibits a moderately concentrated landscape, with several key players holding significant market share. While precise market share figures for each company require further proprietary data analysis, preliminary estimations indicate that companies like VMware Inc, Microsoft Corporation, Cisco Systems Inc, and Dell Inc are among the leading players, collectively commanding a significant portion (estimated at xx%) of the overall market. However, the market is witnessing increased competition from smaller, specialized vendors focusing on niche solutions.
Innovation is a key driver, fueled by the increasing complexity of data centers and the need for greater efficiency. The industry is witnessing rapid advancements in areas like AI/ML-powered network operations, automation orchestration, and cloud-based solutions. Regulatory frameworks, particularly concerning data security and privacy, are increasingly influencing market dynamics, driving demand for robust and compliant automation solutions. Product substitution is limited, as the core functionality offered by automation tools is unique and essential for efficient data center management. However, competition is intense regarding features, pricing, and integration capabilities. Recent M&A activities have been moderate, with deal values averaging $xx Million, primarily focused on strengthening capabilities in specific areas like cloud management or security. End-user trends point towards a strong preference for integrated solutions that streamline workflows and improve overall operational efficiency.
Data Center Automation Industry Industry Trends & Insights
The Data Center Automation market is experiencing robust growth, driven by the exponential increase in data volume, the adoption of cloud computing, and the growing need for enhanced data center efficiency. The market is projected to witness a Compound Annual Growth Rate (CAGR) of xx% during the forecast period (2025-2033). This growth is fueled by several key factors: the rising adoption of cloud-based solutions, increasing demand for automation in hybrid and multi-cloud environments, growing investments in digital transformation initiatives across various sectors, and a shift towards AI-driven automation. Technological disruptions, particularly the advancements in AI, machine learning, and edge computing, are reshaping the industry. Consumer preferences are shifting towards solutions offering enhanced scalability, flexibility, and security. Competitive dynamics are characterized by both intense competition among established players and the emergence of new disruptive technologies. The market penetration of data center automation solutions continues to increase, with a growing number of organizations adopting these solutions to optimize their data center operations.
Dominant Markets & Segments in Data Center Automation Industry
The North American region currently holds the dominant position in the Data Center Automation market, driven by factors such as substantial investments in IT infrastructure, a high concentration of data centers, and early adoption of advanced technologies. However, the Asia-Pacific region is predicted to witness the fastest growth during the forecast period, fueled by rising digitalization efforts across emerging economies and increasing investments in cloud infrastructure.
- By Deployment Mode: The cloud deployment model is experiencing rapid growth, surpassing on-premise deployments due to its scalability, cost-effectiveness, and accessibility.
- By End-user Vertical: The BFSI (Banking, Financial Services, and Insurance) sector is a key driver, followed by the IT and Telecom sector, owing to their stringent security requirements and high data volumes. Healthcare and retail sectors show promising growth potential.
- By Solution: Server automation is the largest segment, closely followed by network automation. Database automation shows significant growth prospects.
- By Data Center Type: Tier III and Tier IV data centers account for a significant portion of the market due to their higher automation requirements.
Key drivers for specific segments include:
- Economic Policies: Government initiatives supporting digital transformation and cloud adoption significantly influence market growth.
- Infrastructure Development: Investments in robust internet infrastructure and data centers are crucial for market expansion.
Data Center Automation Industry Product Developments
Recent product developments are focused on enhancing automation capabilities through AI and ML integration, improving interoperability across different data center components, and providing advanced analytics for proactive management. New products offer better integration with existing IT infrastructure and cloud platforms, emphasizing simplified deployment and management. This focus on user experience and simplified integration is a key competitive advantage. Technological trends like serverless computing and edge computing are driving the development of specialized automation solutions tailored to these specific environments.
Report Scope & Segmentation Analysis
This report comprehensively segments the Data Center Automation market by deployment mode (on-premise, cloud), end-user vertical (BFSI, Healthcare, Retail, Manufacturing, IT & Telecom, Other), solution (Server, Database, Network, Other), and data center type (Tier I, Tier II, Tier III, Tier IV). Each segment’s growth projections, market size, and competitive dynamics are analyzed in detail, providing a granular understanding of the market landscape. The report also projects the market's future growth trajectory based on current trends and anticipated advancements.
Key Drivers of Data Center Automation Industry Growth
The growth of the Data Center Automation industry is fueled by several key drivers. The increasing complexity of modern data centers necessitates automation for efficient management. The rise of cloud computing and the need for hybrid and multi-cloud management solutions are significant factors. Growing data volumes and the need for improved data security further contribute to the market's expansion. Regulatory compliance mandates also push organizations towards implementing robust automation solutions.
Challenges in the Data Center Automation Industry Sector
The Data Center Automation industry faces challenges including high initial investment costs, the complexity of integrating different automation tools, and the need for skilled personnel to manage and maintain the systems. Supply chain disruptions can impact the availability of hardware and software components. Security concerns remain a significant challenge, especially with the growing threat of cyberattacks. The need for robust security measures in automation systems has a quantifiable impact, increasing implementation costs by an estimated xx%.
Emerging Opportunities in Data Center Automation Industry
Emerging opportunities lie in the integration of AI and ML for advanced predictive analytics, automation of edge computing environments, and the development of more secure and resilient automation solutions. The increasing demand for automation in specific industries like healthcare and manufacturing presents significant growth potential. The expansion of 5G networks and the growth of the Internet of Things (IoT) are expected to drive further demand for sophisticated data center automation solutions.
Leading Players in the Data Center Automation Industry Market
- EntIT Software LLC
- Chef Software Inc
- Fujitsu Ltd
- Hewlett Packard Enterprise Company
- Cisco Systems Inc
- Microsoft Corporation
- BMC Software Inc
- Dell Inc
- Oracle Corporation
- Brocade Communications Systems
- ABB Limited
- VMware Inc
- Service Now Inc
- Citrix Systems Inc
Key Developments in Data Center Automation Industry Industry
- October 2022: Augtera Networks announced support for AMD Pensando DPUs, enhancing AI-powered network operations automation.
- September 2022: Juniper Networks released the Apstra extension for adaptive data center management and automation, introducing a new licensing scheme.
These developments illustrate the ongoing innovation and market evolution within the Data Center Automation industry.
Strategic Outlook for Data Center Automation Industry Market
The Data Center Automation market is poised for continued strong growth, driven by the increasing adoption of cloud computing, the growth of big data, and the rising demand for improved data center efficiency and security. The focus on AI-powered automation, along with the development of more integrated and user-friendly solutions, will further propel market expansion. Emerging technologies like edge computing and serverless computing will create new opportunities for specialized automation solutions. The market's long-term growth potential remains significant, particularly in developing regions with increasing digitalization efforts.
Data Center Automation Industry Segmentation
-
1. Solution
- 1.1. Server
- 1.2. Database
- 1.3. Network
- 1.4. Other Solutions
-
2. Data Center Type
- 2.1. Tier 1
- 2.2. Tier 2
- 2.3. Tier 3
- 2.4. Tier 4
-
3. Deployment Mode
- 3.1. On-premise
- 3.2. Cloud
-
4. End-user Vertical
- 4.1. BFSI
- 4.2. Healthcare
- 4.3. Retail
- 4.4. Manufacturing
- 4.5. IT and Telecom
- 4.6. Other End-user Verticals
Data Center Automation Industry Segmentation By Geography
- 1. North America
- 2. Europe
- 3. Asia Pacific
- 4. Latin America
- 5. Middle East
Data Center Automation Industry REPORT HIGHLIGHTS
| Aspects | Details |
|---|---|
| Study Period | 2019-2033 |
| Base Year | 2024 |
| Estimated Year | 2025 |
| Forecast Period | 2025-2033 |
| Historical Period | 2019-2024 |
| Growth Rate | CAGR of 17.83% from 2019-2033 |
| Segmentation |
|
Table of Contents
- 1. Introduction
- 1.1. Research Scope
- 1.2. Market Segmentation
- 1.3. Research Methodology
- 1.4. Definitions and Assumptions
- 2. Executive Summary
- 2.1. Introduction
- 3. Market Dynamics
- 3.1. Introduction
- 3.2. Market Drivers
- 3.2.1. Growth in Cloud Computing and Online Applications; Energy and Cost Efficiency Concerns
- 3.3. Market Restrains
- 3.3.1. Limitation in Storage to Challenge the Market Growth
- 3.4. Market Trends
- 3.4.1. Growth in Cloud Computing and Online Applications
- 4. Market Factor Analysis
- 4.1. Porters Five Forces
- 4.2. Supply/Value Chain
- 4.3. PESTEL analysis
- 4.4. Market Entropy
- 4.5. Patent/Trademark Analysis
- 5. Global Data Center Automation Industry Analysis, Insights and Forecast, 2019-2031
- 5.1. Market Analysis, Insights and Forecast - by Solution
- 5.1.1. Server
- 5.1.2. Database
- 5.1.3. Network
- 5.1.4. Other Solutions
- 5.2. Market Analysis, Insights and Forecast - by Data Center Type
- 5.2.1. Tier 1
- 5.2.2. Tier 2
- 5.2.3. Tier 3
- 5.2.4. Tier 4
- 5.3. Market Analysis, Insights and Forecast - by Deployment Mode
- 5.3.1. On-premise
- 5.3.2. Cloud
- 5.4. Market Analysis, Insights and Forecast - by End-user Vertical
- 5.4.1. BFSI
- 5.4.2. Healthcare
- 5.4.3. Retail
- 5.4.4. Manufacturing
- 5.4.5. IT and Telecom
- 5.4.6. Other End-user Verticals
- 5.5. Market Analysis, Insights and Forecast - by Region
- 5.5.1. North America
- 5.5.2. Europe
- 5.5.3. Asia Pacific
- 5.5.4. Latin America
- 5.5.5. Middle East
- 5.1. Market Analysis, Insights and Forecast - by Solution
- 6. North America Data Center Automation Industry Analysis, Insights and Forecast, 2019-2031
- 6.1. Market Analysis, Insights and Forecast - by Solution
- 6.1.1. Server
- 6.1.2. Database
- 6.1.3. Network
- 6.1.4. Other Solutions
- 6.2. Market Analysis, Insights and Forecast - by Data Center Type
- 6.2.1. Tier 1
- 6.2.2. Tier 2
- 6.2.3. Tier 3
- 6.2.4. Tier 4
- 6.3. Market Analysis, Insights and Forecast - by Deployment Mode
- 6.3.1. On-premise
- 6.3.2. Cloud
- 6.4. Market Analysis, Insights and Forecast - by End-user Vertical
- 6.4.1. BFSI
- 6.4.2. Healthcare
- 6.4.3. Retail
- 6.4.4. Manufacturing
- 6.4.5. IT and Telecom
- 6.4.6. Other End-user Verticals
- 6.1. Market Analysis, Insights and Forecast - by Solution
- 7. Europe Data Center Automation Industry Analysis, Insights and Forecast, 2019-2031
- 7.1. Market Analysis, Insights and Forecast - by Solution
- 7.1.1. Server
- 7.1.2. Database
- 7.1.3. Network
- 7.1.4. Other Solutions
- 7.2. Market Analysis, Insights and Forecast - by Data Center Type
- 7.2.1. Tier 1
- 7.2.2. Tier 2
- 7.2.3. Tier 3
- 7.2.4. Tier 4
- 7.3. Market Analysis, Insights and Forecast - by Deployment Mode
- 7.3.1. On-premise
- 7.3.2. Cloud
- 7.4. Market Analysis, Insights and Forecast - by End-user Vertical
- 7.4.1. BFSI
- 7.4.2. Healthcare
- 7.4.3. Retail
- 7.4.4. Manufacturing
- 7.4.5. IT and Telecom
- 7.4.6. Other End-user Verticals
- 7.1. Market Analysis, Insights and Forecast - by Solution
- 8. Asia Pacific Data Center Automation Industry Analysis, Insights and Forecast, 2019-2031
- 8.1. Market Analysis, Insights and Forecast - by Solution
- 8.1.1. Server
- 8.1.2. Database
- 8.1.3. Network
- 8.1.4. Other Solutions
- 8.2. Market Analysis, Insights and Forecast - by Data Center Type
- 8.2.1. Tier 1
- 8.2.2. Tier 2
- 8.2.3. Tier 3
- 8.2.4. Tier 4
- 8.3. Market Analysis, Insights and Forecast - by Deployment Mode
- 8.3.1. On-premise
- 8.3.2. Cloud
- 8.4. Market Analysis, Insights and Forecast - by End-user Vertical
- 8.4.1. BFSI
- 8.4.2. Healthcare
- 8.4.3. Retail
- 8.4.4. Manufacturing
- 8.4.5. IT and Telecom
- 8.4.6. Other End-user Verticals
- 8.1. Market Analysis, Insights and Forecast - by Solution
- 9. Latin America Data Center Automation Industry Analysis, Insights and Forecast, 2019-2031
- 9.1. Market Analysis, Insights and Forecast - by Solution
- 9.1.1. Server
- 9.1.2. Database
- 9.1.3. Network
- 9.1.4. Other Solutions
- 9.2. Market Analysis, Insights and Forecast - by Data Center Type
- 9.2.1. Tier 1
- 9.2.2. Tier 2
- 9.2.3. Tier 3
- 9.2.4. Tier 4
- 9.3. Market Analysis, Insights and Forecast - by Deployment Mode
- 9.3.1. On-premise
- 9.3.2. Cloud
- 9.4. Market Analysis, Insights and Forecast - by End-user Vertical
- 9.4.1. BFSI
- 9.4.2. Healthcare
- 9.4.3. Retail
- 9.4.4. Manufacturing
- 9.4.5. IT and Telecom
- 9.4.6. Other End-user Verticals
- 9.1. Market Analysis, Insights and Forecast - by Solution
- 10. Middle East Data Center Automation Industry Analysis, Insights and Forecast, 2019-2031
- 10.1. Market Analysis, Insights and Forecast - by Solution
- 10.1.1. Server
- 10.1.2. Database
- 10.1.3. Network
- 10.1.4. Other Solutions
- 10.2. Market Analysis, Insights and Forecast - by Data Center Type
- 10.2.1. Tier 1
- 10.2.2. Tier 2
- 10.2.3. Tier 3
- 10.2.4. Tier 4
- 10.3. Market Analysis, Insights and Forecast - by Deployment Mode
- 10.3.1. On-premise
- 10.3.2. Cloud
- 10.4. Market Analysis, Insights and Forecast - by End-user Vertical
- 10.4.1. BFSI
- 10.4.2. Healthcare
- 10.4.3. Retail
- 10.4.4. Manufacturing
- 10.4.5. IT and Telecom
- 10.4.6. Other End-user Verticals
- 10.1. Market Analysis, Insights and Forecast - by Solution
- 11. North America Data Center Automation Industry Analysis, Insights and Forecast, 2019-2031
- 11.1. Market Analysis, Insights and Forecast - By Country/Sub-region
- 11.1.1 United States
- 11.1.2 Canada
- 11.1.3 Mexico
- 12. Europe Data Center Automation Industry Analysis, Insights and Forecast, 2019-2031
- 12.1. Market Analysis, Insights and Forecast - By Country/Sub-region
- 12.1.1 Germany
- 12.1.2 United Kingdom
- 12.1.3 France
- 12.1.4 Spain
- 12.1.5 Italy
- 12.1.6 Spain
- 12.1.7 Belgium
- 12.1.8 Netherland
- 12.1.9 Nordics
- 12.1.10 Rest of Europe
- 13. Asia Pacific Data Center Automation Industry Analysis, Insights and Forecast, 2019-2031
- 13.1. Market Analysis, Insights and Forecast - By Country/Sub-region
- 13.1.1 China
- 13.1.2 Japan
- 13.1.3 India
- 13.1.4 South Korea
- 13.1.5 Southeast Asia
- 13.1.6 Australia
- 13.1.7 Indonesia
- 13.1.8 Phillipes
- 13.1.9 Singapore
- 13.1.10 Thailandc
- 13.1.11 Rest of Asia Pacific
- 14. South America Data Center Automation Industry Analysis, Insights and Forecast, 2019-2031
- 14.1. Market Analysis, Insights and Forecast - By Country/Sub-region
- 14.1.1 Brazil
- 14.1.2 Argentina
- 14.1.3 Peru
- 14.1.4 Chile
- 14.1.5 Colombia
- 14.1.6 Ecuador
- 14.1.7 Venezuela
- 14.1.8 Rest of South America
- 15. North America Data Center Automation Industry Analysis, Insights and Forecast, 2019-2031
- 15.1. Market Analysis, Insights and Forecast - By Country/Sub-region
- 15.1.1 United States
- 15.1.2 Canada
- 15.1.3 Mexico
- 16. MEA Data Center Automation Industry Analysis, Insights and Forecast, 2019-2031
- 16.1. Market Analysis, Insights and Forecast - By Country/Sub-region
- 16.1.1 United Arab Emirates
- 16.1.2 Saudi Arabia
- 16.1.3 South Africa
- 16.1.4 Rest of Middle East and Africa
- 17. Competitive Analysis
- 17.1. Global Market Share Analysis 2024
- 17.2. Company Profiles
- 17.2.1 EntIT Software LLC
- 17.2.1.1. Overview
- 17.2.1.2. Products
- 17.2.1.3. SWOT Analysis
- 17.2.1.4. Recent Developments
- 17.2.1.5. Financials (Based on Availability)
- 17.2.2 Chef Software Inc
- 17.2.2.1. Overview
- 17.2.2.2. Products
- 17.2.2.3. SWOT Analysis
- 17.2.2.4. Recent Developments
- 17.2.2.5. Financials (Based on Availability)
- 17.2.3 Fujitsu Ltd
- 17.2.3.1. Overview
- 17.2.3.2. Products
- 17.2.3.3. SWOT Analysis
- 17.2.3.4. Recent Developments
- 17.2.3.5. Financials (Based on Availability)
- 17.2.4 Hewlett Packard Enterprise Company
- 17.2.4.1. Overview
- 17.2.4.2. Products
- 17.2.4.3. SWOT Analysis
- 17.2.4.4. Recent Developments
- 17.2.4.5. Financials (Based on Availability)
- 17.2.5 Cisco Systems Inc
- 17.2.5.1. Overview
- 17.2.5.2. Products
- 17.2.5.3. SWOT Analysis
- 17.2.5.4. Recent Developments
- 17.2.5.5. Financials (Based on Availability)
- 17.2.6 Microsoft Corporation
- 17.2.6.1. Overview
- 17.2.6.2. Products
- 17.2.6.3. SWOT Analysis
- 17.2.6.4. Recent Developments
- 17.2.6.5. Financials (Based on Availability)
- 17.2.7 BMC Software Inc
- 17.2.7.1. Overview
- 17.2.7.2. Products
- 17.2.7.3. SWOT Analysis
- 17.2.7.4. Recent Developments
- 17.2.7.5. Financials (Based on Availability)
- 17.2.8 Dell Inc
- 17.2.8.1. Overview
- 17.2.8.2. Products
- 17.2.8.3. SWOT Analysis
- 17.2.8.4. Recent Developments
- 17.2.8.5. Financials (Based on Availability)
- 17.2.9 Oracle Corporation
- 17.2.9.1. Overview
- 17.2.9.2. Products
- 17.2.9.3. SWOT Analysis
- 17.2.9.4. Recent Developments
- 17.2.9.5. Financials (Based on Availability)
- 17.2.10 Brocade Communications Systems
- 17.2.10.1. Overview
- 17.2.10.2. Products
- 17.2.10.3. SWOT Analysis
- 17.2.10.4. Recent Developments
- 17.2.10.5. Financials (Based on Availability)
- 17.2.11 ABB Limited
- 17.2.11.1. Overview
- 17.2.11.2. Products
- 17.2.11.3. SWOT Analysis
- 17.2.11.4. Recent Developments
- 17.2.11.5. Financials (Based on Availability)
- 17.2.12 VMware Inc
- 17.2.12.1. Overview
- 17.2.12.2. Products
- 17.2.12.3. SWOT Analysis
- 17.2.12.4. Recent Developments
- 17.2.12.5. Financials (Based on Availability)
- 17.2.13 Service Now Inc
- 17.2.13.1. Overview
- 17.2.13.2. Products
- 17.2.13.3. SWOT Analysis
- 17.2.13.4. Recent Developments
- 17.2.13.5. Financials (Based on Availability)
- 17.2.14 Citrix Systems Inc
- 17.2.14.1. Overview
- 17.2.14.2. Products
- 17.2.14.3. SWOT Analysis
- 17.2.14.4. Recent Developments
- 17.2.14.5. Financials (Based on Availability)
- 17.2.1 EntIT Software LLC
List of Figures
- Figure 1: Global Data Center Automation Industry Revenue Breakdown (Million, %) by Region 2024 & 2032
- Figure 2: North America Data Center Automation Industry Revenue (Million), by Country 2024 & 2032
- Figure 3: North America Data Center Automation Industry Revenue Share (%), by Country 2024 & 2032
- Figure 4: Europe Data Center Automation Industry Revenue (Million), by Country 2024 & 2032
- Figure 5: Europe Data Center Automation Industry Revenue Share (%), by Country 2024 & 2032
- Figure 6: Asia Pacific Data Center Automation Industry Revenue (Million), by Country 2024 & 2032
- Figure 7: Asia Pacific Data Center Automation Industry Revenue Share (%), by Country 2024 & 2032
- Figure 8: South America Data Center Automation Industry Revenue (Million), by Country 2024 & 2032
- Figure 9: South America Data Center Automation Industry Revenue Share (%), by Country 2024 & 2032
- Figure 10: North America Data Center Automation Industry Revenue (Million), by Country 2024 & 2032
- Figure 11: North America Data Center Automation Industry Revenue Share (%), by Country 2024 & 2032
- Figure 12: MEA Data Center Automation Industry Revenue (Million), by Country 2024 & 2032
- Figure 13: MEA Data Center Automation Industry Revenue Share (%), by Country 2024 & 2032
- Figure 14: North America Data Center Automation Industry Revenue (Million), by Solution 2024 & 2032
- Figure 15: North America Data Center Automation Industry Revenue Share (%), by Solution 2024 & 2032
- Figure 16: North America Data Center Automation Industry Revenue (Million), by Data Center Type 2024 & 2032
- Figure 17: North America Data Center Automation Industry Revenue Share (%), by Data Center Type 2024 & 2032
- Figure 18: North America Data Center Automation Industry Revenue (Million), by Deployment Mode 2024 & 2032
- Figure 19: North America Data Center Automation Industry Revenue Share (%), by Deployment Mode 2024 & 2032
- Figure 20: North America Data Center Automation Industry Revenue (Million), by End-user Vertical 2024 & 2032
- Figure 21: North America Data Center Automation Industry Revenue Share (%), by End-user Vertical 2024 & 2032
- Figure 22: North America Data Center Automation Industry Revenue (Million), by Country 2024 & 2032
- Figure 23: North America Data Center Automation Industry Revenue Share (%), by Country 2024 & 2032
- Figure 24: Europe Data Center Automation Industry Revenue (Million), by Solution 2024 & 2032
- Figure 25: Europe Data Center Automation Industry Revenue Share (%), by Solution 2024 & 2032
- Figure 26: Europe Data Center Automation Industry Revenue (Million), by Data Center Type 2024 & 2032
- Figure 27: Europe Data Center Automation Industry Revenue Share (%), by Data Center Type 2024 & 2032
- Figure 28: Europe Data Center Automation Industry Revenue (Million), by Deployment Mode 2024 & 2032
- Figure 29: Europe Data Center Automation Industry Revenue Share (%), by Deployment Mode 2024 & 2032
- Figure 30: Europe Data Center Automation Industry Revenue (Million), by End-user Vertical 2024 & 2032
- Figure 31: Europe Data Center Automation Industry Revenue Share (%), by End-user Vertical 2024 & 2032
- Figure 32: Europe Data Center Automation Industry Revenue (Million), by Country 2024 & 2032
- Figure 33: Europe Data Center Automation Industry Revenue Share (%), by Country 2024 & 2032
- Figure 34: Asia Pacific Data Center Automation Industry Revenue (Million), by Solution 2024 & 2032
- Figure 35: Asia Pacific Data Center Automation Industry Revenue Share (%), by Solution 2024 & 2032
- Figure 36: Asia Pacific Data Center Automation Industry Revenue (Million), by Data Center Type 2024 & 2032
- Figure 37: Asia Pacific Data Center Automation Industry Revenue Share (%), by Data Center Type 2024 & 2032
- Figure 38: Asia Pacific Data Center Automation Industry Revenue (Million), by Deployment Mode 2024 & 2032
- Figure 39: Asia Pacific Data Center Automation Industry Revenue Share (%), by Deployment Mode 2024 & 2032
- Figure 40: Asia Pacific Data Center Automation Industry Revenue (Million), by End-user Vertical 2024 & 2032
- Figure 41: Asia Pacific Data Center Automation Industry Revenue Share (%), by End-user Vertical 2024 & 2032
- Figure 42: Asia Pacific Data Center Automation Industry Revenue (Million), by Country 2024 & 2032
- Figure 43: Asia Pacific Data Center Automation Industry Revenue Share (%), by Country 2024 & 2032
- Figure 44: Latin America Data Center Automation Industry Revenue (Million), by Solution 2024 & 2032
- Figure 45: Latin America Data Center Automation Industry Revenue Share (%), by Solution 2024 & 2032
- Figure 46: Latin America Data Center Automation Industry Revenue (Million), by Data Center Type 2024 & 2032
- Figure 47: Latin America Data Center Automation Industry Revenue Share (%), by Data Center Type 2024 & 2032
- Figure 48: Latin America Data Center Automation Industry Revenue (Million), by Deployment Mode 2024 & 2032
- Figure 49: Latin America Data Center Automation Industry Revenue Share (%), by Deployment Mode 2024 & 2032
- Figure 50: Latin America Data Center Automation Industry Revenue (Million), by End-user Vertical 2024 & 2032
- Figure 51: Latin America Data Center Automation Industry Revenue Share (%), by End-user Vertical 2024 & 2032
- Figure 52: Latin America Data Center Automation Industry Revenue (Million), by Country 2024 & 2032
- Figure 53: Latin America Data Center Automation Industry Revenue Share (%), by Country 2024 & 2032
- Figure 54: Middle East Data Center Automation Industry Revenue (Million), by Solution 2024 & 2032
- Figure 55: Middle East Data Center Automation Industry Revenue Share (%), by Solution 2024 & 2032
- Figure 56: Middle East Data Center Automation Industry Revenue (Million), by Data Center Type 2024 & 2032
- Figure 57: Middle East Data Center Automation Industry Revenue Share (%), by Data Center Type 2024 & 2032
- Figure 58: Middle East Data Center Automation Industry Revenue (Million), by Deployment Mode 2024 & 2032
- Figure 59: Middle East Data Center Automation Industry Revenue Share (%), by Deployment Mode 2024 & 2032
- Figure 60: Middle East Data Center Automation Industry Revenue (Million), by End-user Vertical 2024 & 2032
- Figure 61: Middle East Data Center Automation Industry Revenue Share (%), by End-user Vertical 2024 & 2032
- Figure 62: Middle East Data Center Automation Industry Revenue (Million), by Country 2024 & 2032
- Figure 63: Middle East Data Center Automation Industry Revenue Share (%), by Country 2024 & 2032
List of Tables
- Table 1: Global Data Center Automation Industry Revenue Million Forecast, by Region 2019 & 2032
- Table 2: Global Data Center Automation Industry Revenue Million Forecast, by Solution 2019 & 2032
- Table 3: Global Data Center Automation Industry Revenue Million Forecast, by Data Center Type 2019 & 2032
- Table 4: Global Data Center Automation Industry Revenue Million Forecast, by Deployment Mode 2019 & 2032
- Table 5: Global Data Center Automation Industry Revenue Million Forecast, by End-user Vertical 2019 & 2032
- Table 6: Global Data Center Automation Industry Revenue Million Forecast, by Region 2019 & 2032
- Table 7: Global Data Center Automation Industry Revenue Million Forecast, by Country 2019 & 2032
- Table 8: United States Data Center Automation Industry Revenue (Million) Forecast, by Application 2019 & 2032
- Table 9: Canada Data Center Automation Industry Revenue (Million) Forecast, by Application 2019 & 2032
- Table 10: Mexico Data Center Automation Industry Revenue (Million) Forecast, by Application 2019 & 2032
- Table 11: Global Data Center Automation Industry Revenue Million Forecast, by Country 2019 & 2032
- Table 12: Germany Data Center Automation Industry Revenue (Million) Forecast, by Application 2019 & 2032
- Table 13: United Kingdom Data Center Automation Industry Revenue (Million) Forecast, by Application 2019 & 2032
- Table 14: France Data Center Automation Industry Revenue (Million) Forecast, by Application 2019 & 2032
- Table 15: Spain Data Center Automation Industry Revenue (Million) Forecast, by Application 2019 & 2032
- Table 16: Italy Data Center Automation Industry Revenue (Million) Forecast, by Application 2019 & 2032
- Table 17: Spain Data Center Automation Industry Revenue (Million) Forecast, by Application 2019 & 2032
- Table 18: Belgium Data Center Automation Industry Revenue (Million) Forecast, by Application 2019 & 2032
- Table 19: Netherland Data Center Automation Industry Revenue (Million) Forecast, by Application 2019 & 2032
- Table 20: Nordics Data Center Automation Industry Revenue (Million) Forecast, by Application 2019 & 2032
- Table 21: Rest of Europe Data Center Automation Industry Revenue (Million) Forecast, by Application 2019 & 2032
- Table 22: Global Data Center Automation Industry Revenue Million Forecast, by Country 2019 & 2032
- Table 23: China Data Center Automation Industry Revenue (Million) Forecast, by Application 2019 & 2032
- Table 24: Japan Data Center Automation Industry Revenue (Million) Forecast, by Application 2019 & 2032
- Table 25: India Data Center Automation Industry Revenue (Million) Forecast, by Application 2019 & 2032
- Table 26: South Korea Data Center Automation Industry Revenue (Million) Forecast, by Application 2019 & 2032
- Table 27: Southeast Asia Data Center Automation Industry Revenue (Million) Forecast, by Application 2019 & 2032
- Table 28: Australia Data Center Automation Industry Revenue (Million) Forecast, by Application 2019 & 2032
- Table 29: Indonesia Data Center Automation Industry Revenue (Million) Forecast, by Application 2019 & 2032
- Table 30: Phillipes Data Center Automation Industry Revenue (Million) Forecast, by Application 2019 & 2032
- Table 31: Singapore Data Center Automation Industry Revenue (Million) Forecast, by Application 2019 & 2032
- Table 32: Thailandc Data Center Automation Industry Revenue (Million) Forecast, by Application 2019 & 2032
- Table 33: Rest of Asia Pacific Data Center Automation Industry Revenue (Million) Forecast, by Application 2019 & 2032
- Table 34: Global Data Center Automation Industry Revenue Million Forecast, by Country 2019 & 2032
- Table 35: Brazil Data Center Automation Industry Revenue (Million) Forecast, by Application 2019 & 2032
- Table 36: Argentina Data Center Automation Industry Revenue (Million) Forecast, by Application 2019 & 2032
- Table 37: Peru Data Center Automation Industry Revenue (Million) Forecast, by Application 2019 & 2032
- Table 38: Chile Data Center Automation Industry Revenue (Million) Forecast, by Application 2019 & 2032
- Table 39: Colombia Data Center Automation Industry Revenue (Million) Forecast, by Application 2019 & 2032
- Table 40: Ecuador Data Center Automation Industry Revenue (Million) Forecast, by Application 2019 & 2032
- Table 41: Venezuela Data Center Automation Industry Revenue (Million) Forecast, by Application 2019 & 2032
- Table 42: Rest of South America Data Center Automation Industry Revenue (Million) Forecast, by Application 2019 & 2032
- Table 43: Global Data Center Automation Industry Revenue Million Forecast, by Country 2019 & 2032
- Table 44: United States Data Center Automation Industry Revenue (Million) Forecast, by Application 2019 & 2032
- Table 45: Canada Data Center Automation Industry Revenue (Million) Forecast, by Application 2019 & 2032
- Table 46: Mexico Data Center Automation Industry Revenue (Million) Forecast, by Application 2019 & 2032
- Table 47: Global Data Center Automation Industry Revenue Million Forecast, by Country 2019 & 2032
- Table 48: United Arab Emirates Data Center Automation Industry Revenue (Million) Forecast, by Application 2019 & 2032
- Table 49: Saudi Arabia Data Center Automation Industry Revenue (Million) Forecast, by Application 2019 & 2032
- Table 50: South Africa Data Center Automation Industry Revenue (Million) Forecast, by Application 2019 & 2032
- Table 51: Rest of Middle East and Africa Data Center Automation Industry Revenue (Million) Forecast, by Application 2019 & 2032
- Table 52: Global Data Center Automation Industry Revenue Million Forecast, by Solution 2019 & 2032
- Table 53: Global Data Center Automation Industry Revenue Million Forecast, by Data Center Type 2019 & 2032
- Table 54: Global Data Center Automation Industry Revenue Million Forecast, by Deployment Mode 2019 & 2032
- Table 55: Global Data Center Automation Industry Revenue Million Forecast, by End-user Vertical 2019 & 2032
- Table 56: Global Data Center Automation Industry Revenue Million Forecast, by Country 2019 & 2032
- Table 57: Global Data Center Automation Industry Revenue Million Forecast, by Solution 2019 & 2032
- Table 58: Global Data Center Automation Industry Revenue Million Forecast, by Data Center Type 2019 & 2032
- Table 59: Global Data Center Automation Industry Revenue Million Forecast, by Deployment Mode 2019 & 2032
- Table 60: Global Data Center Automation Industry Revenue Million Forecast, by End-user Vertical 2019 & 2032
- Table 61: Global Data Center Automation Industry Revenue Million Forecast, by Country 2019 & 2032
- Table 62: Global Data Center Automation Industry Revenue Million Forecast, by Solution 2019 & 2032
- Table 63: Global Data Center Automation Industry Revenue Million Forecast, by Data Center Type 2019 & 2032
- Table 64: Global Data Center Automation Industry Revenue Million Forecast, by Deployment Mode 2019 & 2032
- Table 65: Global Data Center Automation Industry Revenue Million Forecast, by End-user Vertical 2019 & 2032
- Table 66: Global Data Center Automation Industry Revenue Million Forecast, by Country 2019 & 2032
- Table 67: Global Data Center Automation Industry Revenue Million Forecast, by Solution 2019 & 2032
- Table 68: Global Data Center Automation Industry Revenue Million Forecast, by Data Center Type 2019 & 2032
- Table 69: Global Data Center Automation Industry Revenue Million Forecast, by Deployment Mode 2019 & 2032
- Table 70: Global Data Center Automation Industry Revenue Million Forecast, by End-user Vertical 2019 & 2032
- Table 71: Global Data Center Automation Industry Revenue Million Forecast, by Country 2019 & 2032
- Table 72: Global Data Center Automation Industry Revenue Million Forecast, by Solution 2019 & 2032
- Table 73: Global Data Center Automation Industry Revenue Million Forecast, by Data Center Type 2019 & 2032
- Table 74: Global Data Center Automation Industry Revenue Million Forecast, by Deployment Mode 2019 & 2032
- Table 75: Global Data Center Automation Industry Revenue Million Forecast, by End-user Vertical 2019 & 2032
- Table 76: Global Data Center Automation Industry Revenue Million Forecast, by Country 2019 & 2032
Frequently Asked Questions
1. What is the projected Compound Annual Growth Rate (CAGR) of the Data Center Automation Industry?
The projected CAGR is approximately 17.83%.
2. Which companies are prominent players in the Data Center Automation Industry?
Key companies in the market include EntIT Software LLC, Chef Software Inc, Fujitsu Ltd, Hewlett Packard Enterprise Company, Cisco Systems Inc, Microsoft Corporation, BMC Software Inc, Dell Inc, Oracle Corporation, Brocade Communications Systems, ABB Limited, VMware Inc, Service Now Inc, Citrix Systems Inc.
3. What are the main segments of the Data Center Automation Industry?
The market segments include Solution, Data Center Type, Deployment Mode, End-user Vertical.
4. Can you provide details about the market size?
The market size is estimated to be USD XX Million as of 2022.
5. What are some drivers contributing to market growth?
Growth in Cloud Computing and Online Applications; Energy and Cost Efficiency Concerns.
6. What are the notable trends driving market growth?
Growth in Cloud Computing and Online Applications.
7. Are there any restraints impacting market growth?
Limitation in Storage to Challenge the Market Growth.
8. Can you provide examples of recent developments in the market?
October 2022: Augtera Networks, one of the prominent players in AI/ML-powered Network Operations Solutions, announced its support for AMD Pensando DPUs, which will enable purpose-built Network AI in next-generation data centers. By automating anomaly detection, problem root identification, noise elimination, and alerting of collaboration and ticketing applications like Slack and ServiceNow, Augtera Network AI makes network administration easier.
9. What pricing options are available for accessing the report?
Pricing options include single-user, multi-user, and enterprise licenses priced at USD 4750, USD 5250, and USD 8750 respectively.
10. Is the market size provided in terms of value or volume?
The market size is provided in terms of value, measured in Million.
11. Are there any specific market keywords associated with the report?
Yes, the market keyword associated with the report is "Data Center Automation Industry," which aids in identifying and referencing the specific market segment covered.
12. How do I determine which pricing option suits my needs best?
The pricing options vary based on user requirements and access needs. Individual users may opt for single-user licenses, while businesses requiring broader access may choose multi-user or enterprise licenses for cost-effective access to the report.
13. Are there any additional resources or data provided in the Data Center Automation Industry report?
While the report offers comprehensive insights, it's advisable to review the specific contents or supplementary materials provided to ascertain if additional resources or data are available.
14. How can I stay updated on further developments or reports in the Data Center Automation Industry?
To stay informed about further developments, trends, and reports in the Data Center Automation Industry, consider subscribing to industry newsletters, following relevant companies and organizations, or regularly checking reputable industry news sources and publications.
Methodology
Step 1 - Identification of Relevant Samples Size from Population Database


Step 2 - Approaches for Defining Global Market Size (Value, Volume* & Price*)

Note*: In applicable scenarios
Step 3 - Data Sources
Primary Research
- Web Analytics
- Survey Reports
- Research Institute
- Latest Research Reports
- Opinion Leaders
Secondary Research
- Annual Reports
- White Paper
- Latest Press Release
- Industry Association
- Paid Database
- Investor Presentations

Step 4 - Data Triangulation
Involves using different sources of information in order to increase the validity of a study
These sources are likely to be stakeholders in a program - participants, other researchers, program staff, other community members, and so on.
Then we put all data in single framework & apply various statistical tools to find out the dynamic on the market.
During the analysis stage, feedback from the stakeholder groups would be compared to determine areas of agreement as well as areas of divergence


