
Key Insights
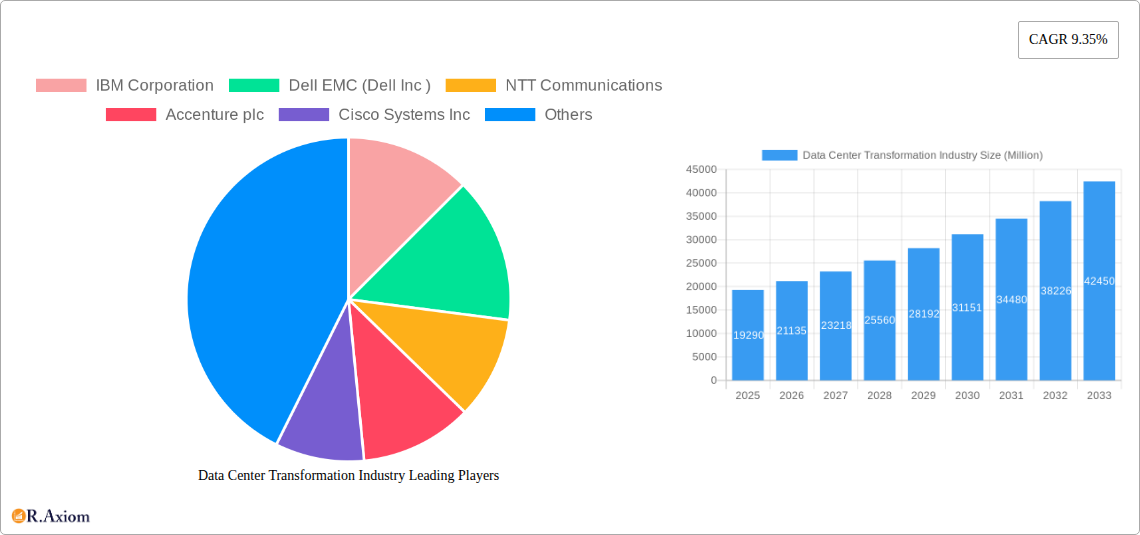
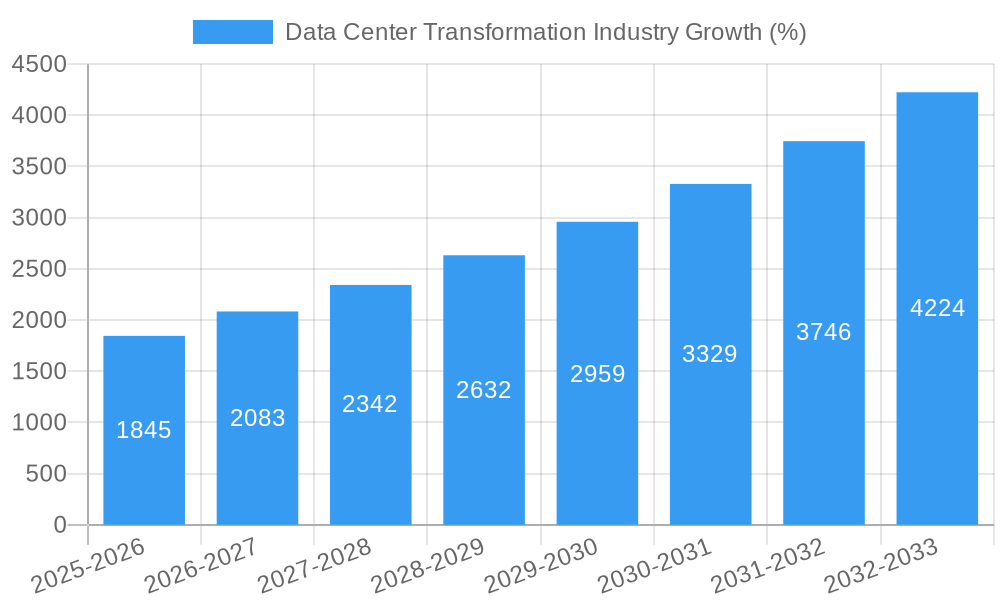
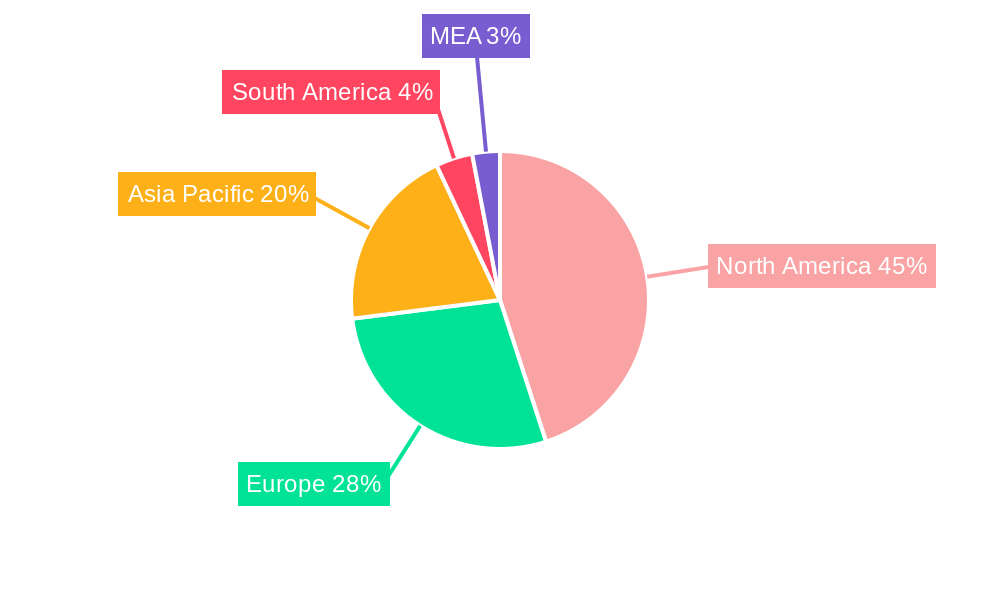
The Data Center Transformation market, valued at $19.29 billion in 2025, is projected to experience robust growth, driven by the increasing adoption of cloud computing, the rise of big data analytics, and the expanding need for enhanced IT infrastructure efficiency and resilience. The market's Compound Annual Growth Rate (CAGR) of 9.35% from 2025 to 2033 indicates a significant expansion, with a projected market size exceeding $40 billion by 2033. Key drivers include the need for improved energy efficiency within data centers, the demand for increased agility and scalability to support fluctuating workloads, and the growing adoption of automation and AI-powered management tools. The market is segmented by data center tier, end-user (data center providers and enterprises), and service type (consolidation, optimization, automation, and infrastructure management). North America currently holds a significant market share, driven by early adoption of advanced technologies and a high concentration of major technology companies. However, the Asia-Pacific region is poised for substantial growth due to increasing digitalization and infrastructure investments. Competition is fierce, with major players like IBM, Dell EMC, NTT Communications, and Accenture competing alongside specialized service providers and system integrators. The ongoing trend of hyperscale data center development and the increasing adoption of edge computing will further fuel market expansion in the coming years.
The competitive landscape is characterized by both established technology vendors and specialized service providers. The need for customized solutions based on individual data center requirements will drive mergers and acquisitions within the market. Constraints on market growth may include the high initial investment costs associated with data center transformation projects, concerns about data security and compliance, and the complexity of integrating new technologies into existing infrastructure. Successful players will need to demonstrate expertise in a range of technologies and possess a deep understanding of customer needs, adapting their solutions to the specific requirements of enterprise clients and hyperscale data center providers alike. Focus on delivering efficient, secure, and scalable solutions will be paramount for achieving long-term success in this dynamic and rapidly evolving market.
Data Center Transformation Industry Market Report: 2019-2033
This comprehensive report provides a detailed analysis of the Data Center Transformation industry, offering valuable insights for stakeholders, investors, and industry professionals. The report covers the period 2019-2033, with a focus on the 2025-2033 forecast period. The base year for this analysis is 2025. The report utilizes a robust methodology incorporating both qualitative and quantitative data to deliver actionable intelligence on market dynamics, technological advancements, and competitive landscapes.
Data Center Transformation Industry Market Concentration & Innovation
The Data Center Transformation market exhibits a moderately concentrated landscape, with several major players holding significant market share. Key players such as IBM Corporation, Dell EMC (Dell Inc), NTT Communications, Accenture plc, Cisco Systems Inc, Schneider Electric SE, Microsoft Corporation, Emerson Network Power Inc, NetApp Inc, Wipro Technologies, HCL Technologies Limited, and Hitachi Vantara Federal Corporation contribute significantly to the overall market revenue. However, the presence of numerous smaller players, particularly in niche segments like specialized automation services, prevents extreme market concentration.
Market share analysis reveals that the top five players collectively command approximately xx% of the global market in 2025, estimated at $xx Million. The remaining share is distributed among numerous smaller companies and regional players. Innovation is a key driver, with companies continuously investing in R&D to develop advanced solutions in areas such as AI-powered infrastructure management, automation, and energy efficiency.
Mergers and acquisitions (M&A) activity has been considerable in recent years, with several large-scale deals shaping the competitive landscape. For example, in 2022, the combined M&A deal value in the sector was estimated at $xx Million, representing a significant consolidation trend. These M&A activities primarily focus on expanding service portfolios, acquiring niche expertise, and increasing geographic reach. Regulatory frameworks, such as those related to data privacy and security, significantly influence industry practices and technology adoption. The industry also witnesses continuous product substitution as new technologies replace older, less efficient infrastructure. Finally, end-user trends, particularly the increasing adoption of cloud computing and the growth of data-intensive applications, drive substantial demand for data center transformation services.
Data Center Transformation Industry Industry Trends & Insights
The Data Center Transformation industry is experiencing robust growth, driven by several key factors. The global market is projected to reach $xx Million by 2033, exhibiting a Compound Annual Growth Rate (CAGR) of xx% during the forecast period (2025-2033). This growth is fuelled by the accelerating adoption of cloud computing, the increasing volume of data generated across various sectors, and the rising need for efficient and secure data center infrastructure.
Technological disruptions, including the advent of edge computing, software-defined networking (SDN), and AI-powered solutions, are transforming data center operations and influencing design choices. Consumer preferences are shifting towards sustainable and energy-efficient data centers, pushing companies to adopt environmentally friendly technologies and practices. Market penetration of AI-driven analytics for predictive maintenance and optimization is rapidly increasing, expected to reach xx% by 2033. The competitive dynamics are intense, with established players and emerging startups vying for market share through innovation, strategic partnerships, and aggressive pricing strategies. The historical period (2019-2024) saw a significant shift towards cloud adoption, leading to considerable growth in the sector.
Dominant Markets & Segments in Data Center Transformation Industry
The North American region holds a dominant position in the Data Center Transformation market, followed by Europe and Asia-Pacific. This dominance is attributed to high technological adoption rates, significant investments in digital infrastructure, and the presence of major technology players.
- By Level of Data Center: Tier 3 and Tier 4 data centers constitute the largest segments, driven by the demand for high availability and reliability from large enterprises and data center providers.
- By End User: Enterprises are the major consumers of data center transformation services, representing approximately xx% of the total market. Data Center Providers make up the remaining xx%, driven by the need for infrastructure upgrades and efficiency gains.
- By Services: Consolidation services, optimization services, and automation services are the primary revenue generators. The increasing need for cost reduction and improved efficiency within data centers boosts these service offerings. Infrastructure management services are also a significant segment due to the complexities involved in managing advanced data center infrastructures. Key drivers for regional dominance vary. For example, North America's robust IT sector and advanced infrastructure greatly influence its market dominance. Similarly, strong government initiatives and a thriving tech industry support the relatively strong position of certain Asian economies.
Data Center Transformation Industry Product Developments
Recent product innovations focus on enhancing efficiency, sustainability, and security within data centers. This includes advancements in AI-driven management platforms, software-defined infrastructure, and energy-efficient cooling solutions. These developments directly address current market needs and deliver competitive advantages by optimizing operations and minimizing environmental impact. The market favors products that provide scalable, flexible, and cost-effective solutions for data center modernization.
Report Scope & Segmentation Analysis
This report segments the Data Center Transformation market by level of data center (Tier 1-4), end-user (Data Center Providers, Enterprises), and services (Consolidation, Optimization, Automation, Infrastructure Management). Each segment shows considerable growth potential, with varying market sizes and competitive dynamics. For example, the Tier 4 segment is expected to show a CAGR of xx% due to demand for high reliability. Similarly, the enterprise segment will grow at a CAGR of xx% fuelled by digital transformation initiatives. The optimization service segment is expected to be the fastest-growing service category due to the focus on cost savings and resource optimization.
Key Drivers of Data Center Transformation Industry Growth
Several factors drive the growth of the Data Center Transformation industry. Technological advancements, such as AI, automation, and SDN, enhance efficiency and reduce operational costs. Economic incentives, such as tax breaks for green technologies, encourage investment in sustainable data centers. Furthermore, increasingly stringent regulatory frameworks regarding data security and environmental compliance push data centers to adopt new technologies and management practices. For instance, the growing adoption of cloud computing directly fuels demand for highly reliable and efficient data center infrastructure, which drives transformation projects.
Challenges in the Data Center Transformation Industry Sector
The Data Center Transformation industry faces several challenges, including regulatory hurdles around data privacy and security, which can increase compliance costs. Supply chain disruptions affecting hardware components can lead to project delays and increased expenses. Intense competition from established players and emerging startups puts pressure on pricing and profitability margins. For example, the semiconductor shortage of 2021-2022 significantly hampered data center upgrade projects, resulting in an estimated $xx Million loss in revenue for the industry.
Emerging Opportunities in Data Center Transformation Industry
The Data Center Transformation industry offers various emerging opportunities. The rise of edge computing creates demand for decentralized data centers requiring advanced transformation solutions. New technologies like quantum computing will necessitate novel data center designs and management strategies. Growing consumer awareness of environmental sustainability opens opportunities for eco-friendly data center solutions. These opportunities present significant potential for innovation and growth in the coming years.
Leading Players in the Data Center Transformation Industry Market
- IBM Corporation
- Dell EMC (Dell Inc)
- NTT Communications
- Accenture plc
- Cisco Systems Inc
- Schneider Electric SE
- Microsoft Corporation
- Emerson Network Power Inc
- NetApp Inc
- Wipro Technologies
- HCL Technologies Limited
- Hitachi Vantara Federal Corporation
Key Developments in Data Center Transformation Industry Industry
- September 2023: Schneider Electric SE launched an industry-first guide for AI-optimized data center design, significantly impacting the industry's approach to AI-driven workloads.
- January 2022: Kyndryl partnered with Google Cloud, accelerating digital transformation projects and promoting data-driven sustainability initiatives.
- January 2022: Microsoft Corporation announced plans to build highly sustainable data centers in Sweden, highlighting the growing emphasis on eco-friendly infrastructure.
Strategic Outlook for Data Center Transformation Industry Market
The Data Center Transformation market is poised for continued growth, driven by the ever-increasing demand for digital services and the need for efficient, sustainable, and secure data center infrastructure. Emerging technologies and evolving consumer preferences present significant opportunities for innovation and expansion. Companies that successfully adapt to these changes and invest in R&D are best positioned to capitalize on the market's future potential. The long-term outlook is positive, with considerable growth projected across all segments.
Data Center Transformation Industry Segmentation
-
1. Services
- 1.1. Consolidation Services
- 1.2. Optimization Services
- 1.3. Automation Services
- 1.4. Infrastructure Management
-
2. Level of Data Center
- 2.1. Tier 1
- 2.2. Tier 2
- 2.3. Tier 3
- 2.4. Tier 4
-
3. End User
- 3.1. Data Center Providers
-
3.2. Enterprises
- 3.2.1. IT and Telecom
- 3.2.2. BFSI
- 3.2.3. Healthcare
- 3.2.4. Retail
- 3.2.5. Manufacturing
- 3.2.6. Aerospace, Defense, and Intelligence
- 3.2.7. Other End Users
Data Center Transformation Industry Segmentation By Geography
- 1. North America
- 2. Europe
- 3. Asia Pacific
- 4. Latin America
- 5. Middle East
Data Center Transformation Industry REPORT HIGHLIGHTS
| Aspects | Details |
|---|---|
| Study Period | 2019-2033 |
| Base Year | 2024 |
| Estimated Year | 2025 |
| Forecast Period | 2025-2033 |
| Historical Period | 2019-2024 |
| Growth Rate | CAGR of 9.35% from 2019-2033 |
| Segmentation |
|
Table of Contents
- 1. Introduction
- 1.1. Research Scope
- 1.2. Market Segmentation
- 1.3. Research Methodology
- 1.4. Definitions and Assumptions
- 2. Executive Summary
- 2.1. Introduction
- 3. Market Dynamics
- 3.1. Introduction
- 3.2. Market Drivers
- 3.2.1. Need to Reduce Costs and Increase Efficiency of Data Centers; Adoption of Cloud-based Services; Increasing Significance of E-commerce Databases are Expected to Grow at a Significant Rate
- 3.3. Market Restrains
- 3.3.1. ROI Concerns Over the Investment across Low Load Data Centers
- 3.4. Market Trends
- 3.4.1. Increasing Significance of E-commerce Databases are Expected to Grow at a Significant Rate
- 4. Market Factor Analysis
- 4.1. Porters Five Forces
- 4.2. Supply/Value Chain
- 4.3. PESTEL analysis
- 4.4. Market Entropy
- 4.5. Patent/Trademark Analysis
- 5. Global Data Center Transformation Industry Analysis, Insights and Forecast, 2019-2031
- 5.1. Market Analysis, Insights and Forecast - by Services
- 5.1.1. Consolidation Services
- 5.1.2. Optimization Services
- 5.1.3. Automation Services
- 5.1.4. Infrastructure Management
- 5.2. Market Analysis, Insights and Forecast - by Level of Data Center
- 5.2.1. Tier 1
- 5.2.2. Tier 2
- 5.2.3. Tier 3
- 5.2.4. Tier 4
- 5.3. Market Analysis, Insights and Forecast - by End User
- 5.3.1. Data Center Providers
- 5.3.2. Enterprises
- 5.3.2.1. IT and Telecom
- 5.3.2.2. BFSI
- 5.3.2.3. Healthcare
- 5.3.2.4. Retail
- 5.3.2.5. Manufacturing
- 5.3.2.6. Aerospace, Defense, and Intelligence
- 5.3.2.7. Other End Users
- 5.4. Market Analysis, Insights and Forecast - by Region
- 5.4.1. North America
- 5.4.2. Europe
- 5.4.3. Asia Pacific
- 5.4.4. Latin America
- 5.4.5. Middle East
- 5.1. Market Analysis, Insights and Forecast - by Services
- 6. North America Data Center Transformation Industry Analysis, Insights and Forecast, 2019-2031
- 6.1. Market Analysis, Insights and Forecast - by Services
- 6.1.1. Consolidation Services
- 6.1.2. Optimization Services
- 6.1.3. Automation Services
- 6.1.4. Infrastructure Management
- 6.2. Market Analysis, Insights and Forecast - by Level of Data Center
- 6.2.1. Tier 1
- 6.2.2. Tier 2
- 6.2.3. Tier 3
- 6.2.4. Tier 4
- 6.3. Market Analysis, Insights and Forecast - by End User
- 6.3.1. Data Center Providers
- 6.3.2. Enterprises
- 6.3.2.1. IT and Telecom
- 6.3.2.2. BFSI
- 6.3.2.3. Healthcare
- 6.3.2.4. Retail
- 6.3.2.5. Manufacturing
- 6.3.2.6. Aerospace, Defense, and Intelligence
- 6.3.2.7. Other End Users
- 6.1. Market Analysis, Insights and Forecast - by Services
- 7. Europe Data Center Transformation Industry Analysis, Insights and Forecast, 2019-2031
- 7.1. Market Analysis, Insights and Forecast - by Services
- 7.1.1. Consolidation Services
- 7.1.2. Optimization Services
- 7.1.3. Automation Services
- 7.1.4. Infrastructure Management
- 7.2. Market Analysis, Insights and Forecast - by Level of Data Center
- 7.2.1. Tier 1
- 7.2.2. Tier 2
- 7.2.3. Tier 3
- 7.2.4. Tier 4
- 7.3. Market Analysis, Insights and Forecast - by End User
- 7.3.1. Data Center Providers
- 7.3.2. Enterprises
- 7.3.2.1. IT and Telecom
- 7.3.2.2. BFSI
- 7.3.2.3. Healthcare
- 7.3.2.4. Retail
- 7.3.2.5. Manufacturing
- 7.3.2.6. Aerospace, Defense, and Intelligence
- 7.3.2.7. Other End Users
- 7.1. Market Analysis, Insights and Forecast - by Services
- 8. Asia Pacific Data Center Transformation Industry Analysis, Insights and Forecast, 2019-2031
- 8.1. Market Analysis, Insights and Forecast - by Services
- 8.1.1. Consolidation Services
- 8.1.2. Optimization Services
- 8.1.3. Automation Services
- 8.1.4. Infrastructure Management
- 8.2. Market Analysis, Insights and Forecast - by Level of Data Center
- 8.2.1. Tier 1
- 8.2.2. Tier 2
- 8.2.3. Tier 3
- 8.2.4. Tier 4
- 8.3. Market Analysis, Insights and Forecast - by End User
- 8.3.1. Data Center Providers
- 8.3.2. Enterprises
- 8.3.2.1. IT and Telecom
- 8.3.2.2. BFSI
- 8.3.2.3. Healthcare
- 8.3.2.4. Retail
- 8.3.2.5. Manufacturing
- 8.3.2.6. Aerospace, Defense, and Intelligence
- 8.3.2.7. Other End Users
- 8.1. Market Analysis, Insights and Forecast - by Services
- 9. Latin America Data Center Transformation Industry Analysis, Insights and Forecast, 2019-2031
- 9.1. Market Analysis, Insights and Forecast - by Services
- 9.1.1. Consolidation Services
- 9.1.2. Optimization Services
- 9.1.3. Automation Services
- 9.1.4. Infrastructure Management
- 9.2. Market Analysis, Insights and Forecast - by Level of Data Center
- 9.2.1. Tier 1
- 9.2.2. Tier 2
- 9.2.3. Tier 3
- 9.2.4. Tier 4
- 9.3. Market Analysis, Insights and Forecast - by End User
- 9.3.1. Data Center Providers
- 9.3.2. Enterprises
- 9.3.2.1. IT and Telecom
- 9.3.2.2. BFSI
- 9.3.2.3. Healthcare
- 9.3.2.4. Retail
- 9.3.2.5. Manufacturing
- 9.3.2.6. Aerospace, Defense, and Intelligence
- 9.3.2.7. Other End Users
- 9.1. Market Analysis, Insights and Forecast - by Services
- 10. Middle East Data Center Transformation Industry Analysis, Insights and Forecast, 2019-2031
- 10.1. Market Analysis, Insights and Forecast - by Services
- 10.1.1. Consolidation Services
- 10.1.2. Optimization Services
- 10.1.3. Automation Services
- 10.1.4. Infrastructure Management
- 10.2. Market Analysis, Insights and Forecast - by Level of Data Center
- 10.2.1. Tier 1
- 10.2.2. Tier 2
- 10.2.3. Tier 3
- 10.2.4. Tier 4
- 10.3. Market Analysis, Insights and Forecast - by End User
- 10.3.1. Data Center Providers
- 10.3.2. Enterprises
- 10.3.2.1. IT and Telecom
- 10.3.2.2. BFSI
- 10.3.2.3. Healthcare
- 10.3.2.4. Retail
- 10.3.2.5. Manufacturing
- 10.3.2.6. Aerospace, Defense, and Intelligence
- 10.3.2.7. Other End Users
- 10.1. Market Analysis, Insights and Forecast - by Services
- 11. North America Data Center Transformation Industry Analysis, Insights and Forecast, 2019-2031
- 11.1. Market Analysis, Insights and Forecast - By Country/Sub-region
- 11.1.1 United States
- 11.1.2 Canada
- 11.1.3 Mexico
- 12. Europe Data Center Transformation Industry Analysis, Insights and Forecast, 2019-2031
- 12.1. Market Analysis, Insights and Forecast - By Country/Sub-region
- 12.1.1 Germany
- 12.1.2 United Kingdom
- 12.1.3 France
- 12.1.4 Spain
- 12.1.5 Italy
- 12.1.6 Spain
- 12.1.7 Belgium
- 12.1.8 Netherland
- 12.1.9 Nordics
- 12.1.10 Rest of Europe
- 13. Asia Pacific Data Center Transformation Industry Analysis, Insights and Forecast, 2019-2031
- 13.1. Market Analysis, Insights and Forecast - By Country/Sub-region
- 13.1.1 China
- 13.1.2 Japan
- 13.1.3 India
- 13.1.4 South Korea
- 13.1.5 Southeast Asia
- 13.1.6 Australia
- 13.1.7 Indonesia
- 13.1.8 Phillipes
- 13.1.9 Singapore
- 13.1.10 Thailandc
- 13.1.11 Rest of Asia Pacific
- 14. South America Data Center Transformation Industry Analysis, Insights and Forecast, 2019-2031
- 14.1. Market Analysis, Insights and Forecast - By Country/Sub-region
- 14.1.1 Brazil
- 14.1.2 Argentina
- 14.1.3 Peru
- 14.1.4 Chile
- 14.1.5 Colombia
- 14.1.6 Ecuador
- 14.1.7 Venezuela
- 14.1.8 Rest of South America
- 15. North America Data Center Transformation Industry Analysis, Insights and Forecast, 2019-2031
- 15.1. Market Analysis, Insights and Forecast - By Country/Sub-region
- 15.1.1 United States
- 15.1.2 Canada
- 15.1.3 Mexico
- 16. MEA Data Center Transformation Industry Analysis, Insights and Forecast, 2019-2031
- 16.1. Market Analysis, Insights and Forecast - By Country/Sub-region
- 16.1.1 United Arab Emirates
- 16.1.2 Saudi Arabia
- 16.1.3 South Africa
- 16.1.4 Rest of Middle East and Africa
- 17. Competitive Analysis
- 17.1. Global Market Share Analysis 2024
- 17.2. Company Profiles
- 17.2.1 IBM Corporation
- 17.2.1.1. Overview
- 17.2.1.2. Products
- 17.2.1.3. SWOT Analysis
- 17.2.1.4. Recent Developments
- 17.2.1.5. Financials (Based on Availability)
- 17.2.2 Dell EMC (Dell Inc )
- 17.2.2.1. Overview
- 17.2.2.2. Products
- 17.2.2.3. SWOT Analysis
- 17.2.2.4. Recent Developments
- 17.2.2.5. Financials (Based on Availability)
- 17.2.3 NTT Communications
- 17.2.3.1. Overview
- 17.2.3.2. Products
- 17.2.3.3. SWOT Analysis
- 17.2.3.4. Recent Developments
- 17.2.3.5. Financials (Based on Availability)
- 17.2.4 Accenture plc
- 17.2.4.1. Overview
- 17.2.4.2. Products
- 17.2.4.3. SWOT Analysis
- 17.2.4.4. Recent Developments
- 17.2.4.5. Financials (Based on Availability)
- 17.2.5 Cisco Systems Inc
- 17.2.5.1. Overview
- 17.2.5.2. Products
- 17.2.5.3. SWOT Analysis
- 17.2.5.4. Recent Developments
- 17.2.5.5. Financials (Based on Availability)
- 17.2.6 Schneider Electric SE
- 17.2.6.1. Overview
- 17.2.6.2. Products
- 17.2.6.3. SWOT Analysis
- 17.2.6.4. Recent Developments
- 17.2.6.5. Financials (Based on Availability)
- 17.2.7 Microsoft Corporation
- 17.2.7.1. Overview
- 17.2.7.2. Products
- 17.2.7.3. SWOT Analysis
- 17.2.7.4. Recent Developments
- 17.2.7.5. Financials (Based on Availability)
- 17.2.8 Emerson Network Power Inc*List Not Exhaustive
- 17.2.8.1. Overview
- 17.2.8.2. Products
- 17.2.8.3. SWOT Analysis
- 17.2.8.4. Recent Developments
- 17.2.8.5. Financials (Based on Availability)
- 17.2.9 NetApp Inc
- 17.2.9.1. Overview
- 17.2.9.2. Products
- 17.2.9.3. SWOT Analysis
- 17.2.9.4. Recent Developments
- 17.2.9.5. Financials (Based on Availability)
- 17.2.10 Wipro Technologies
- 17.2.10.1. Overview
- 17.2.10.2. Products
- 17.2.10.3. SWOT Analysis
- 17.2.10.4. Recent Developments
- 17.2.10.5. Financials (Based on Availability)
- 17.2.11 HCL Technologies Limited
- 17.2.11.1. Overview
- 17.2.11.2. Products
- 17.2.11.3. SWOT Analysis
- 17.2.11.4. Recent Developments
- 17.2.11.5. Financials (Based on Availability)
- 17.2.12 Hitachi Vantara Federal Corporation
- 17.2.12.1. Overview
- 17.2.12.2. Products
- 17.2.12.3. SWOT Analysis
- 17.2.12.4. Recent Developments
- 17.2.12.5. Financials (Based on Availability)
- 17.2.1 IBM Corporation
List of Figures
- Figure 1: Global Data Center Transformation Industry Revenue Breakdown (Million, %) by Region 2024 & 2032
- Figure 2: North America Data Center Transformation Industry Revenue (Million), by Country 2024 & 2032
- Figure 3: North America Data Center Transformation Industry Revenue Share (%), by Country 2024 & 2032
- Figure 4: Europe Data Center Transformation Industry Revenue (Million), by Country 2024 & 2032
- Figure 5: Europe Data Center Transformation Industry Revenue Share (%), by Country 2024 & 2032
- Figure 6: Asia Pacific Data Center Transformation Industry Revenue (Million), by Country 2024 & 2032
- Figure 7: Asia Pacific Data Center Transformation Industry Revenue Share (%), by Country 2024 & 2032
- Figure 8: South America Data Center Transformation Industry Revenue (Million), by Country 2024 & 2032
- Figure 9: South America Data Center Transformation Industry Revenue Share (%), by Country 2024 & 2032
- Figure 10: North America Data Center Transformation Industry Revenue (Million), by Country 2024 & 2032
- Figure 11: North America Data Center Transformation Industry Revenue Share (%), by Country 2024 & 2032
- Figure 12: MEA Data Center Transformation Industry Revenue (Million), by Country 2024 & 2032
- Figure 13: MEA Data Center Transformation Industry Revenue Share (%), by Country 2024 & 2032
- Figure 14: North America Data Center Transformation Industry Revenue (Million), by Services 2024 & 2032
- Figure 15: North America Data Center Transformation Industry Revenue Share (%), by Services 2024 & 2032
- Figure 16: North America Data Center Transformation Industry Revenue (Million), by Level of Data Center 2024 & 2032
- Figure 17: North America Data Center Transformation Industry Revenue Share (%), by Level of Data Center 2024 & 2032
- Figure 18: North America Data Center Transformation Industry Revenue (Million), by End User 2024 & 2032
- Figure 19: North America Data Center Transformation Industry Revenue Share (%), by End User 2024 & 2032
- Figure 20: North America Data Center Transformation Industry Revenue (Million), by Country 2024 & 2032
- Figure 21: North America Data Center Transformation Industry Revenue Share (%), by Country 2024 & 2032
- Figure 22: Europe Data Center Transformation Industry Revenue (Million), by Services 2024 & 2032
- Figure 23: Europe Data Center Transformation Industry Revenue Share (%), by Services 2024 & 2032
- Figure 24: Europe Data Center Transformation Industry Revenue (Million), by Level of Data Center 2024 & 2032
- Figure 25: Europe Data Center Transformation Industry Revenue Share (%), by Level of Data Center 2024 & 2032
- Figure 26: Europe Data Center Transformation Industry Revenue (Million), by End User 2024 & 2032
- Figure 27: Europe Data Center Transformation Industry Revenue Share (%), by End User 2024 & 2032
- Figure 28: Europe Data Center Transformation Industry Revenue (Million), by Country 2024 & 2032
- Figure 29: Europe Data Center Transformation Industry Revenue Share (%), by Country 2024 & 2032
- Figure 30: Asia Pacific Data Center Transformation Industry Revenue (Million), by Services 2024 & 2032
- Figure 31: Asia Pacific Data Center Transformation Industry Revenue Share (%), by Services 2024 & 2032
- Figure 32: Asia Pacific Data Center Transformation Industry Revenue (Million), by Level of Data Center 2024 & 2032
- Figure 33: Asia Pacific Data Center Transformation Industry Revenue Share (%), by Level of Data Center 2024 & 2032
- Figure 34: Asia Pacific Data Center Transformation Industry Revenue (Million), by End User 2024 & 2032
- Figure 35: Asia Pacific Data Center Transformation Industry Revenue Share (%), by End User 2024 & 2032
- Figure 36: Asia Pacific Data Center Transformation Industry Revenue (Million), by Country 2024 & 2032
- Figure 37: Asia Pacific Data Center Transformation Industry Revenue Share (%), by Country 2024 & 2032
- Figure 38: Latin America Data Center Transformation Industry Revenue (Million), by Services 2024 & 2032
- Figure 39: Latin America Data Center Transformation Industry Revenue Share (%), by Services 2024 & 2032
- Figure 40: Latin America Data Center Transformation Industry Revenue (Million), by Level of Data Center 2024 & 2032
- Figure 41: Latin America Data Center Transformation Industry Revenue Share (%), by Level of Data Center 2024 & 2032
- Figure 42: Latin America Data Center Transformation Industry Revenue (Million), by End User 2024 & 2032
- Figure 43: Latin America Data Center Transformation Industry Revenue Share (%), by End User 2024 & 2032
- Figure 44: Latin America Data Center Transformation Industry Revenue (Million), by Country 2024 & 2032
- Figure 45: Latin America Data Center Transformation Industry Revenue Share (%), by Country 2024 & 2032
- Figure 46: Middle East Data Center Transformation Industry Revenue (Million), by Services 2024 & 2032
- Figure 47: Middle East Data Center Transformation Industry Revenue Share (%), by Services 2024 & 2032
- Figure 48: Middle East Data Center Transformation Industry Revenue (Million), by Level of Data Center 2024 & 2032
- Figure 49: Middle East Data Center Transformation Industry Revenue Share (%), by Level of Data Center 2024 & 2032
- Figure 50: Middle East Data Center Transformation Industry Revenue (Million), by End User 2024 & 2032
- Figure 51: Middle East Data Center Transformation Industry Revenue Share (%), by End User 2024 & 2032
- Figure 52: Middle East Data Center Transformation Industry Revenue (Million), by Country 2024 & 2032
- Figure 53: Middle East Data Center Transformation Industry Revenue Share (%), by Country 2024 & 2032
List of Tables
- Table 1: Global Data Center Transformation Industry Revenue Million Forecast, by Region 2019 & 2032
- Table 2: Global Data Center Transformation Industry Revenue Million Forecast, by Services 2019 & 2032
- Table 3: Global Data Center Transformation Industry Revenue Million Forecast, by Level of Data Center 2019 & 2032
- Table 4: Global Data Center Transformation Industry Revenue Million Forecast, by End User 2019 & 2032
- Table 5: Global Data Center Transformation Industry Revenue Million Forecast, by Region 2019 & 2032
- Table 6: Global Data Center Transformation Industry Revenue Million Forecast, by Country 2019 & 2032
- Table 7: United States Data Center Transformation Industry Revenue (Million) Forecast, by Application 2019 & 2032
- Table 8: Canada Data Center Transformation Industry Revenue (Million) Forecast, by Application 2019 & 2032
- Table 9: Mexico Data Center Transformation Industry Revenue (Million) Forecast, by Application 2019 & 2032
- Table 10: Global Data Center Transformation Industry Revenue Million Forecast, by Country 2019 & 2032
- Table 11: Germany Data Center Transformation Industry Revenue (Million) Forecast, by Application 2019 & 2032
- Table 12: United Kingdom Data Center Transformation Industry Revenue (Million) Forecast, by Application 2019 & 2032
- Table 13: France Data Center Transformation Industry Revenue (Million) Forecast, by Application 2019 & 2032
- Table 14: Spain Data Center Transformation Industry Revenue (Million) Forecast, by Application 2019 & 2032
- Table 15: Italy Data Center Transformation Industry Revenue (Million) Forecast, by Application 2019 & 2032
- Table 16: Spain Data Center Transformation Industry Revenue (Million) Forecast, by Application 2019 & 2032
- Table 17: Belgium Data Center Transformation Industry Revenue (Million) Forecast, by Application 2019 & 2032
- Table 18: Netherland Data Center Transformation Industry Revenue (Million) Forecast, by Application 2019 & 2032
- Table 19: Nordics Data Center Transformation Industry Revenue (Million) Forecast, by Application 2019 & 2032
- Table 20: Rest of Europe Data Center Transformation Industry Revenue (Million) Forecast, by Application 2019 & 2032
- Table 21: Global Data Center Transformation Industry Revenue Million Forecast, by Country 2019 & 2032
- Table 22: China Data Center Transformation Industry Revenue (Million) Forecast, by Application 2019 & 2032
- Table 23: Japan Data Center Transformation Industry Revenue (Million) Forecast, by Application 2019 & 2032
- Table 24: India Data Center Transformation Industry Revenue (Million) Forecast, by Application 2019 & 2032
- Table 25: South Korea Data Center Transformation Industry Revenue (Million) Forecast, by Application 2019 & 2032
- Table 26: Southeast Asia Data Center Transformation Industry Revenue (Million) Forecast, by Application 2019 & 2032
- Table 27: Australia Data Center Transformation Industry Revenue (Million) Forecast, by Application 2019 & 2032
- Table 28: Indonesia Data Center Transformation Industry Revenue (Million) Forecast, by Application 2019 & 2032
- Table 29: Phillipes Data Center Transformation Industry Revenue (Million) Forecast, by Application 2019 & 2032
- Table 30: Singapore Data Center Transformation Industry Revenue (Million) Forecast, by Application 2019 & 2032
- Table 31: Thailandc Data Center Transformation Industry Revenue (Million) Forecast, by Application 2019 & 2032
- Table 32: Rest of Asia Pacific Data Center Transformation Industry Revenue (Million) Forecast, by Application 2019 & 2032
- Table 33: Global Data Center Transformation Industry Revenue Million Forecast, by Country 2019 & 2032
- Table 34: Brazil Data Center Transformation Industry Revenue (Million) Forecast, by Application 2019 & 2032
- Table 35: Argentina Data Center Transformation Industry Revenue (Million) Forecast, by Application 2019 & 2032
- Table 36: Peru Data Center Transformation Industry Revenue (Million) Forecast, by Application 2019 & 2032
- Table 37: Chile Data Center Transformation Industry Revenue (Million) Forecast, by Application 2019 & 2032
- Table 38: Colombia Data Center Transformation Industry Revenue (Million) Forecast, by Application 2019 & 2032
- Table 39: Ecuador Data Center Transformation Industry Revenue (Million) Forecast, by Application 2019 & 2032
- Table 40: Venezuela Data Center Transformation Industry Revenue (Million) Forecast, by Application 2019 & 2032
- Table 41: Rest of South America Data Center Transformation Industry Revenue (Million) Forecast, by Application 2019 & 2032
- Table 42: Global Data Center Transformation Industry Revenue Million Forecast, by Country 2019 & 2032
- Table 43: United States Data Center Transformation Industry Revenue (Million) Forecast, by Application 2019 & 2032
- Table 44: Canada Data Center Transformation Industry Revenue (Million) Forecast, by Application 2019 & 2032
- Table 45: Mexico Data Center Transformation Industry Revenue (Million) Forecast, by Application 2019 & 2032
- Table 46: Global Data Center Transformation Industry Revenue Million Forecast, by Country 2019 & 2032
- Table 47: United Arab Emirates Data Center Transformation Industry Revenue (Million) Forecast, by Application 2019 & 2032
- Table 48: Saudi Arabia Data Center Transformation Industry Revenue (Million) Forecast, by Application 2019 & 2032
- Table 49: South Africa Data Center Transformation Industry Revenue (Million) Forecast, by Application 2019 & 2032
- Table 50: Rest of Middle East and Africa Data Center Transformation Industry Revenue (Million) Forecast, by Application 2019 & 2032
- Table 51: Global Data Center Transformation Industry Revenue Million Forecast, by Services 2019 & 2032
- Table 52: Global Data Center Transformation Industry Revenue Million Forecast, by Level of Data Center 2019 & 2032
- Table 53: Global Data Center Transformation Industry Revenue Million Forecast, by End User 2019 & 2032
- Table 54: Global Data Center Transformation Industry Revenue Million Forecast, by Country 2019 & 2032
- Table 55: Global Data Center Transformation Industry Revenue Million Forecast, by Services 2019 & 2032
- Table 56: Global Data Center Transformation Industry Revenue Million Forecast, by Level of Data Center 2019 & 2032
- Table 57: Global Data Center Transformation Industry Revenue Million Forecast, by End User 2019 & 2032
- Table 58: Global Data Center Transformation Industry Revenue Million Forecast, by Country 2019 & 2032
- Table 59: Global Data Center Transformation Industry Revenue Million Forecast, by Services 2019 & 2032
- Table 60: Global Data Center Transformation Industry Revenue Million Forecast, by Level of Data Center 2019 & 2032
- Table 61: Global Data Center Transformation Industry Revenue Million Forecast, by End User 2019 & 2032
- Table 62: Global Data Center Transformation Industry Revenue Million Forecast, by Country 2019 & 2032
- Table 63: Global Data Center Transformation Industry Revenue Million Forecast, by Services 2019 & 2032
- Table 64: Global Data Center Transformation Industry Revenue Million Forecast, by Level of Data Center 2019 & 2032
- Table 65: Global Data Center Transformation Industry Revenue Million Forecast, by End User 2019 & 2032
- Table 66: Global Data Center Transformation Industry Revenue Million Forecast, by Country 2019 & 2032
- Table 67: Global Data Center Transformation Industry Revenue Million Forecast, by Services 2019 & 2032
- Table 68: Global Data Center Transformation Industry Revenue Million Forecast, by Level of Data Center 2019 & 2032
- Table 69: Global Data Center Transformation Industry Revenue Million Forecast, by End User 2019 & 2032
- Table 70: Global Data Center Transformation Industry Revenue Million Forecast, by Country 2019 & 2032
Frequently Asked Questions
1. What is the projected Compound Annual Growth Rate (CAGR) of the Data Center Transformation Industry?
The projected CAGR is approximately 9.35%.
2. Which companies are prominent players in the Data Center Transformation Industry?
Key companies in the market include IBM Corporation, Dell EMC (Dell Inc ), NTT Communications, Accenture plc, Cisco Systems Inc, Schneider Electric SE, Microsoft Corporation, Emerson Network Power Inc*List Not Exhaustive, NetApp Inc, Wipro Technologies, HCL Technologies Limited, Hitachi Vantara Federal Corporation.
3. What are the main segments of the Data Center Transformation Industry?
The market segments include Services, Level of Data Center, End User.
4. Can you provide details about the market size?
The market size is estimated to be USD 19.29 Million as of 2022.
5. What are some drivers contributing to market growth?
Need to Reduce Costs and Increase Efficiency of Data Centers; Adoption of Cloud-based Services; Increasing Significance of E-commerce Databases are Expected to Grow at a Significant Rate.
6. What are the notable trends driving market growth?
Increasing Significance of E-commerce Databases are Expected to Grow at a Significant Rate.
7. Are there any restraints impacting market growth?
ROI Concerns Over the Investment across Low Load Data Centers.
8. Can you provide examples of recent developments in the market?
Spetember 2023 - Schneider Electric SE has launched an industry-first guide to addressing new physical infrastructure design challenges for data centers to support the shift in artificial intelligence (AI)-driven workloads, setting the gold standard for AI-optimized data center design.
9. What pricing options are available for accessing the report?
Pricing options include single-user, multi-user, and enterprise licenses priced at USD 4750, USD 5250, and USD 8750 respectively.
10. Is the market size provided in terms of value or volume?
The market size is provided in terms of value, measured in Million.
11. Are there any specific market keywords associated with the report?
Yes, the market keyword associated with the report is "Data Center Transformation Industry," which aids in identifying and referencing the specific market segment covered.
12. How do I determine which pricing option suits my needs best?
The pricing options vary based on user requirements and access needs. Individual users may opt for single-user licenses, while businesses requiring broader access may choose multi-user or enterprise licenses for cost-effective access to the report.
13. Are there any additional resources or data provided in the Data Center Transformation Industry report?
While the report offers comprehensive insights, it's advisable to review the specific contents or supplementary materials provided to ascertain if additional resources or data are available.
14. How can I stay updated on further developments or reports in the Data Center Transformation Industry?
To stay informed about further developments, trends, and reports in the Data Center Transformation Industry, consider subscribing to industry newsletters, following relevant companies and organizations, or regularly checking reputable industry news sources and publications.
Methodology
Step 1 - Identification of Relevant Samples Size from Population Database


Step 2 - Approaches for Defining Global Market Size (Value, Volume* & Price*)

Note*: In applicable scenarios
Step 3 - Data Sources
Primary Research
- Web Analytics
- Survey Reports
- Research Institute
- Latest Research Reports
- Opinion Leaders
Secondary Research
- Annual Reports
- White Paper
- Latest Press Release
- Industry Association
- Paid Database
- Investor Presentations

Step 4 - Data Triangulation
Involves using different sources of information in order to increase the validity of a study
These sources are likely to be stakeholders in a program - participants, other researchers, program staff, other community members, and so on.
Then we put all data in single framework & apply various statistical tools to find out the dynamic on the market.
During the analysis stage, feedback from the stakeholder groups would be compared to determine areas of agreement as well as areas of divergence


