
Key Insights
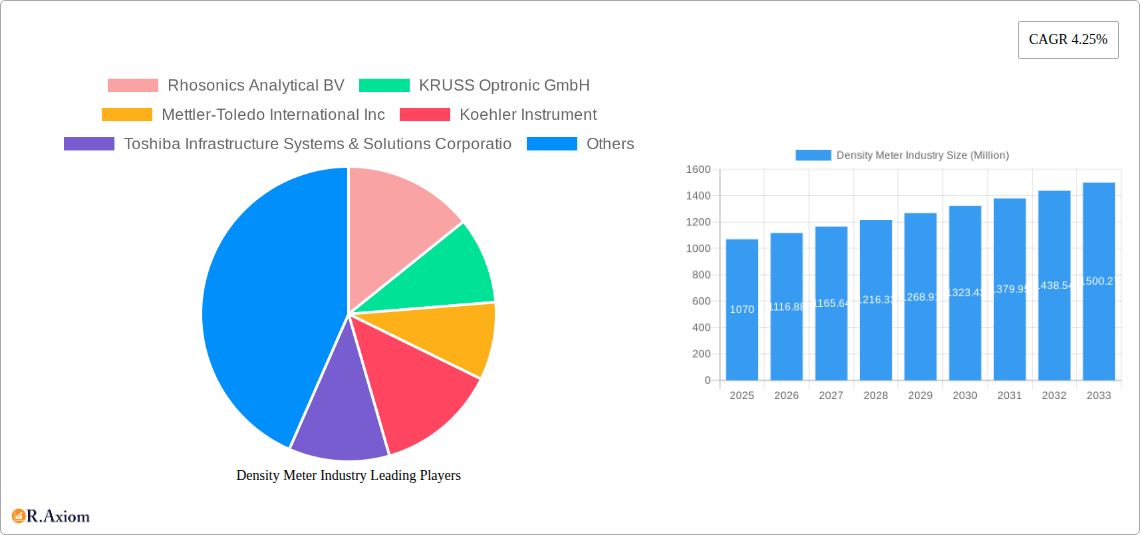
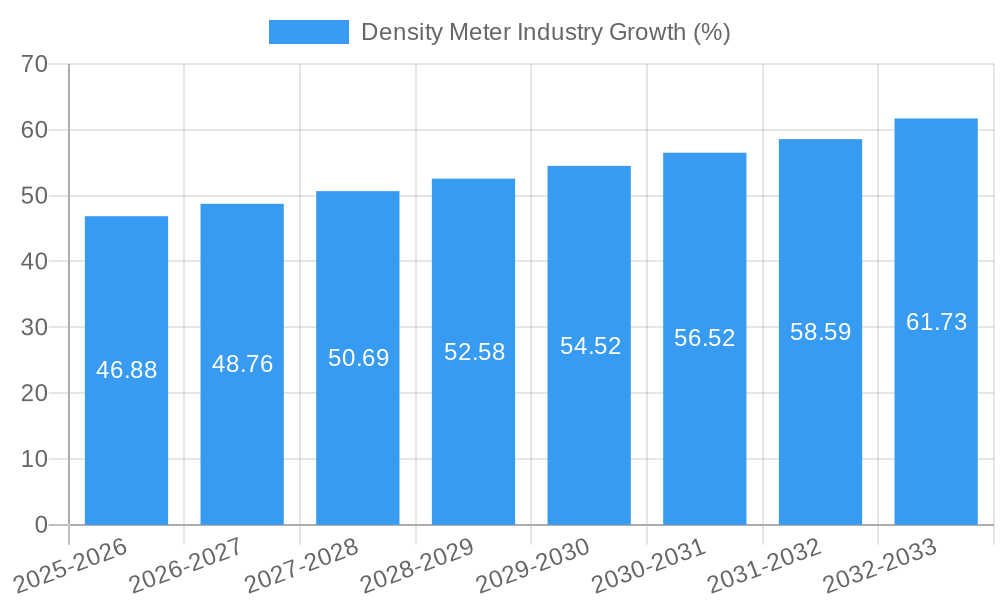
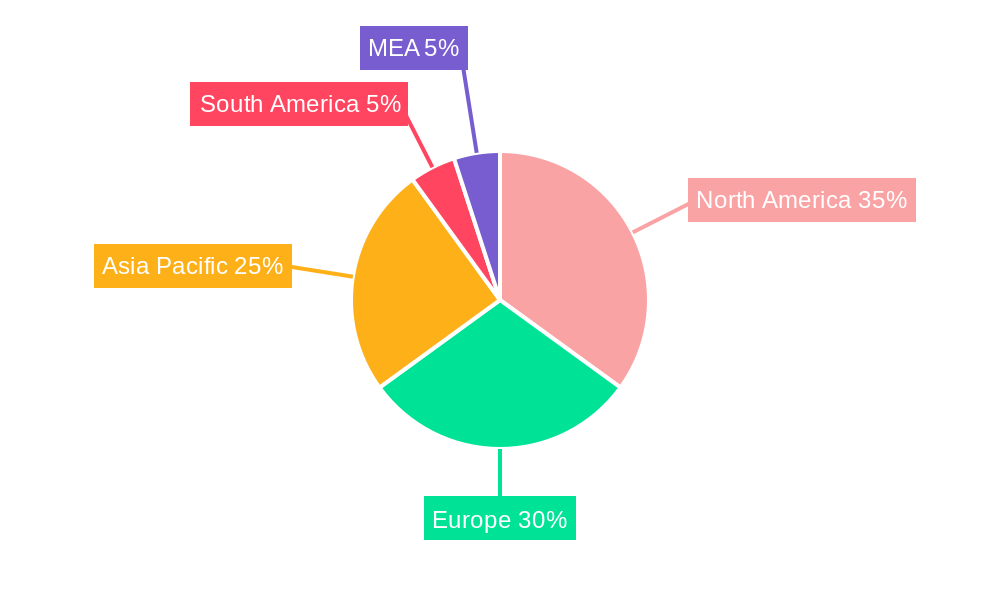
The density meter market, valued at $1.07 billion in 2025, is projected to experience steady growth, driven by increasing demand across diverse industries. A compound annual growth rate (CAGR) of 4.25% from 2025 to 2033 indicates a promising future for this market. Key drivers include stringent quality control requirements in various sectors like pharmaceuticals and food & beverage, necessitating precise density measurements. Advancements in technology, such as the development of portable and more accurate instruments, further fuel market expansion. The rise of automated systems in manufacturing processes also contributes to the demand for reliable density meters. Growth is further segmented by meter type (benchtop, module, portable), measurement technology (Coriolis, nuclear, ultrasonic, microwave, gravitic), and end-user industry (water & wastewater, chemicals, mining & metal processing, food & beverage, healthcare & pharmaceuticals, electronics, oil & gas, and others). The market is geographically diverse, with North America and Europe currently holding significant shares, however, the Asia-Pacific region is expected to witness robust growth due to increasing industrialization and rising disposable income.
While the market shows strong potential, certain restraints exist. High initial investment costs for sophisticated density meters could limit adoption in smaller enterprises. Furthermore, the need for skilled personnel to operate and maintain these instruments might present a challenge in certain regions. Competition among established players like Mettler-Toledo, Anton Paar, and Emerson Electric, coupled with the emergence of innovative startups, presents both opportunities and challenges in the market. Nevertheless, the overall growth trajectory is optimistic, with ongoing technological innovation and expanding applications likely to overcome these limitations. The continuous demand for improved accuracy, enhanced portability, and reduced maintenance costs will drive further innovation and market penetration in the coming years.
Density Meter Industry: A Comprehensive Market Report (2019-2033)
This in-depth report provides a comprehensive analysis of the global density meter industry, offering valuable insights for stakeholders across the value chain. The study period covers 2019-2033, with 2025 as the base and estimated year. The report projects a market size of xx Million by 2033, exhibiting a CAGR of xx% during the forecast period (2025-2033).
Density Meter Industry Market Concentration & Innovation
The density meter market is moderately concentrated, with several key players holding significant market share. Mettler-Toledo International Inc., Anton Paar GmbH, and Thermo Fisher Scientific are among the dominant players, collectively accounting for an estimated xx% of the global market in 2024. However, the presence of numerous smaller specialized companies fosters innovation and competition.
Market Concentration Metrics (2024 Estimates):
- Top 3 Players Market Share: xx%
- Top 5 Players Market Share: xx%
- Average M&A Deal Value (2019-2024): xx Million
Innovation Drivers:
- Advancements in sensor technology (e.g., Coriolis, Ultrasonic, Microwave) leading to higher accuracy and faster measurement times.
- Miniaturization and development of portable density meters expanding application reach.
- Integration of advanced data analytics and connectivity features (e.g., Modbus integration as seen in Rheonics' recent collaboration) for improved process optimization and remote monitoring.
Regulatory Landscape & Substitutes:
Regulatory frameworks concerning environmental monitoring and industrial safety drive demand for precise density measurement across various sectors. While no direct substitutes exist, alternative methods for density determination (e.g., hydrometers) offer limited accuracy and are primarily used in less demanding applications.
End-User Trends & M&A Activity:
The increasing adoption of automation and digitalization across various industries is a major driver for demand. M&A activity in the density meter industry has been moderate in recent years, primarily focused on expanding product portfolios and geographic reach.
Density Meter Industry Industry Trends & Insights
The density meter market is experiencing robust growth driven by several factors. The increasing demand for precise density measurements across various industries, particularly in sectors like chemicals, pharmaceuticals, and oil & gas, is a key driver. Technological advancements, such as the development of more accurate and portable devices, are further stimulating market expansion. Consumer preferences are shifting towards digitally connected, easy-to-use, and highly accurate instruments. Competitive dynamics are characterized by innovation, product differentiation, and strategic partnerships.
The market is witnessing significant technological disruptions with the integration of advanced sensors, improved data analytics capabilities, and the adoption of Industry 4.0 principles. This leads to increased efficiency, reduced operational costs, and enhanced process control for end-users. The market penetration of advanced density meter technologies like Coriolis and Ultrasonic is increasing steadily, replacing traditional methods. The projected CAGR reflects this positive growth trajectory.
Dominant Markets & Segments in Density Meter Industry
The chemical and pharmaceutical industries represent the largest end-user segments globally, driven by stringent quality control and regulatory requirements. The North American and European regions dominate the market due to established industrial bases and high technological adoption rates. Asia-Pacific is a rapidly growing region, driven by industrial expansion and increasing infrastructure development.
Key Drivers by Segment:
- Chemicals: Stringent quality control, process optimization, and environmental regulations.
- Pharmaceuticals: Accurate formulation, quality assurance, and compliance with regulatory standards.
- Oil & Gas: Pipeline monitoring, product quality control, and efficient hydrocarbon processing.
- Food & Beverage: Quality control, process optimization, and product consistency.
Regional Dominance:
- North America: Strong industrial base, high technological adoption, and stringent regulations.
- Europe: Established chemical and pharmaceutical industries, robust R&D activities, and early adoption of advanced technologies.
- Asia-Pacific: Rapid industrialization, rising disposable incomes, and increasing focus on infrastructure development.
Type Segment Dominance:
Benchtop density meters hold the largest market share due to their high accuracy and versatility. However, portable and module-type instruments are witnessing significant growth due to their convenience and application in field testing.
Density Meter Industry Product Developments
Recent product innovations focus on enhancing accuracy, portability, and ease of use. This includes the integration of advanced sensors, user-friendly interfaces, and data connectivity features. Competitive advantages stem from superior accuracy, faster measurement times, robust designs, and the ability to integrate seamlessly into existing process control systems. The trend is towards miniaturization, improved data analytics, and greater connectivity.
Report Scope & Segmentation Analysis
The report segments the density meter market by type (Benchtop, Module, Portable), application (Coriolis, Nuclear, Ultrasonic, Microwave, Gravitic), and end-user industry (Water and Wastewater, Chemicals, Mining and Metal Processing, Food and Beverage, Healthcare and Pharmaceuticals, Electronics, Oil and Gas, Other End-user Industries). Each segment is analyzed in detail, providing market size estimates, growth projections, and competitive dynamics.
Key Drivers of Density Meter Industry Growth
Several factors contribute to the density meter industry's growth. These include stringent quality control requirements across various industries, advancements in sensor technology leading to improved accuracy and efficiency, and the increasing demand for automated and digitally connected solutions in process monitoring and control. Government regulations promoting environmental monitoring and industrial safety further drive market growth.
Challenges in the Density Meter Industry Sector
The density meter industry faces challenges such as the high initial investment cost of advanced instruments, the need for specialized technical expertise, and the intense competition from established players and emerging entrants. Supply chain disruptions and fluctuating raw material prices also impact profitability. Regulatory compliance and the need for continuous product innovation to stay ahead of the competition pose further challenges.
Emerging Opportunities in Density Meter Industry
Emerging opportunities include the development of wireless and cloud-connected density meters for remote monitoring and data analysis. There's also a growing demand for portable and ruggedized devices for field applications, as well as increased integration with process control systems. New market opportunities exist in rapidly developing economies and niche applications requiring specialized density measurement solutions.
Leading Players in the Density Meter Industry Market
- Rhosonics Analytical BV
- KRUSS Optronic GmbH
- Mettler-Toledo International Inc
- Koehler Instrument
- Toshiba Infrastructure Systems & Solutions Corporation
- Emerson Electric Co
- Schmidt + Haensch GmbH & Co
- Red Meters LLC
- Anton Paar GmbH
- Ametek Inc
- Berthold Technologies GmbH & Co KG
- VWR International (Avantor)
- Yokogawa Electric Corporation
- Thermo Fisher Scientific
- RUDOLPH RESEARCH ANALYTICAL
Key Developments in Density Meter Industry Industry
- March 2024: Rosatom partners with Nornickel, introducing advanced radioisotope density meters for seamless liquid product monitoring in challenging environments. This collaboration signifies a strategic move towards enhanced precision and speed in industrial processes.
- March 2024: Rheonics integrates Modbus RTU and Modbus TCP/IP into its density meters and viscometers, improving interoperability and cost-effectiveness for users. This standardization effort enhances ease of integration within existing automation systems.
Strategic Outlook for Density Meter Industry Market
The density meter market is poised for sustained growth, driven by technological advancements, expanding industrial applications, and increasing regulatory pressures. The focus on automation, data analytics, and connectivity will continue to shape market dynamics. Companies that invest in R&D, offer innovative products, and effectively adapt to evolving end-user needs will be best positioned for success in this dynamic market.
Density Meter Industry Segmentation
-
1. Type
- 1.1. Benchtop
- 1.2. Module
- 1.3. Portable
-
2. Application
- 2.1. Coriolis
- 2.2. Nuclear
- 2.3. Ultrasonic
- 2.4. Microwave
- 2.5. Gravitic
-
3. End-user Industry
- 3.1. Water and Wastewater
- 3.2. Chemicals
- 3.3. Mining and Metal Processing
- 3.4. Food and Beverage
- 3.5. Healthcare and Pharmaceuticals
- 3.6. Electronics
- 3.7. Oil and Gas
- 3.8. Other En
Density Meter Industry Segmentation By Geography
-
1. North America
- 1.1. United States
- 1.2. Canada
-
2. Europe
- 2.1. United Kingdom
- 2.2. Germany
- 2.3. France
-
3. Asia
- 3.1. China
- 3.2. India
- 3.3. Japan
- 4. Australia and New Zealand
- 5. Latin America
- 6. Middle East and Africa
Density Meter Industry REPORT HIGHLIGHTS
| Aspects | Details |
|---|---|
| Study Period | 2019-2033 |
| Base Year | 2024 |
| Estimated Year | 2025 |
| Forecast Period | 2025-2033 |
| Historical Period | 2019-2024 |
| Growth Rate | CAGR of 4.25% from 2019-2033 |
| Segmentation |
|
Table of Contents
- 1. Introduction
- 1.1. Research Scope
- 1.2. Market Segmentation
- 1.3. Research Methodology
- 1.4. Definitions and Assumptions
- 2. Executive Summary
- 2.1. Introduction
- 3. Market Dynamics
- 3.1. Introduction
- 3.2. Market Drivers
- 3.2.1. Expansion in Industrialization; Stringent Regulations with Regard to Food Quality and Safety
- 3.3. Market Restrains
- 3.3.1. Lack of Awareness About Intellectual Property Outsourcing
- 3.4. Market Trends
- 3.4.1. Oil and Gas Industry to Hold Significant Market Share
- 4. Market Factor Analysis
- 4.1. Porters Five Forces
- 4.2. Supply/Value Chain
- 4.3. PESTEL analysis
- 4.4. Market Entropy
- 4.5. Patent/Trademark Analysis
- 5. Global Density Meter Industry Analysis, Insights and Forecast, 2019-2031
- 5.1. Market Analysis, Insights and Forecast - by Type
- 5.1.1. Benchtop
- 5.1.2. Module
- 5.1.3. Portable
- 5.2. Market Analysis, Insights and Forecast - by Application
- 5.2.1. Coriolis
- 5.2.2. Nuclear
- 5.2.3. Ultrasonic
- 5.2.4. Microwave
- 5.2.5. Gravitic
- 5.3. Market Analysis, Insights and Forecast - by End-user Industry
- 5.3.1. Water and Wastewater
- 5.3.2. Chemicals
- 5.3.3. Mining and Metal Processing
- 5.3.4. Food and Beverage
- 5.3.5. Healthcare and Pharmaceuticals
- 5.3.6. Electronics
- 5.3.7. Oil and Gas
- 5.3.8. Other En
- 5.4. Market Analysis, Insights and Forecast - by Region
- 5.4.1. North America
- 5.4.2. Europe
- 5.4.3. Asia
- 5.4.4. Australia and New Zealand
- 5.4.5. Latin America
- 5.4.6. Middle East and Africa
- 5.1. Market Analysis, Insights and Forecast - by Type
- 6. North America Density Meter Industry Analysis, Insights and Forecast, 2019-2031
- 6.1. Market Analysis, Insights and Forecast - by Type
- 6.1.1. Benchtop
- 6.1.2. Module
- 6.1.3. Portable
- 6.2. Market Analysis, Insights and Forecast - by Application
- 6.2.1. Coriolis
- 6.2.2. Nuclear
- 6.2.3. Ultrasonic
- 6.2.4. Microwave
- 6.2.5. Gravitic
- 6.3. Market Analysis, Insights and Forecast - by End-user Industry
- 6.3.1. Water and Wastewater
- 6.3.2. Chemicals
- 6.3.3. Mining and Metal Processing
- 6.3.4. Food and Beverage
- 6.3.5. Healthcare and Pharmaceuticals
- 6.3.6. Electronics
- 6.3.7. Oil and Gas
- 6.3.8. Other En
- 6.1. Market Analysis, Insights and Forecast - by Type
- 7. Europe Density Meter Industry Analysis, Insights and Forecast, 2019-2031
- 7.1. Market Analysis, Insights and Forecast - by Type
- 7.1.1. Benchtop
- 7.1.2. Module
- 7.1.3. Portable
- 7.2. Market Analysis, Insights and Forecast - by Application
- 7.2.1. Coriolis
- 7.2.2. Nuclear
- 7.2.3. Ultrasonic
- 7.2.4. Microwave
- 7.2.5. Gravitic
- 7.3. Market Analysis, Insights and Forecast - by End-user Industry
- 7.3.1. Water and Wastewater
- 7.3.2. Chemicals
- 7.3.3. Mining and Metal Processing
- 7.3.4. Food and Beverage
- 7.3.5. Healthcare and Pharmaceuticals
- 7.3.6. Electronics
- 7.3.7. Oil and Gas
- 7.3.8. Other En
- 7.1. Market Analysis, Insights and Forecast - by Type
- 8. Asia Density Meter Industry Analysis, Insights and Forecast, 2019-2031
- 8.1. Market Analysis, Insights and Forecast - by Type
- 8.1.1. Benchtop
- 8.1.2. Module
- 8.1.3. Portable
- 8.2. Market Analysis, Insights and Forecast - by Application
- 8.2.1. Coriolis
- 8.2.2. Nuclear
- 8.2.3. Ultrasonic
- 8.2.4. Microwave
- 8.2.5. Gravitic
- 8.3. Market Analysis, Insights and Forecast - by End-user Industry
- 8.3.1. Water and Wastewater
- 8.3.2. Chemicals
- 8.3.3. Mining and Metal Processing
- 8.3.4. Food and Beverage
- 8.3.5. Healthcare and Pharmaceuticals
- 8.3.6. Electronics
- 8.3.7. Oil and Gas
- 8.3.8. Other En
- 8.1. Market Analysis, Insights and Forecast - by Type
- 9. Australia and New Zealand Density Meter Industry Analysis, Insights and Forecast, 2019-2031
- 9.1. Market Analysis, Insights and Forecast - by Type
- 9.1.1. Benchtop
- 9.1.2. Module
- 9.1.3. Portable
- 9.2. Market Analysis, Insights and Forecast - by Application
- 9.2.1. Coriolis
- 9.2.2. Nuclear
- 9.2.3. Ultrasonic
- 9.2.4. Microwave
- 9.2.5. Gravitic
- 9.3. Market Analysis, Insights and Forecast - by End-user Industry
- 9.3.1. Water and Wastewater
- 9.3.2. Chemicals
- 9.3.3. Mining and Metal Processing
- 9.3.4. Food and Beverage
- 9.3.5. Healthcare and Pharmaceuticals
- 9.3.6. Electronics
- 9.3.7. Oil and Gas
- 9.3.8. Other En
- 9.1. Market Analysis, Insights and Forecast - by Type
- 10. Latin America Density Meter Industry Analysis, Insights and Forecast, 2019-2031
- 10.1. Market Analysis, Insights and Forecast - by Type
- 10.1.1. Benchtop
- 10.1.2. Module
- 10.1.3. Portable
- 10.2. Market Analysis, Insights and Forecast - by Application
- 10.2.1. Coriolis
- 10.2.2. Nuclear
- 10.2.3. Ultrasonic
- 10.2.4. Microwave
- 10.2.5. Gravitic
- 10.3. Market Analysis, Insights and Forecast - by End-user Industry
- 10.3.1. Water and Wastewater
- 10.3.2. Chemicals
- 10.3.3. Mining and Metal Processing
- 10.3.4. Food and Beverage
- 10.3.5. Healthcare and Pharmaceuticals
- 10.3.6. Electronics
- 10.3.7. Oil and Gas
- 10.3.8. Other En
- 10.1. Market Analysis, Insights and Forecast - by Type
- 11. Middle East and Africa Density Meter Industry Analysis, Insights and Forecast, 2019-2031
- 11.1. Market Analysis, Insights and Forecast - by Type
- 11.1.1. Benchtop
- 11.1.2. Module
- 11.1.3. Portable
- 11.2. Market Analysis, Insights and Forecast - by Application
- 11.2.1. Coriolis
- 11.2.2. Nuclear
- 11.2.3. Ultrasonic
- 11.2.4. Microwave
- 11.2.5. Gravitic
- 11.3. Market Analysis, Insights and Forecast - by End-user Industry
- 11.3.1. Water and Wastewater
- 11.3.2. Chemicals
- 11.3.3. Mining and Metal Processing
- 11.3.4. Food and Beverage
- 11.3.5. Healthcare and Pharmaceuticals
- 11.3.6. Electronics
- 11.3.7. Oil and Gas
- 11.3.8. Other En
- 11.1. Market Analysis, Insights and Forecast - by Type
- 12. North America Density Meter Industry Analysis, Insights and Forecast, 2019-2031
- 12.1. Market Analysis, Insights and Forecast - By Country/Sub-region
- 12.1.1 United States
- 12.1.2 Canada
- 12.1.3 Mexico
- 13. Europe Density Meter Industry Analysis, Insights and Forecast, 2019-2031
- 13.1. Market Analysis, Insights and Forecast - By Country/Sub-region
- 13.1.1 Germany
- 13.1.2 United Kingdom
- 13.1.3 France
- 13.1.4 Spain
- 13.1.5 Italy
- 13.1.6 Spain
- 13.1.7 Belgium
- 13.1.8 Netherland
- 13.1.9 Nordics
- 13.1.10 Rest of Europe
- 14. Asia Pacific Density Meter Industry Analysis, Insights and Forecast, 2019-2031
- 14.1. Market Analysis, Insights and Forecast - By Country/Sub-region
- 14.1.1 China
- 14.1.2 Japan
- 14.1.3 India
- 14.1.4 South Korea
- 14.1.5 Southeast Asia
- 14.1.6 Australia
- 14.1.7 Indonesia
- 14.1.8 Phillipes
- 14.1.9 Singapore
- 14.1.10 Thailandc
- 14.1.11 Rest of Asia Pacific
- 15. South America Density Meter Industry Analysis, Insights and Forecast, 2019-2031
- 15.1. Market Analysis, Insights and Forecast - By Country/Sub-region
- 15.1.1 Brazil
- 15.1.2 Argentina
- 15.1.3 Peru
- 15.1.4 Chile
- 15.1.5 Colombia
- 15.1.6 Ecuador
- 15.1.7 Venezuela
- 15.1.8 Rest of South America
- 16. MEA Density Meter Industry Analysis, Insights and Forecast, 2019-2031
- 16.1. Market Analysis, Insights and Forecast - By Country/Sub-region
- 16.1.1 United Arab Emirates
- 16.1.2 Saudi Arabia
- 16.1.3 South Africa
- 16.1.4 Rest of Middle East and Africa
- 17. Competitive Analysis
- 17.1. Global Market Share Analysis 2024
- 17.2. Company Profiles
- 17.2.1 Rhosonics Analytical BV
- 17.2.1.1. Overview
- 17.2.1.2. Products
- 17.2.1.3. SWOT Analysis
- 17.2.1.4. Recent Developments
- 17.2.1.5. Financials (Based on Availability)
- 17.2.2 KRUSS Optronic GmbH
- 17.2.2.1. Overview
- 17.2.2.2. Products
- 17.2.2.3. SWOT Analysis
- 17.2.2.4. Recent Developments
- 17.2.2.5. Financials (Based on Availability)
- 17.2.3 Mettler-Toledo International Inc
- 17.2.3.1. Overview
- 17.2.3.2. Products
- 17.2.3.3. SWOT Analysis
- 17.2.3.4. Recent Developments
- 17.2.3.5. Financials (Based on Availability)
- 17.2.4 Koehler Instrument
- 17.2.4.1. Overview
- 17.2.4.2. Products
- 17.2.4.3. SWOT Analysis
- 17.2.4.4. Recent Developments
- 17.2.4.5. Financials (Based on Availability)
- 17.2.5 Toshiba Infrastructure Systems & Solutions Corporatio
- 17.2.5.1. Overview
- 17.2.5.2. Products
- 17.2.5.3. SWOT Analysis
- 17.2.5.4. Recent Developments
- 17.2.5.5. Financials (Based on Availability)
- 17.2.6 Emerson Electric Co
- 17.2.6.1. Overview
- 17.2.6.2. Products
- 17.2.6.3. SWOT Analysis
- 17.2.6.4. Recent Developments
- 17.2.6.5. Financials (Based on Availability)
- 17.2.7 Schmidt + Haensch GmbH & Co
- 17.2.7.1. Overview
- 17.2.7.2. Products
- 17.2.7.3. SWOT Analysis
- 17.2.7.4. Recent Developments
- 17.2.7.5. Financials (Based on Availability)
- 17.2.8 Red Meters LLC
- 17.2.8.1. Overview
- 17.2.8.2. Products
- 17.2.8.3. SWOT Analysis
- 17.2.8.4. Recent Developments
- 17.2.8.5. Financials (Based on Availability)
- 17.2.9 Anton Paar GmbH
- 17.2.9.1. Overview
- 17.2.9.2. Products
- 17.2.9.3. SWOT Analysis
- 17.2.9.4. Recent Developments
- 17.2.9.5. Financials (Based on Availability)
- 17.2.10 Ametek Inc
- 17.2.10.1. Overview
- 17.2.10.2. Products
- 17.2.10.3. SWOT Analysis
- 17.2.10.4. Recent Developments
- 17.2.10.5. Financials (Based on Availability)
- 17.2.11 Berthold Technologies GmbH & Co KG
- 17.2.11.1. Overview
- 17.2.11.2. Products
- 17.2.11.3. SWOT Analysis
- 17.2.11.4. Recent Developments
- 17.2.11.5. Financials (Based on Availability)
- 17.2.12 VWR International (Avantor)
- 17.2.12.1. Overview
- 17.2.12.2. Products
- 17.2.12.3. SWOT Analysis
- 17.2.12.4. Recent Developments
- 17.2.12.5. Financials (Based on Availability)
- 17.2.13 Yokogawa Electric Corporation
- 17.2.13.1. Overview
- 17.2.13.2. Products
- 17.2.13.3. SWOT Analysis
- 17.2.13.4. Recent Developments
- 17.2.13.5. Financials (Based on Availability)
- 17.2.14 Thermo Fisher Scientific
- 17.2.14.1. Overview
- 17.2.14.2. Products
- 17.2.14.3. SWOT Analysis
- 17.2.14.4. Recent Developments
- 17.2.14.5. Financials (Based on Availability)
- 17.2.15 RUDOLPH RESEARCH ANALYTICAL
- 17.2.15.1. Overview
- 17.2.15.2. Products
- 17.2.15.3. SWOT Analysis
- 17.2.15.4. Recent Developments
- 17.2.15.5. Financials (Based on Availability)
- 17.2.1 Rhosonics Analytical BV
List of Figures
- Figure 1: Global Density Meter Industry Revenue Breakdown (Million, %) by Region 2024 & 2032
- Figure 2: North America Density Meter Industry Revenue (Million), by Country 2024 & 2032
- Figure 3: North America Density Meter Industry Revenue Share (%), by Country 2024 & 2032
- Figure 4: Europe Density Meter Industry Revenue (Million), by Country 2024 & 2032
- Figure 5: Europe Density Meter Industry Revenue Share (%), by Country 2024 & 2032
- Figure 6: Asia Pacific Density Meter Industry Revenue (Million), by Country 2024 & 2032
- Figure 7: Asia Pacific Density Meter Industry Revenue Share (%), by Country 2024 & 2032
- Figure 8: South America Density Meter Industry Revenue (Million), by Country 2024 & 2032
- Figure 9: South America Density Meter Industry Revenue Share (%), by Country 2024 & 2032
- Figure 10: MEA Density Meter Industry Revenue (Million), by Country 2024 & 2032
- Figure 11: MEA Density Meter Industry Revenue Share (%), by Country 2024 & 2032
- Figure 12: North America Density Meter Industry Revenue (Million), by Type 2024 & 2032
- Figure 13: North America Density Meter Industry Revenue Share (%), by Type 2024 & 2032
- Figure 14: North America Density Meter Industry Revenue (Million), by Application 2024 & 2032
- Figure 15: North America Density Meter Industry Revenue Share (%), by Application 2024 & 2032
- Figure 16: North America Density Meter Industry Revenue (Million), by End-user Industry 2024 & 2032
- Figure 17: North America Density Meter Industry Revenue Share (%), by End-user Industry 2024 & 2032
- Figure 18: North America Density Meter Industry Revenue (Million), by Country 2024 & 2032
- Figure 19: North America Density Meter Industry Revenue Share (%), by Country 2024 & 2032
- Figure 20: Europe Density Meter Industry Revenue (Million), by Type 2024 & 2032
- Figure 21: Europe Density Meter Industry Revenue Share (%), by Type 2024 & 2032
- Figure 22: Europe Density Meter Industry Revenue (Million), by Application 2024 & 2032
- Figure 23: Europe Density Meter Industry Revenue Share (%), by Application 2024 & 2032
- Figure 24: Europe Density Meter Industry Revenue (Million), by End-user Industry 2024 & 2032
- Figure 25: Europe Density Meter Industry Revenue Share (%), by End-user Industry 2024 & 2032
- Figure 26: Europe Density Meter Industry Revenue (Million), by Country 2024 & 2032
- Figure 27: Europe Density Meter Industry Revenue Share (%), by Country 2024 & 2032
- Figure 28: Asia Density Meter Industry Revenue (Million), by Type 2024 & 2032
- Figure 29: Asia Density Meter Industry Revenue Share (%), by Type 2024 & 2032
- Figure 30: Asia Density Meter Industry Revenue (Million), by Application 2024 & 2032
- Figure 31: Asia Density Meter Industry Revenue Share (%), by Application 2024 & 2032
- Figure 32: Asia Density Meter Industry Revenue (Million), by End-user Industry 2024 & 2032
- Figure 33: Asia Density Meter Industry Revenue Share (%), by End-user Industry 2024 & 2032
- Figure 34: Asia Density Meter Industry Revenue (Million), by Country 2024 & 2032
- Figure 35: Asia Density Meter Industry Revenue Share (%), by Country 2024 & 2032
- Figure 36: Australia and New Zealand Density Meter Industry Revenue (Million), by Type 2024 & 2032
- Figure 37: Australia and New Zealand Density Meter Industry Revenue Share (%), by Type 2024 & 2032
- Figure 38: Australia and New Zealand Density Meter Industry Revenue (Million), by Application 2024 & 2032
- Figure 39: Australia and New Zealand Density Meter Industry Revenue Share (%), by Application 2024 & 2032
- Figure 40: Australia and New Zealand Density Meter Industry Revenue (Million), by End-user Industry 2024 & 2032
- Figure 41: Australia and New Zealand Density Meter Industry Revenue Share (%), by End-user Industry 2024 & 2032
- Figure 42: Australia and New Zealand Density Meter Industry Revenue (Million), by Country 2024 & 2032
- Figure 43: Australia and New Zealand Density Meter Industry Revenue Share (%), by Country 2024 & 2032
- Figure 44: Latin America Density Meter Industry Revenue (Million), by Type 2024 & 2032
- Figure 45: Latin America Density Meter Industry Revenue Share (%), by Type 2024 & 2032
- Figure 46: Latin America Density Meter Industry Revenue (Million), by Application 2024 & 2032
- Figure 47: Latin America Density Meter Industry Revenue Share (%), by Application 2024 & 2032
- Figure 48: Latin America Density Meter Industry Revenue (Million), by End-user Industry 2024 & 2032
- Figure 49: Latin America Density Meter Industry Revenue Share (%), by End-user Industry 2024 & 2032
- Figure 50: Latin America Density Meter Industry Revenue (Million), by Country 2024 & 2032
- Figure 51: Latin America Density Meter Industry Revenue Share (%), by Country 2024 & 2032
- Figure 52: Middle East and Africa Density Meter Industry Revenue (Million), by Type 2024 & 2032
- Figure 53: Middle East and Africa Density Meter Industry Revenue Share (%), by Type 2024 & 2032
- Figure 54: Middle East and Africa Density Meter Industry Revenue (Million), by Application 2024 & 2032
- Figure 55: Middle East and Africa Density Meter Industry Revenue Share (%), by Application 2024 & 2032
- Figure 56: Middle East and Africa Density Meter Industry Revenue (Million), by End-user Industry 2024 & 2032
- Figure 57: Middle East and Africa Density Meter Industry Revenue Share (%), by End-user Industry 2024 & 2032
- Figure 58: Middle East and Africa Density Meter Industry Revenue (Million), by Country 2024 & 2032
- Figure 59: Middle East and Africa Density Meter Industry Revenue Share (%), by Country 2024 & 2032
List of Tables
- Table 1: Global Density Meter Industry Revenue Million Forecast, by Region 2019 & 2032
- Table 2: Global Density Meter Industry Revenue Million Forecast, by Type 2019 & 2032
- Table 3: Global Density Meter Industry Revenue Million Forecast, by Application 2019 & 2032
- Table 4: Global Density Meter Industry Revenue Million Forecast, by End-user Industry 2019 & 2032
- Table 5: Global Density Meter Industry Revenue Million Forecast, by Region 2019 & 2032
- Table 6: Global Density Meter Industry Revenue Million Forecast, by Country 2019 & 2032
- Table 7: United States Density Meter Industry Revenue (Million) Forecast, by Application 2019 & 2032
- Table 8: Canada Density Meter Industry Revenue (Million) Forecast, by Application 2019 & 2032
- Table 9: Mexico Density Meter Industry Revenue (Million) Forecast, by Application 2019 & 2032
- Table 10: Global Density Meter Industry Revenue Million Forecast, by Country 2019 & 2032
- Table 11: Germany Density Meter Industry Revenue (Million) Forecast, by Application 2019 & 2032
- Table 12: United Kingdom Density Meter Industry Revenue (Million) Forecast, by Application 2019 & 2032
- Table 13: France Density Meter Industry Revenue (Million) Forecast, by Application 2019 & 2032
- Table 14: Spain Density Meter Industry Revenue (Million) Forecast, by Application 2019 & 2032
- Table 15: Italy Density Meter Industry Revenue (Million) Forecast, by Application 2019 & 2032
- Table 16: Spain Density Meter Industry Revenue (Million) Forecast, by Application 2019 & 2032
- Table 17: Belgium Density Meter Industry Revenue (Million) Forecast, by Application 2019 & 2032
- Table 18: Netherland Density Meter Industry Revenue (Million) Forecast, by Application 2019 & 2032
- Table 19: Nordics Density Meter Industry Revenue (Million) Forecast, by Application 2019 & 2032
- Table 20: Rest of Europe Density Meter Industry Revenue (Million) Forecast, by Application 2019 & 2032
- Table 21: Global Density Meter Industry Revenue Million Forecast, by Country 2019 & 2032
- Table 22: China Density Meter Industry Revenue (Million) Forecast, by Application 2019 & 2032
- Table 23: Japan Density Meter Industry Revenue (Million) Forecast, by Application 2019 & 2032
- Table 24: India Density Meter Industry Revenue (Million) Forecast, by Application 2019 & 2032
- Table 25: South Korea Density Meter Industry Revenue (Million) Forecast, by Application 2019 & 2032
- Table 26: Southeast Asia Density Meter Industry Revenue (Million) Forecast, by Application 2019 & 2032
- Table 27: Australia Density Meter Industry Revenue (Million) Forecast, by Application 2019 & 2032
- Table 28: Indonesia Density Meter Industry Revenue (Million) Forecast, by Application 2019 & 2032
- Table 29: Phillipes Density Meter Industry Revenue (Million) Forecast, by Application 2019 & 2032
- Table 30: Singapore Density Meter Industry Revenue (Million) Forecast, by Application 2019 & 2032
- Table 31: Thailandc Density Meter Industry Revenue (Million) Forecast, by Application 2019 & 2032
- Table 32: Rest of Asia Pacific Density Meter Industry Revenue (Million) Forecast, by Application 2019 & 2032
- Table 33: Global Density Meter Industry Revenue Million Forecast, by Country 2019 & 2032
- Table 34: Brazil Density Meter Industry Revenue (Million) Forecast, by Application 2019 & 2032
- Table 35: Argentina Density Meter Industry Revenue (Million) Forecast, by Application 2019 & 2032
- Table 36: Peru Density Meter Industry Revenue (Million) Forecast, by Application 2019 & 2032
- Table 37: Chile Density Meter Industry Revenue (Million) Forecast, by Application 2019 & 2032
- Table 38: Colombia Density Meter Industry Revenue (Million) Forecast, by Application 2019 & 2032
- Table 39: Ecuador Density Meter Industry Revenue (Million) Forecast, by Application 2019 & 2032
- Table 40: Venezuela Density Meter Industry Revenue (Million) Forecast, by Application 2019 & 2032
- Table 41: Rest of South America Density Meter Industry Revenue (Million) Forecast, by Application 2019 & 2032
- Table 42: Global Density Meter Industry Revenue Million Forecast, by Country 2019 & 2032
- Table 43: United Arab Emirates Density Meter Industry Revenue (Million) Forecast, by Application 2019 & 2032
- Table 44: Saudi Arabia Density Meter Industry Revenue (Million) Forecast, by Application 2019 & 2032
- Table 45: South Africa Density Meter Industry Revenue (Million) Forecast, by Application 2019 & 2032
- Table 46: Rest of Middle East and Africa Density Meter Industry Revenue (Million) Forecast, by Application 2019 & 2032
- Table 47: Global Density Meter Industry Revenue Million Forecast, by Type 2019 & 2032
- Table 48: Global Density Meter Industry Revenue Million Forecast, by Application 2019 & 2032
- Table 49: Global Density Meter Industry Revenue Million Forecast, by End-user Industry 2019 & 2032
- Table 50: Global Density Meter Industry Revenue Million Forecast, by Country 2019 & 2032
- Table 51: United States Density Meter Industry Revenue (Million) Forecast, by Application 2019 & 2032
- Table 52: Canada Density Meter Industry Revenue (Million) Forecast, by Application 2019 & 2032
- Table 53: Global Density Meter Industry Revenue Million Forecast, by Type 2019 & 2032
- Table 54: Global Density Meter Industry Revenue Million Forecast, by Application 2019 & 2032
- Table 55: Global Density Meter Industry Revenue Million Forecast, by End-user Industry 2019 & 2032
- Table 56: Global Density Meter Industry Revenue Million Forecast, by Country 2019 & 2032
- Table 57: United Kingdom Density Meter Industry Revenue (Million) Forecast, by Application 2019 & 2032
- Table 58: Germany Density Meter Industry Revenue (Million) Forecast, by Application 2019 & 2032
- Table 59: France Density Meter Industry Revenue (Million) Forecast, by Application 2019 & 2032
- Table 60: Global Density Meter Industry Revenue Million Forecast, by Type 2019 & 2032
- Table 61: Global Density Meter Industry Revenue Million Forecast, by Application 2019 & 2032
- Table 62: Global Density Meter Industry Revenue Million Forecast, by End-user Industry 2019 & 2032
- Table 63: Global Density Meter Industry Revenue Million Forecast, by Country 2019 & 2032
- Table 64: China Density Meter Industry Revenue (Million) Forecast, by Application 2019 & 2032
- Table 65: India Density Meter Industry Revenue (Million) Forecast, by Application 2019 & 2032
- Table 66: Japan Density Meter Industry Revenue (Million) Forecast, by Application 2019 & 2032
- Table 67: Global Density Meter Industry Revenue Million Forecast, by Type 2019 & 2032
- Table 68: Global Density Meter Industry Revenue Million Forecast, by Application 2019 & 2032
- Table 69: Global Density Meter Industry Revenue Million Forecast, by End-user Industry 2019 & 2032
- Table 70: Global Density Meter Industry Revenue Million Forecast, by Country 2019 & 2032
- Table 71: Global Density Meter Industry Revenue Million Forecast, by Type 2019 & 2032
- Table 72: Global Density Meter Industry Revenue Million Forecast, by Application 2019 & 2032
- Table 73: Global Density Meter Industry Revenue Million Forecast, by End-user Industry 2019 & 2032
- Table 74: Global Density Meter Industry Revenue Million Forecast, by Country 2019 & 2032
- Table 75: Global Density Meter Industry Revenue Million Forecast, by Type 2019 & 2032
- Table 76: Global Density Meter Industry Revenue Million Forecast, by Application 2019 & 2032
- Table 77: Global Density Meter Industry Revenue Million Forecast, by End-user Industry 2019 & 2032
- Table 78: Global Density Meter Industry Revenue Million Forecast, by Country 2019 & 2032
Frequently Asked Questions
1. What is the projected Compound Annual Growth Rate (CAGR) of the Density Meter Industry?
The projected CAGR is approximately 4.25%.
2. Which companies are prominent players in the Density Meter Industry?
Key companies in the market include Rhosonics Analytical BV, KRUSS Optronic GmbH, Mettler-Toledo International Inc, Koehler Instrument, Toshiba Infrastructure Systems & Solutions Corporatio, Emerson Electric Co, Schmidt + Haensch GmbH & Co, Red Meters LLC, Anton Paar GmbH, Ametek Inc, Berthold Technologies GmbH & Co KG, VWR International (Avantor), Yokogawa Electric Corporation, Thermo Fisher Scientific, RUDOLPH RESEARCH ANALYTICAL.
3. What are the main segments of the Density Meter Industry?
The market segments include Type, Application, End-user Industry.
4. Can you provide details about the market size?
The market size is estimated to be USD 1.07 Million as of 2022.
5. What are some drivers contributing to market growth?
Expansion in Industrialization; Stringent Regulations with Regard to Food Quality and Safety.
6. What are the notable trends driving market growth?
Oil and Gas Industry to Hold Significant Market Share.
7. Are there any restraints impacting market growth?
Lack of Awareness About Intellectual Property Outsourcing.
8. Can you provide examples of recent developments in the market?
March 2024 - Rosatom partners with Nornickel, providing advanced radioisotope instruments. These instruments, including a radioisotope density meter, empower Nornickel to monitor liquid industrial products seamlessly, even in challenging operational environments, without halting production. Collaboration with Rosatom in nuclear instrumentation not only signifies a strategic alliance but also promises enhanced precision and swiftness in the production processes.
9. What pricing options are available for accessing the report?
Pricing options include single-user, multi-user, and enterprise licenses priced at USD 4750, USD 5250, and USD 8750 respectively.
10. Is the market size provided in terms of value or volume?
The market size is provided in terms of value, measured in Million.
11. Are there any specific market keywords associated with the report?
Yes, the market keyword associated with the report is "Density Meter Industry," which aids in identifying and referencing the specific market segment covered.
12. How do I determine which pricing option suits my needs best?
The pricing options vary based on user requirements and access needs. Individual users may opt for single-user licenses, while businesses requiring broader access may choose multi-user or enterprise licenses for cost-effective access to the report.
13. Are there any additional resources or data provided in the Density Meter Industry report?
While the report offers comprehensive insights, it's advisable to review the specific contents or supplementary materials provided to ascertain if additional resources or data are available.
14. How can I stay updated on further developments or reports in the Density Meter Industry?
To stay informed about further developments, trends, and reports in the Density Meter Industry, consider subscribing to industry newsletters, following relevant companies and organizations, or regularly checking reputable industry news sources and publications.
Methodology
Step 1 - Identification of Relevant Samples Size from Population Database


Step 2 - Approaches for Defining Global Market Size (Value, Volume* & Price*)

Note*: In applicable scenarios
Step 3 - Data Sources
Primary Research
- Web Analytics
- Survey Reports
- Research Institute
- Latest Research Reports
- Opinion Leaders
Secondary Research
- Annual Reports
- White Paper
- Latest Press Release
- Industry Association
- Paid Database
- Investor Presentations

Step 4 - Data Triangulation
Involves using different sources of information in order to increase the validity of a study
These sources are likely to be stakeholders in a program - participants, other researchers, program staff, other community members, and so on.
Then we put all data in single framework & apply various statistical tools to find out the dynamic on the market.
During the analysis stage, feedback from the stakeholder groups would be compared to determine areas of agreement as well as areas of divergence


