
Key Insights
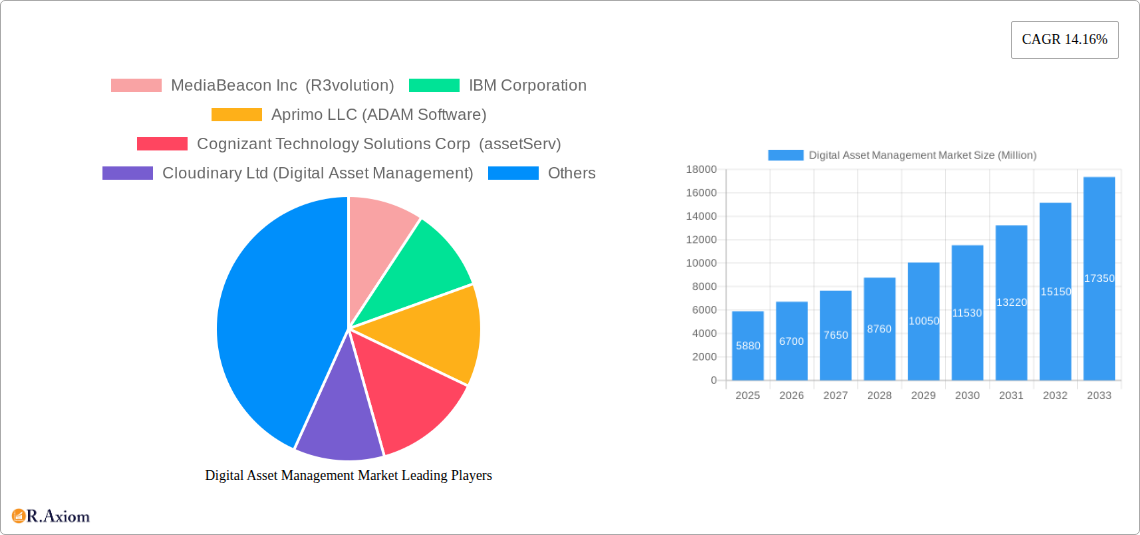
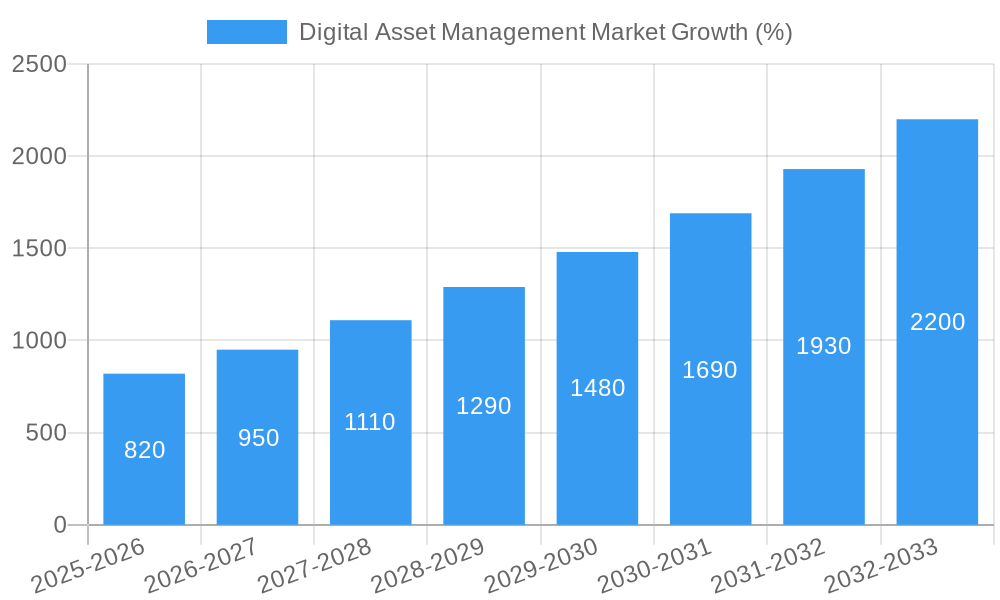
The Digital Asset Management (DAM) market is experiencing robust growth, projected to reach a market size of $5.88 billion in 2025 and maintain a Compound Annual Growth Rate (CAGR) of 14.16% from 2025 to 2033. This expansion is driven by several key factors. The increasing volume of digital assets generated across various industries necessitates efficient management solutions. Businesses are increasingly adopting cloud-based DAM systems for enhanced accessibility, scalability, and collaboration capabilities, significantly contributing to market growth. Furthermore, the rising adoption of advanced features like AI-powered asset tagging, automated workflows, and improved security measures within DAM platforms is fueling market expansion. The demand for streamlined content creation and distribution processes across diverse sectors, including media and entertainment, BFSI, and healthcare, is a significant driver.
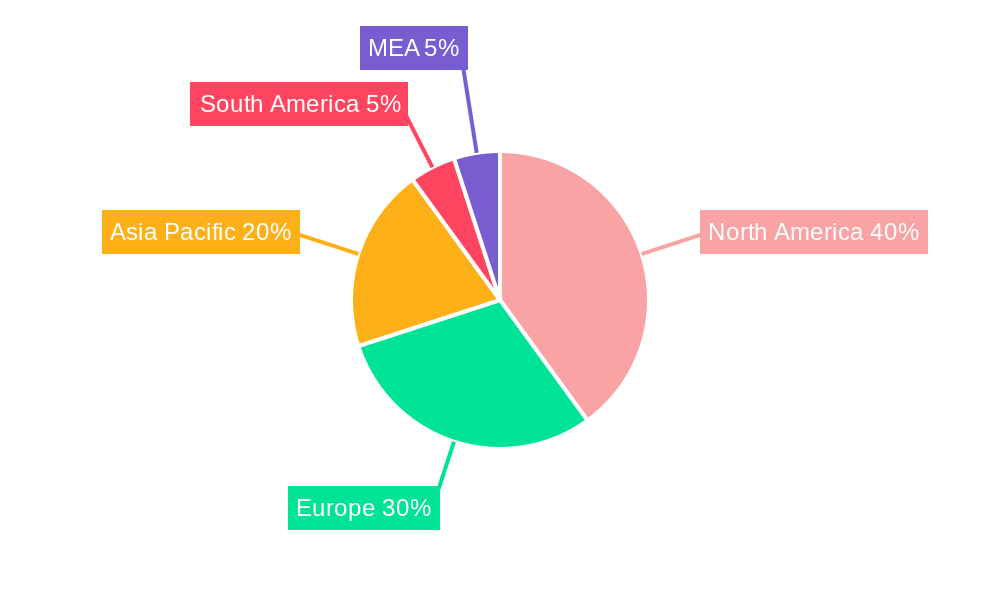
Segmentation analysis reveals that the cloud-based SaaS deployment model is witnessing the most rapid growth, owing to its flexible and cost-effective nature. Large enterprises are leading adoption, but the SME segment is also demonstrating significant growth potential as they recognize the benefits of centralized asset management. Geographically, North America and Europe currently dominate the market, but the Asia-Pacific region is expected to exhibit substantial growth in the coming years, driven by increasing digitalization and the expanding presence of multinational corporations in the region. Competitive rivalry is intense, with established players like Adobe and IBM alongside a dynamic landscape of specialized DAM vendors offering innovative solutions. Challenges include data security concerns, integration complexities with existing systems, and the need for ongoing training and support to maximize DAM platform utilization. However, the overall outlook for the DAM market remains highly positive, with continued growth driven by ongoing digital transformation initiatives across industries globally.
Digital Asset Management Market: A Comprehensive Report (2019-2033)
This in-depth report provides a comprehensive analysis of the Digital Asset Management (DAM) market, offering valuable insights for stakeholders across the industry. The study period covers 2019-2033, with 2025 as the base and estimated year, and a forecast period of 2025-2033. The historical period analyzed is 2019-2024. The report leverages extensive market research, incorporating data on key players, market segments, and emerging trends to provide actionable strategic recommendations. The market is expected to reach xx Million by 2033, exhibiting a CAGR of xx% during the forecast period.
Digital Asset Management Market Concentration & Innovation
The Digital Asset Management market exhibits a moderately concentrated landscape, with several key players holding significant market share. While precise market share figures for each company are proprietary information, Adobe Systems Incorporated, IBM Corporation, and OpenText Corporation are recognized as major players, each commanding a substantial portion of the market. The market is characterized by continuous innovation driven by the increasing demand for efficient content management, enhanced collaboration tools, and AI-powered functionalities. Regulatory frameworks, particularly those concerning data privacy and security, play a significant role in shaping market dynamics. Product substitutes, including basic file-sharing platforms, exist but lack the sophisticated features and functionalities offered by dedicated DAM solutions. End-user trends show a strong preference for cloud-based solutions, driven by accessibility, scalability, and cost-effectiveness. Mergers and acquisitions (M&A) are a prominent feature, with recent activity significantly impacting market consolidation and technological integration. For example, the xx Million acquisition of Digizuite A/S by KeyShot in August 2023 demonstrates the strategic importance of DAM capabilities in expanding digital supply chain solutions. Further, the partnership between OpenText and Vue.ai highlights the increasing integration of AI in DAM solutions. The average M&A deal value in the DAM sector during the historical period is estimated at approximately xx Million.
Digital Asset Management Market Industry Trends & Insights
The Digital Asset Management market is experiencing robust growth fueled by several key drivers. The increasing volume of digital assets generated by organizations across various sectors necessitates efficient management systems. The shift towards cloud-based solutions, offering scalability, accessibility, and cost optimization, is a major trend. The rising adoption of AI and machine learning in DAM platforms is transforming asset tagging, search, and retrieval, enhancing efficiency and user experience. The preference for streamlined workflows and enhanced collaboration across teams further contributes to the market's expansion. Consumer preferences are shifting toward user-friendly interfaces, intuitive search functionalities, and robust integration capabilities with other enterprise systems. Competitive dynamics are characterized by continuous innovation in features and functionalities, as vendors strive to differentiate their offerings. The market is seeing the emergence of niche players specializing in vertical-specific solutions, catering to the unique needs of different industries. The overall market growth is projected to be driven by factors like increased digital transformation initiatives, rising demand for content personalization, and the growing adoption of omnichannel marketing strategies. This has resulted in a market penetration rate of xx% in 2024, with expectations of xx% by 2033.
Dominant Markets & Segments in Digital Asset Management Market
The cloud-based (SaaS) segment is the dominant deployment model in the DAM market, outpacing on-premise solutions due to its flexibility, scalability, and reduced IT infrastructure costs. Large enterprises represent the most significant segment by organization size, driven by their greater need for sophisticated content management solutions and their ability to invest in advanced technologies.
- Key Drivers for Cloud-based DAM: Reduced upfront investment, scalability, accessibility, and enhanced collaboration features.
- Key Drivers for Large Enterprises: Extensive content libraries, sophisticated workflow requirements, and higher budgets for technology adoption.
Among end-users, the Media and Entertainment industry holds a significant share, followed by BFSI and Retail.
- Media & Entertainment: High volume of digital assets, need for efficient content delivery, and stringent copyright management requirements.
- BFSI: Stringent regulatory compliance needs, requirement for secure asset storage, and need for efficient customer communication.
- Retail: Requirement for high-quality product imagery, efficient catalog management, and personalized marketing campaigns.
The North American region currently dominates the global DAM market, followed by Europe and Asia-Pacific. The strong presence of major technology companies, advanced digital infrastructure, and high adoption rates within enterprises contribute to this dominance. Government initiatives promoting digital transformation and economic growth also play a crucial role in market expansion.
Digital Asset Management Market Product Developments
Recent product innovations in the DAM market center around AI-powered features, enhancing asset tagging, search, and metadata management. Integration with other enterprise systems, particularly CRM and marketing automation platforms, is a key area of focus. Vendors are also emphasizing user-friendly interfaces and intuitive workflows to improve user experience and adoption. The competitive advantage lies in offering a comprehensive platform integrating multiple functionalities, seamless integration capabilities, robust security features, and scalability to meet evolving business needs. This focus on a holistic approach and ease of use allows DAM platforms to align with broader digital transformation initiatives across enterprises.
Report Scope & Segmentation Analysis
This report segments the Digital Asset Management market across several key parameters:
By Deployment: On-premise deployments offer greater control and customization but come with higher upfront costs. Cloud-based (SaaS) deployments are more flexible, scalable, and cost-effective, leading to higher growth. We project the SaaS segment will capture xx% of the market by 2033.
By Organization Size: Large enterprises dominate the market share, while SMEs are showing increased adoption rates, driven by cost-effective SaaS solutions. The SME segment is projected to grow at a CAGR of xx% during the forecast period.
By End-User: The Media and Entertainment, BFSI, and Retail sectors are key drivers, followed by government, healthcare, and manufacturing. Each sector exhibits unique requirements, driving specialized DAM solution development.
Key Drivers of Digital Asset Management Market Growth
Several factors contribute to the Digital Asset Management market's growth:
- Technological Advancements: The integration of AI and machine learning, enhanced automation, and improved user interfaces are driving adoption.
- Economic Factors: The increasing need for efficient content management across industries and cost optimization through cloud solutions is boosting growth.
- Regulatory Compliance: Regulations related to data privacy and security necessitate robust DAM solutions.
Challenges in the Digital Asset Management Market Sector
The DAM market faces several challenges:
- Integration Complexity: Integrating DAM solutions with existing enterprise systems can be complex and costly.
- Data Security Concerns: Protecting sensitive digital assets from unauthorized access and breaches is crucial.
- High Initial Investment: On-premise solutions require significant upfront investments, hindering adoption by SMEs.
Emerging Opportunities in Digital Asset Management Market
Several emerging opportunities exist in the DAM market:
- AI-powered DAM: AI-driven functionalities, including automated tagging and metadata extraction, are revolutionizing asset management.
- Vertical-Specific Solutions: Customized solutions catering to the unique requirements of specific industries are gaining traction.
- Global Market Expansion: Emerging markets in Asia-Pacific and Latin America offer significant growth potential.
Leading Players in the Digital Asset Management Market
- MediaBeacon Inc (R3volution)
- IBM Corporation
- Aprimo LLC (ADAM Software)
- Cognizant Technology Solutions Corp (assetServ)
- Cloudinary Ltd (Digital Asset Management)
- Digizuite A/S
- Adobe Systems Incorporated (Adobe Experience Manager Assets)
- Oracle Corporation (Oracle WebCenter Content)
- CELUM GmbH (CELUM Digital Asset Management)
- Nuxeo (Nuxeo Platform)
- Bynder (Webdam Inc)
- Extensis (Celartem Inc)
- Widen (Digital Asset Management)
- OpenText Corporation (Media Management MediaBin)
- Canto Inc (Canto Digital Asset Management)
Key Developments in Digital Asset Management Market Industry
- December 2023: OpenText and Vue.ai partnered to integrate AI-powered tagging into their DAM solutions, reflecting the growing demand for AI-driven DAM.
- August 2023: KeyShot acquired Digizuite A/S, expanding its offerings into the digital supply chain management space. This acquisition emphasizes the increasing strategic importance of DAM capabilities within broader enterprise solutions.
Strategic Outlook for Digital Asset Management Market
The Digital Asset Management market presents a promising outlook for future growth. Continued technological advancements, particularly in AI and machine learning, will drive innovation and efficiency. The increasing demand for robust content management solutions across diverse industries, combined with the growing adoption of cloud-based platforms, will fuel market expansion. Focus on user-friendly interfaces, seamless integrations, and robust security features will be crucial for vendors to maintain a competitive edge. The market's trajectory suggests significant growth potential in the coming years, driven by ongoing digital transformation initiatives globally.
Digital Asset Management Market Segmentation
-
1. Deployment
- 1.1. On-premise
- 1.2. Cloud (SaaS)
-
2. Organization Size
- 2.1. SMEs (Small and Medium Enterprises)
- 2.2. Large Enterprises
-
3. End User
- 3.1. Media and Entertainment
- 3.2. BFSI
- 3.3. Government
- 3.4. Healthcare
- 3.5. Retail
- 3.6. Manufacturing
- 3.7. Other End Users
Digital Asset Management Market Segmentation By Geography
-
1. North America
- 1.1. United States
- 1.2. Canada
-
2. Europe
- 2.1. United Kingdom
- 2.2. Germany
- 2.3. France
- 2.4. Rest of Europe
-
3. Asia Pacific
- 3.1. China
- 3.2. India
- 3.3. Japan
- 3.4. Rest of Asia Pacific
- 4. Rest of the World
Digital Asset Management Market REPORT HIGHLIGHTS
| Aspects | Details |
|---|---|
| Study Period | 2019-2033 |
| Base Year | 2024 |
| Estimated Year | 2025 |
| Forecast Period | 2025-2033 |
| Historical Period | 2019-2024 |
| Growth Rate | CAGR of 14.16% from 2019-2033 |
| Segmentation |
|
Table of Contents
- 1. Introduction
- 1.1. Research Scope
- 1.2. Market Segmentation
- 1.3. Research Methodology
- 1.4. Definitions and Assumptions
- 2. Executive Summary
- 2.1. Introduction
- 3. Market Dynamics
- 3.1. Introduction
- 3.2. Market Drivers
- 3.2.1. Increase in the Number of Digital Assets
- 3.3. Market Restrains
- 3.3.1. Risk of Data Security Threats
- 3.4. Market Trends
- 3.4.1. Cloud Deployment to Hold Significant Market Share
- 4. Market Factor Analysis
- 4.1. Porters Five Forces
- 4.2. Supply/Value Chain
- 4.3. PESTEL analysis
- 4.4. Market Entropy
- 4.5. Patent/Trademark Analysis
- 5. Global Digital Asset Management Market Analysis, Insights and Forecast, 2019-2031
- 5.1. Market Analysis, Insights and Forecast - by Deployment
- 5.1.1. On-premise
- 5.1.2. Cloud (SaaS)
- 5.2. Market Analysis, Insights and Forecast - by Organization Size
- 5.2.1. SMEs (Small and Medium Enterprises)
- 5.2.2. Large Enterprises
- 5.3. Market Analysis, Insights and Forecast - by End User
- 5.3.1. Media and Entertainment
- 5.3.2. BFSI
- 5.3.3. Government
- 5.3.4. Healthcare
- 5.3.5. Retail
- 5.3.6. Manufacturing
- 5.3.7. Other End Users
- 5.4. Market Analysis, Insights and Forecast - by Region
- 5.4.1. North America
- 5.4.2. Europe
- 5.4.3. Asia Pacific
- 5.4.4. Rest of the World
- 5.1. Market Analysis, Insights and Forecast - by Deployment
- 6. North America Digital Asset Management Market Analysis, Insights and Forecast, 2019-2031
- 6.1. Market Analysis, Insights and Forecast - by Deployment
- 6.1.1. On-premise
- 6.1.2. Cloud (SaaS)
- 6.2. Market Analysis, Insights and Forecast - by Organization Size
- 6.2.1. SMEs (Small and Medium Enterprises)
- 6.2.2. Large Enterprises
- 6.3. Market Analysis, Insights and Forecast - by End User
- 6.3.1. Media and Entertainment
- 6.3.2. BFSI
- 6.3.3. Government
- 6.3.4. Healthcare
- 6.3.5. Retail
- 6.3.6. Manufacturing
- 6.3.7. Other End Users
- 6.1. Market Analysis, Insights and Forecast - by Deployment
- 7. Europe Digital Asset Management Market Analysis, Insights and Forecast, 2019-2031
- 7.1. Market Analysis, Insights and Forecast - by Deployment
- 7.1.1. On-premise
- 7.1.2. Cloud (SaaS)
- 7.2. Market Analysis, Insights and Forecast - by Organization Size
- 7.2.1. SMEs (Small and Medium Enterprises)
- 7.2.2. Large Enterprises
- 7.3. Market Analysis, Insights and Forecast - by End User
- 7.3.1. Media and Entertainment
- 7.3.2. BFSI
- 7.3.3. Government
- 7.3.4. Healthcare
- 7.3.5. Retail
- 7.3.6. Manufacturing
- 7.3.7. Other End Users
- 7.1. Market Analysis, Insights and Forecast - by Deployment
- 8. Asia Pacific Digital Asset Management Market Analysis, Insights and Forecast, 2019-2031
- 8.1. Market Analysis, Insights and Forecast - by Deployment
- 8.1.1. On-premise
- 8.1.2. Cloud (SaaS)
- 8.2. Market Analysis, Insights and Forecast - by Organization Size
- 8.2.1. SMEs (Small and Medium Enterprises)
- 8.2.2. Large Enterprises
- 8.3. Market Analysis, Insights and Forecast - by End User
- 8.3.1. Media and Entertainment
- 8.3.2. BFSI
- 8.3.3. Government
- 8.3.4. Healthcare
- 8.3.5. Retail
- 8.3.6. Manufacturing
- 8.3.7. Other End Users
- 8.1. Market Analysis, Insights and Forecast - by Deployment
- 9. Rest of the World Digital Asset Management Market Analysis, Insights and Forecast, 2019-2031
- 9.1. Market Analysis, Insights and Forecast - by Deployment
- 9.1.1. On-premise
- 9.1.2. Cloud (SaaS)
- 9.2. Market Analysis, Insights and Forecast - by Organization Size
- 9.2.1. SMEs (Small and Medium Enterprises)
- 9.2.2. Large Enterprises
- 9.3. Market Analysis, Insights and Forecast - by End User
- 9.3.1. Media and Entertainment
- 9.3.2. BFSI
- 9.3.3. Government
- 9.3.4. Healthcare
- 9.3.5. Retail
- 9.3.6. Manufacturing
- 9.3.7. Other End Users
- 9.1. Market Analysis, Insights and Forecast - by Deployment
- 10. North America Digital Asset Management Market Analysis, Insights and Forecast, 2019-2031
- 10.1. Market Analysis, Insights and Forecast - By Country/Sub-region
- 10.1.1 United States
- 10.1.2 Canada
- 10.1.3 Mexico
- 11. Europe Digital Asset Management Market Analysis, Insights and Forecast, 2019-2031
- 11.1. Market Analysis, Insights and Forecast - By Country/Sub-region
- 11.1.1 Germany
- 11.1.2 United Kingdom
- 11.1.3 France
- 11.1.4 Spain
- 11.1.5 Italy
- 11.1.6 Spain
- 11.1.7 Belgium
- 11.1.8 Netherland
- 11.1.9 Nordics
- 11.1.10 Rest of Europe
- 12. Asia Pacific Digital Asset Management Market Analysis, Insights and Forecast, 2019-2031
- 12.1. Market Analysis, Insights and Forecast - By Country/Sub-region
- 12.1.1 China
- 12.1.2 Japan
- 12.1.3 India
- 12.1.4 South Korea
- 12.1.5 Southeast Asia
- 12.1.6 Australia
- 12.1.7 Indonesia
- 12.1.8 Phillipes
- 12.1.9 Singapore
- 12.1.10 Thailandc
- 12.1.11 Rest of Asia Pacific
- 13. South America Digital Asset Management Market Analysis, Insights and Forecast, 2019-2031
- 13.1. Market Analysis, Insights and Forecast - By Country/Sub-region
- 13.1.1 Brazil
- 13.1.2 Argentina
- 13.1.3 Peru
- 13.1.4 Chile
- 13.1.5 Colombia
- 13.1.6 Ecuador
- 13.1.7 Venezuela
- 13.1.8 Rest of South America
- 14. North America Digital Asset Management Market Analysis, Insights and Forecast, 2019-2031
- 14.1. Market Analysis, Insights and Forecast - By Country/Sub-region
- 14.1.1 United States
- 14.1.2 Canada
- 14.1.3 Mexico
- 15. MEA Digital Asset Management Market Analysis, Insights and Forecast, 2019-2031
- 15.1. Market Analysis, Insights and Forecast - By Country/Sub-region
- 15.1.1 United Arab Emirates
- 15.1.2 Saudi Arabia
- 15.1.3 South Africa
- 15.1.4 Rest of Middle East and Africa
- 16. Competitive Analysis
- 16.1. Global Market Share Analysis 2024
- 16.2. Company Profiles
- 16.2.1 MediaBeacon Inc (R3volution)
- 16.2.1.1. Overview
- 16.2.1.2. Products
- 16.2.1.3. SWOT Analysis
- 16.2.1.4. Recent Developments
- 16.2.1.5. Financials (Based on Availability)
- 16.2.2 IBM Corporation
- 16.2.2.1. Overview
- 16.2.2.2. Products
- 16.2.2.3. SWOT Analysis
- 16.2.2.4. Recent Developments
- 16.2.2.5. Financials (Based on Availability)
- 16.2.3 Aprimo LLC (ADAM Software)
- 16.2.3.1. Overview
- 16.2.3.2. Products
- 16.2.3.3. SWOT Analysis
- 16.2.3.4. Recent Developments
- 16.2.3.5. Financials (Based on Availability)
- 16.2.4 Cognizant Technology Solutions Corp (assetServ)
- 16.2.4.1. Overview
- 16.2.4.2. Products
- 16.2.4.3. SWOT Analysis
- 16.2.4.4. Recent Developments
- 16.2.4.5. Financials (Based on Availability)
- 16.2.5 Cloudinary Ltd (Digital Asset Management)
- 16.2.5.1. Overview
- 16.2.5.2. Products
- 16.2.5.3. SWOT Analysis
- 16.2.5.4. Recent Developments
- 16.2.5.5. Financials (Based on Availability)
- 16.2.6 Digizuite A/
- 16.2.6.1. Overview
- 16.2.6.2. Products
- 16.2.6.3. SWOT Analysis
- 16.2.6.4. Recent Developments
- 16.2.6.5. Financials (Based on Availability)
- 16.2.7 Adobe Systems Incorporated (Adobe Experience Manager Assets)
- 16.2.7.1. Overview
- 16.2.7.2. Products
- 16.2.7.3. SWOT Analysis
- 16.2.7.4. Recent Developments
- 16.2.7.5. Financials (Based on Availability)
- 16.2.8 Oracle Corporation (Oracle WebCenter Content)
- 16.2.8.1. Overview
- 16.2.8.2. Products
- 16.2.8.3. SWOT Analysis
- 16.2.8.4. Recent Developments
- 16.2.8.5. Financials (Based on Availability)
- 16.2.9 CELUM GmbH (CELUM Digital Asset Management)
- 16.2.9.1. Overview
- 16.2.9.2. Products
- 16.2.9.3. SWOT Analysis
- 16.2.9.4. Recent Developments
- 16.2.9.5. Financials (Based on Availability)
- 16.2.10 Nuxeo (Nuxeo Platform)
- 16.2.10.1. Overview
- 16.2.10.2. Products
- 16.2.10.3. SWOT Analysis
- 16.2.10.4. Recent Developments
- 16.2.10.5. Financials (Based on Availability)
- 16.2.11 Bynder(Webdam Inc )
- 16.2.11.1. Overview
- 16.2.11.2. Products
- 16.2.11.3. SWOT Analysis
- 16.2.11.4. Recent Developments
- 16.2.11.5. Financials (Based on Availability)
- 16.2.12 Extensis (Celartem Inc )
- 16.2.12.1. Overview
- 16.2.12.2. Products
- 16.2.12.3. SWOT Analysis
- 16.2.12.4. Recent Developments
- 16.2.12.5. Financials (Based on Availability)
- 16.2.13 Widen (Digital Asset Management)
- 16.2.13.1. Overview
- 16.2.13.2. Products
- 16.2.13.3. SWOT Analysis
- 16.2.13.4. Recent Developments
- 16.2.13.5. Financials (Based on Availability)
- 16.2.14 OpenText Corporation (Media Management MediaBin)
- 16.2.14.1. Overview
- 16.2.14.2. Products
- 16.2.14.3. SWOT Analysis
- 16.2.14.4. Recent Developments
- 16.2.14.5. Financials (Based on Availability)
- 16.2.15 Canto Inc (Canto Digital Asset Management)
- 16.2.15.1. Overview
- 16.2.15.2. Products
- 16.2.15.3. SWOT Analysis
- 16.2.15.4. Recent Developments
- 16.2.15.5. Financials (Based on Availability)
- 16.2.1 MediaBeacon Inc (R3volution)
List of Figures
- Figure 1: Global Digital Asset Management Market Revenue Breakdown (Million, %) by Region 2024 & 2032
- Figure 2: Global Digital Asset Management Market Volume Breakdown (K Unit, %) by Region 2024 & 2032
- Figure 3: North America Digital Asset Management Market Revenue (Million), by Country 2024 & 2032
- Figure 4: North America Digital Asset Management Market Volume (K Unit), by Country 2024 & 2032
- Figure 5: North America Digital Asset Management Market Revenue Share (%), by Country 2024 & 2032
- Figure 6: North America Digital Asset Management Market Volume Share (%), by Country 2024 & 2032
- Figure 7: Europe Digital Asset Management Market Revenue (Million), by Country 2024 & 2032
- Figure 8: Europe Digital Asset Management Market Volume (K Unit), by Country 2024 & 2032
- Figure 9: Europe Digital Asset Management Market Revenue Share (%), by Country 2024 & 2032
- Figure 10: Europe Digital Asset Management Market Volume Share (%), by Country 2024 & 2032
- Figure 11: Asia Pacific Digital Asset Management Market Revenue (Million), by Country 2024 & 2032
- Figure 12: Asia Pacific Digital Asset Management Market Volume (K Unit), by Country 2024 & 2032
- Figure 13: Asia Pacific Digital Asset Management Market Revenue Share (%), by Country 2024 & 2032
- Figure 14: Asia Pacific Digital Asset Management Market Volume Share (%), by Country 2024 & 2032
- Figure 15: South America Digital Asset Management Market Revenue (Million), by Country 2024 & 2032
- Figure 16: South America Digital Asset Management Market Volume (K Unit), by Country 2024 & 2032
- Figure 17: South America Digital Asset Management Market Revenue Share (%), by Country 2024 & 2032
- Figure 18: South America Digital Asset Management Market Volume Share (%), by Country 2024 & 2032
- Figure 19: North America Digital Asset Management Market Revenue (Million), by Country 2024 & 2032
- Figure 20: North America Digital Asset Management Market Volume (K Unit), by Country 2024 & 2032
- Figure 21: North America Digital Asset Management Market Revenue Share (%), by Country 2024 & 2032
- Figure 22: North America Digital Asset Management Market Volume Share (%), by Country 2024 & 2032
- Figure 23: MEA Digital Asset Management Market Revenue (Million), by Country 2024 & 2032
- Figure 24: MEA Digital Asset Management Market Volume (K Unit), by Country 2024 & 2032
- Figure 25: MEA Digital Asset Management Market Revenue Share (%), by Country 2024 & 2032
- Figure 26: MEA Digital Asset Management Market Volume Share (%), by Country 2024 & 2032
- Figure 27: North America Digital Asset Management Market Revenue (Million), by Deployment 2024 & 2032
- Figure 28: North America Digital Asset Management Market Volume (K Unit), by Deployment 2024 & 2032
- Figure 29: North America Digital Asset Management Market Revenue Share (%), by Deployment 2024 & 2032
- Figure 30: North America Digital Asset Management Market Volume Share (%), by Deployment 2024 & 2032
- Figure 31: North America Digital Asset Management Market Revenue (Million), by Organization Size 2024 & 2032
- Figure 32: North America Digital Asset Management Market Volume (K Unit), by Organization Size 2024 & 2032
- Figure 33: North America Digital Asset Management Market Revenue Share (%), by Organization Size 2024 & 2032
- Figure 34: North America Digital Asset Management Market Volume Share (%), by Organization Size 2024 & 2032
- Figure 35: North America Digital Asset Management Market Revenue (Million), by End User 2024 & 2032
- Figure 36: North America Digital Asset Management Market Volume (K Unit), by End User 2024 & 2032
- Figure 37: North America Digital Asset Management Market Revenue Share (%), by End User 2024 & 2032
- Figure 38: North America Digital Asset Management Market Volume Share (%), by End User 2024 & 2032
- Figure 39: North America Digital Asset Management Market Revenue (Million), by Country 2024 & 2032
- Figure 40: North America Digital Asset Management Market Volume (K Unit), by Country 2024 & 2032
- Figure 41: North America Digital Asset Management Market Revenue Share (%), by Country 2024 & 2032
- Figure 42: North America Digital Asset Management Market Volume Share (%), by Country 2024 & 2032
- Figure 43: Europe Digital Asset Management Market Revenue (Million), by Deployment 2024 & 2032
- Figure 44: Europe Digital Asset Management Market Volume (K Unit), by Deployment 2024 & 2032
- Figure 45: Europe Digital Asset Management Market Revenue Share (%), by Deployment 2024 & 2032
- Figure 46: Europe Digital Asset Management Market Volume Share (%), by Deployment 2024 & 2032
- Figure 47: Europe Digital Asset Management Market Revenue (Million), by Organization Size 2024 & 2032
- Figure 48: Europe Digital Asset Management Market Volume (K Unit), by Organization Size 2024 & 2032
- Figure 49: Europe Digital Asset Management Market Revenue Share (%), by Organization Size 2024 & 2032
- Figure 50: Europe Digital Asset Management Market Volume Share (%), by Organization Size 2024 & 2032
- Figure 51: Europe Digital Asset Management Market Revenue (Million), by End User 2024 & 2032
- Figure 52: Europe Digital Asset Management Market Volume (K Unit), by End User 2024 & 2032
- Figure 53: Europe Digital Asset Management Market Revenue Share (%), by End User 2024 & 2032
- Figure 54: Europe Digital Asset Management Market Volume Share (%), by End User 2024 & 2032
- Figure 55: Europe Digital Asset Management Market Revenue (Million), by Country 2024 & 2032
- Figure 56: Europe Digital Asset Management Market Volume (K Unit), by Country 2024 & 2032
- Figure 57: Europe Digital Asset Management Market Revenue Share (%), by Country 2024 & 2032
- Figure 58: Europe Digital Asset Management Market Volume Share (%), by Country 2024 & 2032
- Figure 59: Asia Pacific Digital Asset Management Market Revenue (Million), by Deployment 2024 & 2032
- Figure 60: Asia Pacific Digital Asset Management Market Volume (K Unit), by Deployment 2024 & 2032
- Figure 61: Asia Pacific Digital Asset Management Market Revenue Share (%), by Deployment 2024 & 2032
- Figure 62: Asia Pacific Digital Asset Management Market Volume Share (%), by Deployment 2024 & 2032
- Figure 63: Asia Pacific Digital Asset Management Market Revenue (Million), by Organization Size 2024 & 2032
- Figure 64: Asia Pacific Digital Asset Management Market Volume (K Unit), by Organization Size 2024 & 2032
- Figure 65: Asia Pacific Digital Asset Management Market Revenue Share (%), by Organization Size 2024 & 2032
- Figure 66: Asia Pacific Digital Asset Management Market Volume Share (%), by Organization Size 2024 & 2032
- Figure 67: Asia Pacific Digital Asset Management Market Revenue (Million), by End User 2024 & 2032
- Figure 68: Asia Pacific Digital Asset Management Market Volume (K Unit), by End User 2024 & 2032
- Figure 69: Asia Pacific Digital Asset Management Market Revenue Share (%), by End User 2024 & 2032
- Figure 70: Asia Pacific Digital Asset Management Market Volume Share (%), by End User 2024 & 2032
- Figure 71: Asia Pacific Digital Asset Management Market Revenue (Million), by Country 2024 & 2032
- Figure 72: Asia Pacific Digital Asset Management Market Volume (K Unit), by Country 2024 & 2032
- Figure 73: Asia Pacific Digital Asset Management Market Revenue Share (%), by Country 2024 & 2032
- Figure 74: Asia Pacific Digital Asset Management Market Volume Share (%), by Country 2024 & 2032
- Figure 75: Rest of the World Digital Asset Management Market Revenue (Million), by Deployment 2024 & 2032
- Figure 76: Rest of the World Digital Asset Management Market Volume (K Unit), by Deployment 2024 & 2032
- Figure 77: Rest of the World Digital Asset Management Market Revenue Share (%), by Deployment 2024 & 2032
- Figure 78: Rest of the World Digital Asset Management Market Volume Share (%), by Deployment 2024 & 2032
- Figure 79: Rest of the World Digital Asset Management Market Revenue (Million), by Organization Size 2024 & 2032
- Figure 80: Rest of the World Digital Asset Management Market Volume (K Unit), by Organization Size 2024 & 2032
- Figure 81: Rest of the World Digital Asset Management Market Revenue Share (%), by Organization Size 2024 & 2032
- Figure 82: Rest of the World Digital Asset Management Market Volume Share (%), by Organization Size 2024 & 2032
- Figure 83: Rest of the World Digital Asset Management Market Revenue (Million), by End User 2024 & 2032
- Figure 84: Rest of the World Digital Asset Management Market Volume (K Unit), by End User 2024 & 2032
- Figure 85: Rest of the World Digital Asset Management Market Revenue Share (%), by End User 2024 & 2032
- Figure 86: Rest of the World Digital Asset Management Market Volume Share (%), by End User 2024 & 2032
- Figure 87: Rest of the World Digital Asset Management Market Revenue (Million), by Country 2024 & 2032
- Figure 88: Rest of the World Digital Asset Management Market Volume (K Unit), by Country 2024 & 2032
- Figure 89: Rest of the World Digital Asset Management Market Revenue Share (%), by Country 2024 & 2032
- Figure 90: Rest of the World Digital Asset Management Market Volume Share (%), by Country 2024 & 2032
List of Tables
- Table 1: Global Digital Asset Management Market Revenue Million Forecast, by Region 2019 & 2032
- Table 2: Global Digital Asset Management Market Volume K Unit Forecast, by Region 2019 & 2032
- Table 3: Global Digital Asset Management Market Revenue Million Forecast, by Deployment 2019 & 2032
- Table 4: Global Digital Asset Management Market Volume K Unit Forecast, by Deployment 2019 & 2032
- Table 5: Global Digital Asset Management Market Revenue Million Forecast, by Organization Size 2019 & 2032
- Table 6: Global Digital Asset Management Market Volume K Unit Forecast, by Organization Size 2019 & 2032
- Table 7: Global Digital Asset Management Market Revenue Million Forecast, by End User 2019 & 2032
- Table 8: Global Digital Asset Management Market Volume K Unit Forecast, by End User 2019 & 2032
- Table 9: Global Digital Asset Management Market Revenue Million Forecast, by Region 2019 & 2032
- Table 10: Global Digital Asset Management Market Volume K Unit Forecast, by Region 2019 & 2032
- Table 11: Global Digital Asset Management Market Revenue Million Forecast, by Country 2019 & 2032
- Table 12: Global Digital Asset Management Market Volume K Unit Forecast, by Country 2019 & 2032
- Table 13: United States Digital Asset Management Market Revenue (Million) Forecast, by Application 2019 & 2032
- Table 14: United States Digital Asset Management Market Volume (K Unit) Forecast, by Application 2019 & 2032
- Table 15: Canada Digital Asset Management Market Revenue (Million) Forecast, by Application 2019 & 2032
- Table 16: Canada Digital Asset Management Market Volume (K Unit) Forecast, by Application 2019 & 2032
- Table 17: Mexico Digital Asset Management Market Revenue (Million) Forecast, by Application 2019 & 2032
- Table 18: Mexico Digital Asset Management Market Volume (K Unit) Forecast, by Application 2019 & 2032
- Table 19: Global Digital Asset Management Market Revenue Million Forecast, by Country 2019 & 2032
- Table 20: Global Digital Asset Management Market Volume K Unit Forecast, by Country 2019 & 2032
- Table 21: Germany Digital Asset Management Market Revenue (Million) Forecast, by Application 2019 & 2032
- Table 22: Germany Digital Asset Management Market Volume (K Unit) Forecast, by Application 2019 & 2032
- Table 23: United Kingdom Digital Asset Management Market Revenue (Million) Forecast, by Application 2019 & 2032
- Table 24: United Kingdom Digital Asset Management Market Volume (K Unit) Forecast, by Application 2019 & 2032
- Table 25: France Digital Asset Management Market Revenue (Million) Forecast, by Application 2019 & 2032
- Table 26: France Digital Asset Management Market Volume (K Unit) Forecast, by Application 2019 & 2032
- Table 27: Spain Digital Asset Management Market Revenue (Million) Forecast, by Application 2019 & 2032
- Table 28: Spain Digital Asset Management Market Volume (K Unit) Forecast, by Application 2019 & 2032
- Table 29: Italy Digital Asset Management Market Revenue (Million) Forecast, by Application 2019 & 2032
- Table 30: Italy Digital Asset Management Market Volume (K Unit) Forecast, by Application 2019 & 2032
- Table 31: Spain Digital Asset Management Market Revenue (Million) Forecast, by Application 2019 & 2032
- Table 32: Spain Digital Asset Management Market Volume (K Unit) Forecast, by Application 2019 & 2032
- Table 33: Belgium Digital Asset Management Market Revenue (Million) Forecast, by Application 2019 & 2032
- Table 34: Belgium Digital Asset Management Market Volume (K Unit) Forecast, by Application 2019 & 2032
- Table 35: Netherland Digital Asset Management Market Revenue (Million) Forecast, by Application 2019 & 2032
- Table 36: Netherland Digital Asset Management Market Volume (K Unit) Forecast, by Application 2019 & 2032
- Table 37: Nordics Digital Asset Management Market Revenue (Million) Forecast, by Application 2019 & 2032
- Table 38: Nordics Digital Asset Management Market Volume (K Unit) Forecast, by Application 2019 & 2032
- Table 39: Rest of Europe Digital Asset Management Market Revenue (Million) Forecast, by Application 2019 & 2032
- Table 40: Rest of Europe Digital Asset Management Market Volume (K Unit) Forecast, by Application 2019 & 2032
- Table 41: Global Digital Asset Management Market Revenue Million Forecast, by Country 2019 & 2032
- Table 42: Global Digital Asset Management Market Volume K Unit Forecast, by Country 2019 & 2032
- Table 43: China Digital Asset Management Market Revenue (Million) Forecast, by Application 2019 & 2032
- Table 44: China Digital Asset Management Market Volume (K Unit) Forecast, by Application 2019 & 2032
- Table 45: Japan Digital Asset Management Market Revenue (Million) Forecast, by Application 2019 & 2032
- Table 46: Japan Digital Asset Management Market Volume (K Unit) Forecast, by Application 2019 & 2032
- Table 47: India Digital Asset Management Market Revenue (Million) Forecast, by Application 2019 & 2032
- Table 48: India Digital Asset Management Market Volume (K Unit) Forecast, by Application 2019 & 2032
- Table 49: South Korea Digital Asset Management Market Revenue (Million) Forecast, by Application 2019 & 2032
- Table 50: South Korea Digital Asset Management Market Volume (K Unit) Forecast, by Application 2019 & 2032
- Table 51: Southeast Asia Digital Asset Management Market Revenue (Million) Forecast, by Application 2019 & 2032
- Table 52: Southeast Asia Digital Asset Management Market Volume (K Unit) Forecast, by Application 2019 & 2032
- Table 53: Australia Digital Asset Management Market Revenue (Million) Forecast, by Application 2019 & 2032
- Table 54: Australia Digital Asset Management Market Volume (K Unit) Forecast, by Application 2019 & 2032
- Table 55: Indonesia Digital Asset Management Market Revenue (Million) Forecast, by Application 2019 & 2032
- Table 56: Indonesia Digital Asset Management Market Volume (K Unit) Forecast, by Application 2019 & 2032
- Table 57: Phillipes Digital Asset Management Market Revenue (Million) Forecast, by Application 2019 & 2032
- Table 58: Phillipes Digital Asset Management Market Volume (K Unit) Forecast, by Application 2019 & 2032
- Table 59: Singapore Digital Asset Management Market Revenue (Million) Forecast, by Application 2019 & 2032
- Table 60: Singapore Digital Asset Management Market Volume (K Unit) Forecast, by Application 2019 & 2032
- Table 61: Thailandc Digital Asset Management Market Revenue (Million) Forecast, by Application 2019 & 2032
- Table 62: Thailandc Digital Asset Management Market Volume (K Unit) Forecast, by Application 2019 & 2032
- Table 63: Rest of Asia Pacific Digital Asset Management Market Revenue (Million) Forecast, by Application 2019 & 2032
- Table 64: Rest of Asia Pacific Digital Asset Management Market Volume (K Unit) Forecast, by Application 2019 & 2032
- Table 65: Global Digital Asset Management Market Revenue Million Forecast, by Country 2019 & 2032
- Table 66: Global Digital Asset Management Market Volume K Unit Forecast, by Country 2019 & 2032
- Table 67: Brazil Digital Asset Management Market Revenue (Million) Forecast, by Application 2019 & 2032
- Table 68: Brazil Digital Asset Management Market Volume (K Unit) Forecast, by Application 2019 & 2032
- Table 69: Argentina Digital Asset Management Market Revenue (Million) Forecast, by Application 2019 & 2032
- Table 70: Argentina Digital Asset Management Market Volume (K Unit) Forecast, by Application 2019 & 2032
- Table 71: Peru Digital Asset Management Market Revenue (Million) Forecast, by Application 2019 & 2032
- Table 72: Peru Digital Asset Management Market Volume (K Unit) Forecast, by Application 2019 & 2032
- Table 73: Chile Digital Asset Management Market Revenue (Million) Forecast, by Application 2019 & 2032
- Table 74: Chile Digital Asset Management Market Volume (K Unit) Forecast, by Application 2019 & 2032
- Table 75: Colombia Digital Asset Management Market Revenue (Million) Forecast, by Application 2019 & 2032
- Table 76: Colombia Digital Asset Management Market Volume (K Unit) Forecast, by Application 2019 & 2032
- Table 77: Ecuador Digital Asset Management Market Revenue (Million) Forecast, by Application 2019 & 2032
- Table 78: Ecuador Digital Asset Management Market Volume (K Unit) Forecast, by Application 2019 & 2032
- Table 79: Venezuela Digital Asset Management Market Revenue (Million) Forecast, by Application 2019 & 2032
- Table 80: Venezuela Digital Asset Management Market Volume (K Unit) Forecast, by Application 2019 & 2032
- Table 81: Rest of South America Digital Asset Management Market Revenue (Million) Forecast, by Application 2019 & 2032
- Table 82: Rest of South America Digital Asset Management Market Volume (K Unit) Forecast, by Application 2019 & 2032
- Table 83: Global Digital Asset Management Market Revenue Million Forecast, by Country 2019 & 2032
- Table 84: Global Digital Asset Management Market Volume K Unit Forecast, by Country 2019 & 2032
- Table 85: United States Digital Asset Management Market Revenue (Million) Forecast, by Application 2019 & 2032
- Table 86: United States Digital Asset Management Market Volume (K Unit) Forecast, by Application 2019 & 2032
- Table 87: Canada Digital Asset Management Market Revenue (Million) Forecast, by Application 2019 & 2032
- Table 88: Canada Digital Asset Management Market Volume (K Unit) Forecast, by Application 2019 & 2032
- Table 89: Mexico Digital Asset Management Market Revenue (Million) Forecast, by Application 2019 & 2032
- Table 90: Mexico Digital Asset Management Market Volume (K Unit) Forecast, by Application 2019 & 2032
- Table 91: Global Digital Asset Management Market Revenue Million Forecast, by Country 2019 & 2032
- Table 92: Global Digital Asset Management Market Volume K Unit Forecast, by Country 2019 & 2032
- Table 93: United Arab Emirates Digital Asset Management Market Revenue (Million) Forecast, by Application 2019 & 2032
- Table 94: United Arab Emirates Digital Asset Management Market Volume (K Unit) Forecast, by Application 2019 & 2032
- Table 95: Saudi Arabia Digital Asset Management Market Revenue (Million) Forecast, by Application 2019 & 2032
- Table 96: Saudi Arabia Digital Asset Management Market Volume (K Unit) Forecast, by Application 2019 & 2032
- Table 97: South Africa Digital Asset Management Market Revenue (Million) Forecast, by Application 2019 & 2032
- Table 98: South Africa Digital Asset Management Market Volume (K Unit) Forecast, by Application 2019 & 2032
- Table 99: Rest of Middle East and Africa Digital Asset Management Market Revenue (Million) Forecast, by Application 2019 & 2032
- Table 100: Rest of Middle East and Africa Digital Asset Management Market Volume (K Unit) Forecast, by Application 2019 & 2032
- Table 101: Global Digital Asset Management Market Revenue Million Forecast, by Deployment 2019 & 2032
- Table 102: Global Digital Asset Management Market Volume K Unit Forecast, by Deployment 2019 & 2032
- Table 103: Global Digital Asset Management Market Revenue Million Forecast, by Organization Size 2019 & 2032
- Table 104: Global Digital Asset Management Market Volume K Unit Forecast, by Organization Size 2019 & 2032
- Table 105: Global Digital Asset Management Market Revenue Million Forecast, by End User 2019 & 2032
- Table 106: Global Digital Asset Management Market Volume K Unit Forecast, by End User 2019 & 2032
- Table 107: Global Digital Asset Management Market Revenue Million Forecast, by Country 2019 & 2032
- Table 108: Global Digital Asset Management Market Volume K Unit Forecast, by Country 2019 & 2032
- Table 109: United States Digital Asset Management Market Revenue (Million) Forecast, by Application 2019 & 2032
- Table 110: United States Digital Asset Management Market Volume (K Unit) Forecast, by Application 2019 & 2032
- Table 111: Canada Digital Asset Management Market Revenue (Million) Forecast, by Application 2019 & 2032
- Table 112: Canada Digital Asset Management Market Volume (K Unit) Forecast, by Application 2019 & 2032
- Table 113: Global Digital Asset Management Market Revenue Million Forecast, by Deployment 2019 & 2032
- Table 114: Global Digital Asset Management Market Volume K Unit Forecast, by Deployment 2019 & 2032
- Table 115: Global Digital Asset Management Market Revenue Million Forecast, by Organization Size 2019 & 2032
- Table 116: Global Digital Asset Management Market Volume K Unit Forecast, by Organization Size 2019 & 2032
- Table 117: Global Digital Asset Management Market Revenue Million Forecast, by End User 2019 & 2032
- Table 118: Global Digital Asset Management Market Volume K Unit Forecast, by End User 2019 & 2032
- Table 119: Global Digital Asset Management Market Revenue Million Forecast, by Country 2019 & 2032
- Table 120: Global Digital Asset Management Market Volume K Unit Forecast, by Country 2019 & 2032
- Table 121: United Kingdom Digital Asset Management Market Revenue (Million) Forecast, by Application 2019 & 2032
- Table 122: United Kingdom Digital Asset Management Market Volume (K Unit) Forecast, by Application 2019 & 2032
- Table 123: Germany Digital Asset Management Market Revenue (Million) Forecast, by Application 2019 & 2032
- Table 124: Germany Digital Asset Management Market Volume (K Unit) Forecast, by Application 2019 & 2032
- Table 125: France Digital Asset Management Market Revenue (Million) Forecast, by Application 2019 & 2032
- Table 126: France Digital Asset Management Market Volume (K Unit) Forecast, by Application 2019 & 2032
- Table 127: Rest of Europe Digital Asset Management Market Revenue (Million) Forecast, by Application 2019 & 2032
- Table 128: Rest of Europe Digital Asset Management Market Volume (K Unit) Forecast, by Application 2019 & 2032
- Table 129: Global Digital Asset Management Market Revenue Million Forecast, by Deployment 2019 & 2032
- Table 130: Global Digital Asset Management Market Volume K Unit Forecast, by Deployment 2019 & 2032
- Table 131: Global Digital Asset Management Market Revenue Million Forecast, by Organization Size 2019 & 2032
- Table 132: Global Digital Asset Management Market Volume K Unit Forecast, by Organization Size 2019 & 2032
- Table 133: Global Digital Asset Management Market Revenue Million Forecast, by End User 2019 & 2032
- Table 134: Global Digital Asset Management Market Volume K Unit Forecast, by End User 2019 & 2032
- Table 135: Global Digital Asset Management Market Revenue Million Forecast, by Country 2019 & 2032
- Table 136: Global Digital Asset Management Market Volume K Unit Forecast, by Country 2019 & 2032
- Table 137: China Digital Asset Management Market Revenue (Million) Forecast, by Application 2019 & 2032
- Table 138: China Digital Asset Management Market Volume (K Unit) Forecast, by Application 2019 & 2032
- Table 139: India Digital Asset Management Market Revenue (Million) Forecast, by Application 2019 & 2032
- Table 140: India Digital Asset Management Market Volume (K Unit) Forecast, by Application 2019 & 2032
- Table 141: Japan Digital Asset Management Market Revenue (Million) Forecast, by Application 2019 & 2032
- Table 142: Japan Digital Asset Management Market Volume (K Unit) Forecast, by Application 2019 & 2032
- Table 143: Rest of Asia Pacific Digital Asset Management Market Revenue (Million) Forecast, by Application 2019 & 2032
- Table 144: Rest of Asia Pacific Digital Asset Management Market Volume (K Unit) Forecast, by Application 2019 & 2032
- Table 145: Global Digital Asset Management Market Revenue Million Forecast, by Deployment 2019 & 2032
- Table 146: Global Digital Asset Management Market Volume K Unit Forecast, by Deployment 2019 & 2032
- Table 147: Global Digital Asset Management Market Revenue Million Forecast, by Organization Size 2019 & 2032
- Table 148: Global Digital Asset Management Market Volume K Unit Forecast, by Organization Size 2019 & 2032
- Table 149: Global Digital Asset Management Market Revenue Million Forecast, by End User 2019 & 2032
- Table 150: Global Digital Asset Management Market Volume K Unit Forecast, by End User 2019 & 2032
- Table 151: Global Digital Asset Management Market Revenue Million Forecast, by Country 2019 & 2032
- Table 152: Global Digital Asset Management Market Volume K Unit Forecast, by Country 2019 & 2032
Frequently Asked Questions
1. What is the projected Compound Annual Growth Rate (CAGR) of the Digital Asset Management Market?
The projected CAGR is approximately 14.16%.
2. Which companies are prominent players in the Digital Asset Management Market?
Key companies in the market include MediaBeacon Inc (R3volution), IBM Corporation, Aprimo LLC (ADAM Software), Cognizant Technology Solutions Corp (assetServ), Cloudinary Ltd (Digital Asset Management), Digizuite A/, Adobe Systems Incorporated (Adobe Experience Manager Assets), Oracle Corporation (Oracle WebCenter Content), CELUM GmbH (CELUM Digital Asset Management), Nuxeo (Nuxeo Platform), Bynder(Webdam Inc ), Extensis (Celartem Inc ), Widen (Digital Asset Management), OpenText Corporation (Media Management MediaBin), Canto Inc (Canto Digital Asset Management).
3. What are the main segments of the Digital Asset Management Market?
The market segments include Deployment, Organization Size, End User.
4. Can you provide details about the market size?
The market size is estimated to be USD 5.88 Million as of 2022.
5. What are some drivers contributing to market growth?
Increase in the Number of Digital Assets.
6. What are the notable trends driving market growth?
Cloud Deployment to Hold Significant Market Share.
7. Are there any restraints impacting market growth?
Risk of Data Security Threats.
8. Can you provide examples of recent developments in the market?
December 2023: OpenText and Vue.ai joined forces to expand their Digital Asset Management solutions. They focused on AI-powered tagging for media assets, signaling the growing demand for AI-driven DAM solutions.
9. What pricing options are available for accessing the report?
Pricing options include single-user, multi-user, and enterprise licenses priced at USD 4750, USD 5250, and USD 8750 respectively.
10. Is the market size provided in terms of value or volume?
The market size is provided in terms of value, measured in Million and volume, measured in K Unit.
11. Are there any specific market keywords associated with the report?
Yes, the market keyword associated with the report is "Digital Asset Management Market," which aids in identifying and referencing the specific market segment covered.
12. How do I determine which pricing option suits my needs best?
The pricing options vary based on user requirements and access needs. Individual users may opt for single-user licenses, while businesses requiring broader access may choose multi-user or enterprise licenses for cost-effective access to the report.
13. Are there any additional resources or data provided in the Digital Asset Management Market report?
While the report offers comprehensive insights, it's advisable to review the specific contents or supplementary materials provided to ascertain if additional resources or data are available.
14. How can I stay updated on further developments or reports in the Digital Asset Management Market?
To stay informed about further developments, trends, and reports in the Digital Asset Management Market, consider subscribing to industry newsletters, following relevant companies and organizations, or regularly checking reputable industry news sources and publications.
Methodology
Step 1 - Identification of Relevant Samples Size from Population Database


Step 2 - Approaches for Defining Global Market Size (Value, Volume* & Price*)

Note*: In applicable scenarios
Step 3 - Data Sources
Primary Research
- Web Analytics
- Survey Reports
- Research Institute
- Latest Research Reports
- Opinion Leaders
Secondary Research
- Annual Reports
- White Paper
- Latest Press Release
- Industry Association
- Paid Database
- Investor Presentations

Step 4 - Data Triangulation
Involves using different sources of information in order to increase the validity of a study
These sources are likely to be stakeholders in a program - participants, other researchers, program staff, other community members, and so on.
Then we put all data in single framework & apply various statistical tools to find out the dynamic on the market.
During the analysis stage, feedback from the stakeholder groups would be compared to determine areas of agreement as well as areas of divergence


