
Key Insights
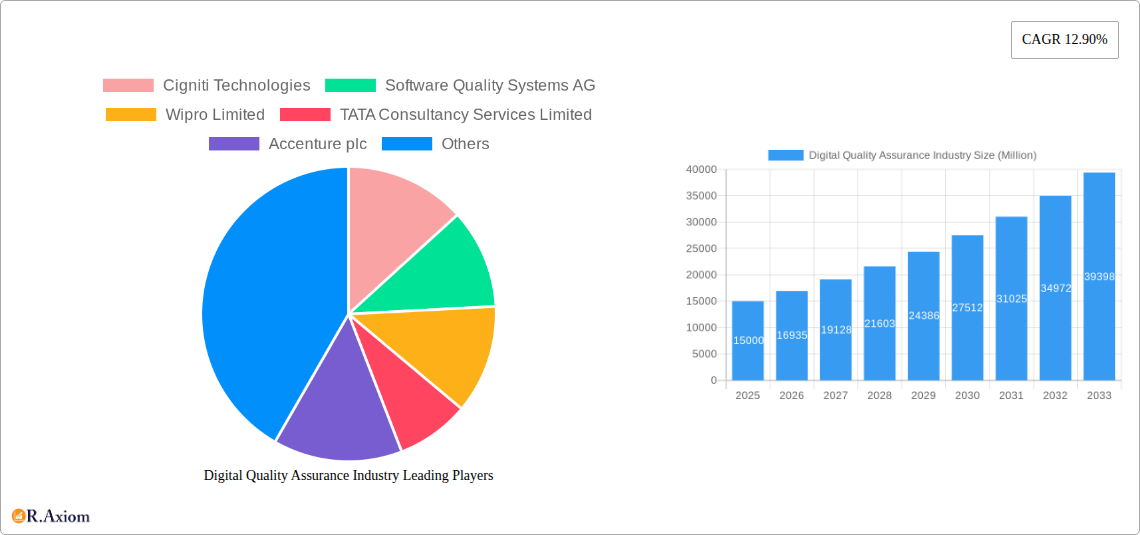
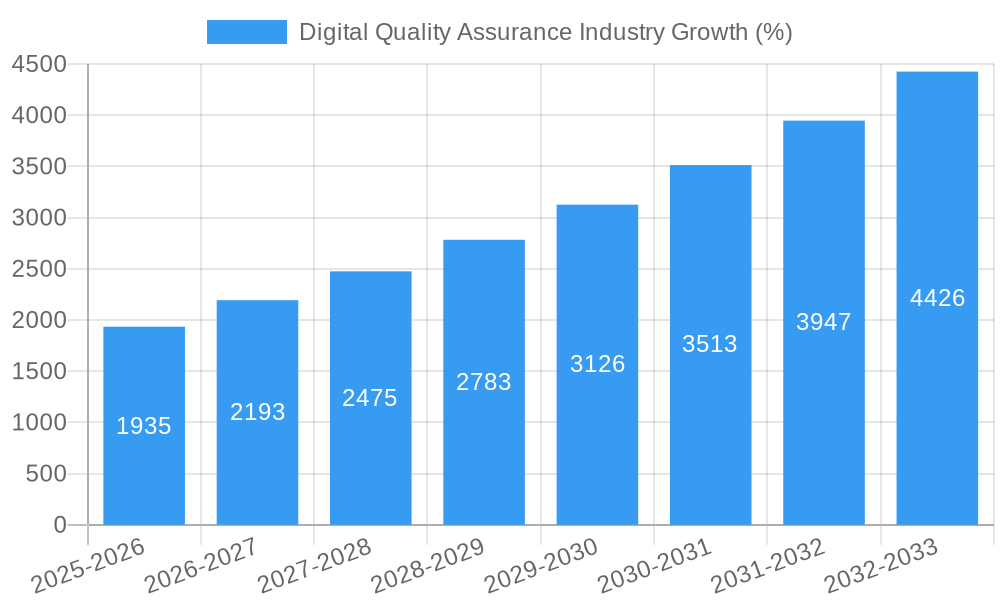
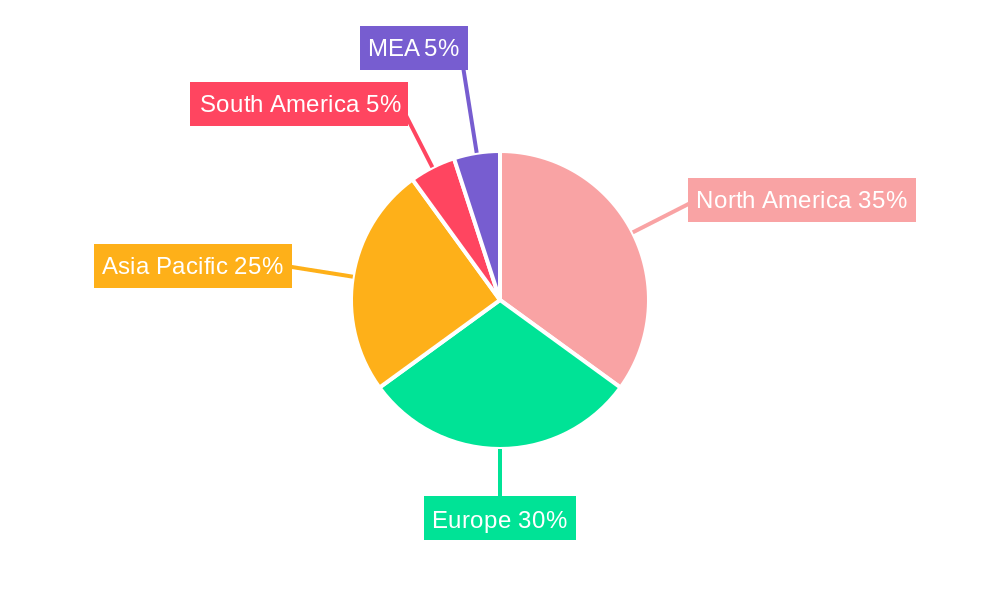
The Digital Quality Assurance (DQA) market is experiencing robust growth, driven by the increasing reliance on software and digital applications across diverse sectors. The market's Compound Annual Growth Rate (CAGR) of 12.90% from 2019-2024 indicates a significant upward trajectory. This expansion is fueled by several key factors: the rising adoption of agile and DevOps methodologies demanding continuous testing; the escalating need for robust security testing in response to cyber threats; and the proliferation of mobile and cloud-based applications requiring comprehensive quality assurance. Furthermore, the growing demand for performance and usability testing to ensure optimal user experience is further propelling market growth. The market is segmented by deployment mode (manual and automated testing), end-user verticals (Government, BFSI, Healthcare, Manufacturing, IT & Telecommunication, Media & Entertainment, and Others), and testing type (functional, performance & usability, security, API, and network testing). North America and Europe currently hold significant market shares due to established technological infrastructure and high software adoption rates; however, the Asia-Pacific region is projected to witness substantial growth in the coming years driven by rapid digital transformation initiatives and a burgeoning IT sector.
The competitive landscape is characterized by a mix of large established players like Accenture, TCS, and Wipro, and specialized niche players focusing on specific testing types or verticals. These companies are actively investing in research and development to incorporate Artificial Intelligence (AI) and Machine Learning (ML) into their testing solutions, improving efficiency and accuracy. The market's future growth will be influenced by advancements in test automation technologies, the increasing adoption of cloud-based testing services, and the growing demand for specialized skills in areas like AI-powered testing and cybersecurity testing. While regulatory compliance and the potential skills gap in the QA workforce pose some challenges, the overall outlook for the DQA market remains positive, promising significant opportunities for market participants.
This comprehensive report provides a detailed analysis of the Digital Quality Assurance (DQA) industry, encompassing market size, growth drivers, competitive landscape, and future trends. The study period covers 2019-2033, with a base year of 2025 and a forecast period of 2025-2033. The report offers actionable insights for industry stakeholders, investors, and businesses seeking to navigate the evolving DQA landscape. The market is valued at $XX Million in 2025 and is projected to reach $XX Million by 2033, exhibiting a robust Compound Annual Growth Rate (CAGR) of XX%.
Digital Quality Assurance Industry Market Concentration & Innovation
The Digital Quality Assurance market exhibits a moderately concentrated landscape, with several key players commanding significant market share. Companies like Cigniti Technologies, Wipro Limited, Tata Consultancy Services Limited, Accenture plc, and Capgemini SE are major contributors, leveraging their extensive experience and global reach. Market share estimates for 2025 suggest that the top 5 players account for approximately XX% of the total market.
Innovation within the industry is driven by several factors:
- Technological advancements: The rise of AI, machine learning, and automation in testing methodologies is fueling innovation, enhancing efficiency, and reducing costs.
- Growing demand for digital transformation: The increasing adoption of digital technologies across various industries is creating a significant demand for robust quality assurance solutions.
- Stringent regulatory compliance: Industries like BFSI and healthcare are subject to stringent regulatory frameworks, necessitating thorough testing and compliance validation.
- Increased focus on cybersecurity: The growing threat of cyberattacks is driving the demand for advanced security testing solutions.
Mergers and acquisitions (M&A) are a prominent feature of the market's competitive dynamics. Recent deals like ProArch's acquisition of Enhops in February 2022 demonstrate a trend towards consolidation and expansion of capabilities. The value of M&A deals in the DQA sector totaled approximately $XX Million in 2024, reflecting the ongoing industry reshaping. Product substitutes, while limited, include in-house testing teams, but their scalability and expertise often fall short of specialized DQA providers. End-user trends show a shift towards cloud-based testing solutions and increased demand for automation.
Digital Quality Assurance Industry Industry Trends & Insights
The DQA market is experiencing substantial growth, driven primarily by the increasing adoption of digital technologies and the growing need for high-quality software and applications. The market is characterized by a high degree of innovation, with continuous advancements in testing methodologies and tools. Technological disruptions, particularly the rise of AI and automation, are transforming the DQA landscape, significantly improving efficiency and accuracy.
Consumer preferences are shifting towards agile and DevOps-based testing approaches, demanding faster turnaround times and seamless integration with development cycles. Competitive dynamics are intense, with companies focusing on differentiation through specialized services, advanced technologies, and strategic partnerships. The market penetration of automation testing is increasing steadily, projected to reach XX% by 2033. The CAGR for the DQA market during the forecast period (2025-2033) is estimated to be XX%, indicating strong growth potential.
Dominant Markets & Segments in Digital Quality Assurance Industry
The North American region dominates the global DQA market, driven by factors like robust IT infrastructure, high adoption rates of digital technologies, and a strong emphasis on software quality. Within the market segments:
- Testing Mode: Test Automation Deployment is the fastest-growing segment, driven by increased efficiency and reduced costs.
- End-user Verticals: The BFSI sector holds a significant market share due to strict regulatory requirements and the criticality of reliable systems. Healthcare and IT & Telecommunications also exhibit significant growth.
- By Testing Type: Functional Testing remains the largest segment, followed by Performance & Usability testing. Security Testing is experiencing substantial growth due to heightened security concerns.
Key Drivers for Regional Dominance:
- North America: Strong technological infrastructure, early adoption of automation, and a large pool of skilled professionals.
- Europe: Growing adoption of digital technologies across diverse industries, stringent regulatory standards, and a burgeoning startup ecosystem.
- Asia-Pacific: Rapid digitalization, expanding IT sector, cost-effective testing services, and a large talent pool.
Detailed dominance analysis reveals that North America's market share is approximately XX% in 2025.
Digital Quality Assurance Industry Product Developments
Recent product developments focus on AI-powered test automation, intelligent test case generation, and advanced security testing solutions. These innovations offer improved efficiency, reduced testing cycles, and enhanced accuracy. The integration of AI and Machine Learning is enabling predictive analytics and proactive risk management in testing, further enhancing the value proposition of DQA services. This addresses the market’s need for faster, more efficient, and secure software deployment.
Report Scope & Segmentation Analysis
This report segments the DQA market across several key parameters:
- Testing Mode: Manual Testing Deployment and Test Automation Deployment. Test Automation Deployment exhibits a higher growth projection.
- End-user Verticals: Government, BFSI, Healthcare, Manufacturing, IT & Telecommunication, Media & Entertainment, and Others. BFSI shows high growth potential.
- By Testing Type: Functional Testing Solution, Performance & Usability Testing, Security Testing, API Testing, and Network Testing. Security testing is the fastest-growing segment.
Each segment's market size, growth projections, and competitive dynamics are analyzed in detail within the report, offering granular insights into the DQA market landscape.
Key Drivers of Digital Quality Assurance Industry Growth
Several factors are driving the growth of the DQA industry:
- The increasing adoption of cloud computing and digital transformation initiatives: Businesses are relying heavily on cloud-based applications and services, creating a greater demand for robust quality assurance.
- The rising need for enhanced software security and compliance: Security breaches and regulatory violations have heightened the demand for comprehensive security testing.
- The growing demand for automation and AI-powered testing solutions: These technologies significantly improve testing efficiency and reduce costs.
Challenges in the Digital Quality Assurance Industry Sector
Challenges facing the DQA industry include:
- The skills gap: Finding and retaining skilled professionals with expertise in cutting-edge testing technologies is a major challenge. This shortage increases costs and slows down development.
- Keeping pace with technological advancements: Rapid technological changes demand continuous learning and adaptation.
- Balancing cost and quality: Providing high-quality assurance services while maintaining cost-effectiveness is a continuous challenge for DQA providers.
Emerging Opportunities in Digital Quality Assurance Industry
Emerging opportunities include:
- Expansion into new technologies: The growth of IoT, AI, and blockchain creates opportunities for specialized testing services in these areas.
- Increased demand for specialized testing services: Specific industries, like healthcare and finance, demand specialized testing solutions aligned with their regulatory requirements.
- Growth of AI-powered testing platforms: The development and deployment of AI-powered tools offer efficiency gains.
Leading Players in the Digital Quality Assurance Industry Market
- Cigniti Technologies
- Software Quality Systems AG
- Wipro Limited
- TATA Consultancy Services Limited
- Accenture plc
- Hexaware Technologies
- Capgemini SE
- Thinksys Inc
- DXC Technology Company
- Atos SE
- Sixth Gear Studios
- Micro Focus
- Maven Infosoft Pvt Ltd
Key Developments in Digital Quality Assurance Industry Industry
- September 2022: Cigniti Technologies opened a NICU/SNCU facility in Hyderabad, demonstrating corporate social responsibility and highlighting the company's reach beyond typical DQA services.
- February 2022: ProArch's acquisition of Enhops expanded its quality assurance capabilities and market reach, illustrating consolidation within the industry.
Strategic Outlook for Digital Quality Assurance Industry Market
The future of the DQA market is bright, driven by continued digital transformation across various industries, the increasing adoption of automation, and the rising demand for secure and high-quality software. Companies that can leverage AI, machine learning, and other advanced technologies to offer innovative and cost-effective solutions are expected to thrive. The market will continue to consolidate, with larger players acquiring smaller firms to expand their capabilities and market share. Focus on specialized testing services for emerging technologies will be crucial for success.
Digital Quality Assurance Industry Segmentation
-
1. Testing Type
- 1.1. Functional Testing Solution
- 1.2. Performance & Usability Testing
- 1.3. Security Testing
- 1.4. API Testing
- 1.5. Network Testing
-
2. Testing Mode
- 2.1. Manual Testing Deployment
- 2.2. Test Automation Deployment
-
3. End-user Verticals
- 3.1. Government
- 3.2. BFSI
- 3.3. Healthcare
- 3.4. Manufacturing
- 3.5. IT & Telecommunication
- 3.6. Media & Entertainment
- 3.7. Others End-Users
Digital Quality Assurance Industry Segmentation By Geography
- 1. North America
- 2. Europe
- 3. Asia Pacific
- 4. Latin America
- 5. Middle East
Digital Quality Assurance Industry REPORT HIGHLIGHTS
| Aspects | Details |
|---|---|
| Study Period | 2019-2033 |
| Base Year | 2024 |
| Estimated Year | 2025 |
| Forecast Period | 2025-2033 |
| Historical Period | 2019-2024 |
| Growth Rate | CAGR of 12.90% from 2019-2033 |
| Segmentation |
|
Table of Contents
- 1. Introduction
- 1.1. Research Scope
- 1.2. Market Segmentation
- 1.3. Research Methodology
- 1.4. Definitions and Assumptions
- 2. Executive Summary
- 2.1. Introduction
- 3. Market Dynamics
- 3.1. Introduction
- 3.2. Market Drivers
- 3.2.1. Growing Need of API Monitoring in the Digital Economy; The Increasing Use of Test Automation Leads to Lower the Operational Costs and Enhance the QA
- 3.3. Market Restrains
- 3.3.1. High Initial Setup Cost; Large Installation Space
- 3.4. Market Trends
- 3.4.1. Healthcare sector is expected to register significant growth
- 4. Market Factor Analysis
- 4.1. Porters Five Forces
- 4.2. Supply/Value Chain
- 4.3. PESTEL analysis
- 4.4. Market Entropy
- 4.5. Patent/Trademark Analysis
- 5. Global Digital Quality Assurance Industry Analysis, Insights and Forecast, 2019-2031
- 5.1. Market Analysis, Insights and Forecast - by Testing Type
- 5.1.1. Functional Testing Solution
- 5.1.2. Performance & Usability Testing
- 5.1.3. Security Testing
- 5.1.4. API Testing
- 5.1.5. Network Testing
- 5.2. Market Analysis, Insights and Forecast - by Testing Mode
- 5.2.1. Manual Testing Deployment
- 5.2.2. Test Automation Deployment
- 5.3. Market Analysis, Insights and Forecast - by End-user Verticals
- 5.3.1. Government
- 5.3.2. BFSI
- 5.3.3. Healthcare
- 5.3.4. Manufacturing
- 5.3.5. IT & Telecommunication
- 5.3.6. Media & Entertainment
- 5.3.7. Others End-Users
- 5.4. Market Analysis, Insights and Forecast - by Region
- 5.4.1. North America
- 5.4.2. Europe
- 5.4.3. Asia Pacific
- 5.4.4. Latin America
- 5.4.5. Middle East
- 5.1. Market Analysis, Insights and Forecast - by Testing Type
- 6. North America Digital Quality Assurance Industry Analysis, Insights and Forecast, 2019-2031
- 6.1. Market Analysis, Insights and Forecast - by Testing Type
- 6.1.1. Functional Testing Solution
- 6.1.2. Performance & Usability Testing
- 6.1.3. Security Testing
- 6.1.4. API Testing
- 6.1.5. Network Testing
- 6.2. Market Analysis, Insights and Forecast - by Testing Mode
- 6.2.1. Manual Testing Deployment
- 6.2.2. Test Automation Deployment
- 6.3. Market Analysis, Insights and Forecast - by End-user Verticals
- 6.3.1. Government
- 6.3.2. BFSI
- 6.3.3. Healthcare
- 6.3.4. Manufacturing
- 6.3.5. IT & Telecommunication
- 6.3.6. Media & Entertainment
- 6.3.7. Others End-Users
- 6.1. Market Analysis, Insights and Forecast - by Testing Type
- 7. Europe Digital Quality Assurance Industry Analysis, Insights and Forecast, 2019-2031
- 7.1. Market Analysis, Insights and Forecast - by Testing Type
- 7.1.1. Functional Testing Solution
- 7.1.2. Performance & Usability Testing
- 7.1.3. Security Testing
- 7.1.4. API Testing
- 7.1.5. Network Testing
- 7.2. Market Analysis, Insights and Forecast - by Testing Mode
- 7.2.1. Manual Testing Deployment
- 7.2.2. Test Automation Deployment
- 7.3. Market Analysis, Insights and Forecast - by End-user Verticals
- 7.3.1. Government
- 7.3.2. BFSI
- 7.3.3. Healthcare
- 7.3.4. Manufacturing
- 7.3.5. IT & Telecommunication
- 7.3.6. Media & Entertainment
- 7.3.7. Others End-Users
- 7.1. Market Analysis, Insights and Forecast - by Testing Type
- 8. Asia Pacific Digital Quality Assurance Industry Analysis, Insights and Forecast, 2019-2031
- 8.1. Market Analysis, Insights and Forecast - by Testing Type
- 8.1.1. Functional Testing Solution
- 8.1.2. Performance & Usability Testing
- 8.1.3. Security Testing
- 8.1.4. API Testing
- 8.1.5. Network Testing
- 8.2. Market Analysis, Insights and Forecast - by Testing Mode
- 8.2.1. Manual Testing Deployment
- 8.2.2. Test Automation Deployment
- 8.3. Market Analysis, Insights and Forecast - by End-user Verticals
- 8.3.1. Government
- 8.3.2. BFSI
- 8.3.3. Healthcare
- 8.3.4. Manufacturing
- 8.3.5. IT & Telecommunication
- 8.3.6. Media & Entertainment
- 8.3.7. Others End-Users
- 8.1. Market Analysis, Insights and Forecast - by Testing Type
- 9. Latin America Digital Quality Assurance Industry Analysis, Insights and Forecast, 2019-2031
- 9.1. Market Analysis, Insights and Forecast - by Testing Type
- 9.1.1. Functional Testing Solution
- 9.1.2. Performance & Usability Testing
- 9.1.3. Security Testing
- 9.1.4. API Testing
- 9.1.5. Network Testing
- 9.2. Market Analysis, Insights and Forecast - by Testing Mode
- 9.2.1. Manual Testing Deployment
- 9.2.2. Test Automation Deployment
- 9.3. Market Analysis, Insights and Forecast - by End-user Verticals
- 9.3.1. Government
- 9.3.2. BFSI
- 9.3.3. Healthcare
- 9.3.4. Manufacturing
- 9.3.5. IT & Telecommunication
- 9.3.6. Media & Entertainment
- 9.3.7. Others End-Users
- 9.1. Market Analysis, Insights and Forecast - by Testing Type
- 10. Middle East Digital Quality Assurance Industry Analysis, Insights and Forecast, 2019-2031
- 10.1. Market Analysis, Insights and Forecast - by Testing Type
- 10.1.1. Functional Testing Solution
- 10.1.2. Performance & Usability Testing
- 10.1.3. Security Testing
- 10.1.4. API Testing
- 10.1.5. Network Testing
- 10.2. Market Analysis, Insights and Forecast - by Testing Mode
- 10.2.1. Manual Testing Deployment
- 10.2.2. Test Automation Deployment
- 10.3. Market Analysis, Insights and Forecast - by End-user Verticals
- 10.3.1. Government
- 10.3.2. BFSI
- 10.3.3. Healthcare
- 10.3.4. Manufacturing
- 10.3.5. IT & Telecommunication
- 10.3.6. Media & Entertainment
- 10.3.7. Others End-Users
- 10.1. Market Analysis, Insights and Forecast - by Testing Type
- 11. North America Digital Quality Assurance Industry Analysis, Insights and Forecast, 2019-2031
- 11.1. Market Analysis, Insights and Forecast - By Country/Sub-region
- 11.1.1 United States
- 11.1.2 Canada
- 11.1.3 Mexico
- 12. Europe Digital Quality Assurance Industry Analysis, Insights and Forecast, 2019-2031
- 12.1. Market Analysis, Insights and Forecast - By Country/Sub-region
- 12.1.1 Germany
- 12.1.2 United Kingdom
- 12.1.3 France
- 12.1.4 Spain
- 12.1.5 Italy
- 12.1.6 Spain
- 12.1.7 Belgium
- 12.1.8 Netherland
- 12.1.9 Nordics
- 12.1.10 Rest of Europe
- 13. Asia Pacific Digital Quality Assurance Industry Analysis, Insights and Forecast, 2019-2031
- 13.1. Market Analysis, Insights and Forecast - By Country/Sub-region
- 13.1.1 China
- 13.1.2 Japan
- 13.1.3 India
- 13.1.4 South Korea
- 13.1.5 Southeast Asia
- 13.1.6 Australia
- 13.1.7 Indonesia
- 13.1.8 Phillipes
- 13.1.9 Singapore
- 13.1.10 Thailandc
- 13.1.11 Rest of Asia Pacific
- 14. South America Digital Quality Assurance Industry Analysis, Insights and Forecast, 2019-2031
- 14.1. Market Analysis, Insights and Forecast - By Country/Sub-region
- 14.1.1 Brazil
- 14.1.2 Argentina
- 14.1.3 Peru
- 14.1.4 Chile
- 14.1.5 Colombia
- 14.1.6 Ecuador
- 14.1.7 Venezuela
- 14.1.8 Rest of South America
- 15. North America Digital Quality Assurance Industry Analysis, Insights and Forecast, 2019-2031
- 15.1. Market Analysis, Insights and Forecast - By Country/Sub-region
- 15.1.1 United States
- 15.1.2 Canada
- 15.1.3 Mexico
- 16. MEA Digital Quality Assurance Industry Analysis, Insights and Forecast, 2019-2031
- 16.1. Market Analysis, Insights and Forecast - By Country/Sub-region
- 16.1.1 United Arab Emirates
- 16.1.2 Saudi Arabia
- 16.1.3 South Africa
- 16.1.4 Rest of Middle East and Africa
- 17. Competitive Analysis
- 17.1. Global Market Share Analysis 2024
- 17.2. Company Profiles
- 17.2.1 Cigniti Technologies
- 17.2.1.1. Overview
- 17.2.1.2. Products
- 17.2.1.3. SWOT Analysis
- 17.2.1.4. Recent Developments
- 17.2.1.5. Financials (Based on Availability)
- 17.2.2 Software Quality Systems AG
- 17.2.2.1. Overview
- 17.2.2.2. Products
- 17.2.2.3. SWOT Analysis
- 17.2.2.4. Recent Developments
- 17.2.2.5. Financials (Based on Availability)
- 17.2.3 Wipro Limited
- 17.2.3.1. Overview
- 17.2.3.2. Products
- 17.2.3.3. SWOT Analysis
- 17.2.3.4. Recent Developments
- 17.2.3.5. Financials (Based on Availability)
- 17.2.4 TATA Consultancy Services Limited
- 17.2.4.1. Overview
- 17.2.4.2. Products
- 17.2.4.3. SWOT Analysis
- 17.2.4.4. Recent Developments
- 17.2.4.5. Financials (Based on Availability)
- 17.2.5 Accenture plc
- 17.2.5.1. Overview
- 17.2.5.2. Products
- 17.2.5.3. SWOT Analysis
- 17.2.5.4. Recent Developments
- 17.2.5.5. Financials (Based on Availability)
- 17.2.6 Hexaware Technologies
- 17.2.6.1. Overview
- 17.2.6.2. Products
- 17.2.6.3. SWOT Analysis
- 17.2.6.4. Recent Developments
- 17.2.6.5. Financials (Based on Availability)
- 17.2.7 Capgemini SE
- 17.2.7.1. Overview
- 17.2.7.2. Products
- 17.2.7.3. SWOT Analysis
- 17.2.7.4. Recent Developments
- 17.2.7.5. Financials (Based on Availability)
- 17.2.8 Thinksys Inc
- 17.2.8.1. Overview
- 17.2.8.2. Products
- 17.2.8.3. SWOT Analysis
- 17.2.8.4. Recent Developments
- 17.2.8.5. Financials (Based on Availability)
- 17.2.9 DXC Technology Company
- 17.2.9.1. Overview
- 17.2.9.2. Products
- 17.2.9.3. SWOT Analysis
- 17.2.9.4. Recent Developments
- 17.2.9.5. Financials (Based on Availability)
- 17.2.10 Atos SE
- 17.2.10.1. Overview
- 17.2.10.2. Products
- 17.2.10.3. SWOT Analysis
- 17.2.10.4. Recent Developments
- 17.2.10.5. Financials (Based on Availability)
- 17.2.11 Sixth Gear Studios
- 17.2.11.1. Overview
- 17.2.11.2. Products
- 17.2.11.3. SWOT Analysis
- 17.2.11.4. Recent Developments
- 17.2.11.5. Financials (Based on Availability)
- 17.2.12 Micro Focus
- 17.2.12.1. Overview
- 17.2.12.2. Products
- 17.2.12.3. SWOT Analysis
- 17.2.12.4. Recent Developments
- 17.2.12.5. Financials (Based on Availability)
- 17.2.13 Maven Infosoft Pvt Ltd
- 17.2.13.1. Overview
- 17.2.13.2. Products
- 17.2.13.3. SWOT Analysis
- 17.2.13.4. Recent Developments
- 17.2.13.5. Financials (Based on Availability)
- 17.2.1 Cigniti Technologies
List of Figures
- Figure 1: Global Digital Quality Assurance Industry Revenue Breakdown (Million, %) by Region 2024 & 2032
- Figure 2: Global Digital Quality Assurance Industry Volume Breakdown (K Unit, %) by Region 2024 & 2032
- Figure 3: North America Digital Quality Assurance Industry Revenue (Million), by Country 2024 & 2032
- Figure 4: North America Digital Quality Assurance Industry Volume (K Unit), by Country 2024 & 2032
- Figure 5: North America Digital Quality Assurance Industry Revenue Share (%), by Country 2024 & 2032
- Figure 6: North America Digital Quality Assurance Industry Volume Share (%), by Country 2024 & 2032
- Figure 7: Europe Digital Quality Assurance Industry Revenue (Million), by Country 2024 & 2032
- Figure 8: Europe Digital Quality Assurance Industry Volume (K Unit), by Country 2024 & 2032
- Figure 9: Europe Digital Quality Assurance Industry Revenue Share (%), by Country 2024 & 2032
- Figure 10: Europe Digital Quality Assurance Industry Volume Share (%), by Country 2024 & 2032
- Figure 11: Asia Pacific Digital Quality Assurance Industry Revenue (Million), by Country 2024 & 2032
- Figure 12: Asia Pacific Digital Quality Assurance Industry Volume (K Unit), by Country 2024 & 2032
- Figure 13: Asia Pacific Digital Quality Assurance Industry Revenue Share (%), by Country 2024 & 2032
- Figure 14: Asia Pacific Digital Quality Assurance Industry Volume Share (%), by Country 2024 & 2032
- Figure 15: South America Digital Quality Assurance Industry Revenue (Million), by Country 2024 & 2032
- Figure 16: South America Digital Quality Assurance Industry Volume (K Unit), by Country 2024 & 2032
- Figure 17: South America Digital Quality Assurance Industry Revenue Share (%), by Country 2024 & 2032
- Figure 18: South America Digital Quality Assurance Industry Volume Share (%), by Country 2024 & 2032
- Figure 19: North America Digital Quality Assurance Industry Revenue (Million), by Country 2024 & 2032
- Figure 20: North America Digital Quality Assurance Industry Volume (K Unit), by Country 2024 & 2032
- Figure 21: North America Digital Quality Assurance Industry Revenue Share (%), by Country 2024 & 2032
- Figure 22: North America Digital Quality Assurance Industry Volume Share (%), by Country 2024 & 2032
- Figure 23: MEA Digital Quality Assurance Industry Revenue (Million), by Country 2024 & 2032
- Figure 24: MEA Digital Quality Assurance Industry Volume (K Unit), by Country 2024 & 2032
- Figure 25: MEA Digital Quality Assurance Industry Revenue Share (%), by Country 2024 & 2032
- Figure 26: MEA Digital Quality Assurance Industry Volume Share (%), by Country 2024 & 2032
- Figure 27: North America Digital Quality Assurance Industry Revenue (Million), by Testing Type 2024 & 2032
- Figure 28: North America Digital Quality Assurance Industry Volume (K Unit), by Testing Type 2024 & 2032
- Figure 29: North America Digital Quality Assurance Industry Revenue Share (%), by Testing Type 2024 & 2032
- Figure 30: North America Digital Quality Assurance Industry Volume Share (%), by Testing Type 2024 & 2032
- Figure 31: North America Digital Quality Assurance Industry Revenue (Million), by Testing Mode 2024 & 2032
- Figure 32: North America Digital Quality Assurance Industry Volume (K Unit), by Testing Mode 2024 & 2032
- Figure 33: North America Digital Quality Assurance Industry Revenue Share (%), by Testing Mode 2024 & 2032
- Figure 34: North America Digital Quality Assurance Industry Volume Share (%), by Testing Mode 2024 & 2032
- Figure 35: North America Digital Quality Assurance Industry Revenue (Million), by End-user Verticals 2024 & 2032
- Figure 36: North America Digital Quality Assurance Industry Volume (K Unit), by End-user Verticals 2024 & 2032
- Figure 37: North America Digital Quality Assurance Industry Revenue Share (%), by End-user Verticals 2024 & 2032
- Figure 38: North America Digital Quality Assurance Industry Volume Share (%), by End-user Verticals 2024 & 2032
- Figure 39: North America Digital Quality Assurance Industry Revenue (Million), by Country 2024 & 2032
- Figure 40: North America Digital Quality Assurance Industry Volume (K Unit), by Country 2024 & 2032
- Figure 41: North America Digital Quality Assurance Industry Revenue Share (%), by Country 2024 & 2032
- Figure 42: North America Digital Quality Assurance Industry Volume Share (%), by Country 2024 & 2032
- Figure 43: Europe Digital Quality Assurance Industry Revenue (Million), by Testing Type 2024 & 2032
- Figure 44: Europe Digital Quality Assurance Industry Volume (K Unit), by Testing Type 2024 & 2032
- Figure 45: Europe Digital Quality Assurance Industry Revenue Share (%), by Testing Type 2024 & 2032
- Figure 46: Europe Digital Quality Assurance Industry Volume Share (%), by Testing Type 2024 & 2032
- Figure 47: Europe Digital Quality Assurance Industry Revenue (Million), by Testing Mode 2024 & 2032
- Figure 48: Europe Digital Quality Assurance Industry Volume (K Unit), by Testing Mode 2024 & 2032
- Figure 49: Europe Digital Quality Assurance Industry Revenue Share (%), by Testing Mode 2024 & 2032
- Figure 50: Europe Digital Quality Assurance Industry Volume Share (%), by Testing Mode 2024 & 2032
- Figure 51: Europe Digital Quality Assurance Industry Revenue (Million), by End-user Verticals 2024 & 2032
- Figure 52: Europe Digital Quality Assurance Industry Volume (K Unit), by End-user Verticals 2024 & 2032
- Figure 53: Europe Digital Quality Assurance Industry Revenue Share (%), by End-user Verticals 2024 & 2032
- Figure 54: Europe Digital Quality Assurance Industry Volume Share (%), by End-user Verticals 2024 & 2032
- Figure 55: Europe Digital Quality Assurance Industry Revenue (Million), by Country 2024 & 2032
- Figure 56: Europe Digital Quality Assurance Industry Volume (K Unit), by Country 2024 & 2032
- Figure 57: Europe Digital Quality Assurance Industry Revenue Share (%), by Country 2024 & 2032
- Figure 58: Europe Digital Quality Assurance Industry Volume Share (%), by Country 2024 & 2032
- Figure 59: Asia Pacific Digital Quality Assurance Industry Revenue (Million), by Testing Type 2024 & 2032
- Figure 60: Asia Pacific Digital Quality Assurance Industry Volume (K Unit), by Testing Type 2024 & 2032
- Figure 61: Asia Pacific Digital Quality Assurance Industry Revenue Share (%), by Testing Type 2024 & 2032
- Figure 62: Asia Pacific Digital Quality Assurance Industry Volume Share (%), by Testing Type 2024 & 2032
- Figure 63: Asia Pacific Digital Quality Assurance Industry Revenue (Million), by Testing Mode 2024 & 2032
- Figure 64: Asia Pacific Digital Quality Assurance Industry Volume (K Unit), by Testing Mode 2024 & 2032
- Figure 65: Asia Pacific Digital Quality Assurance Industry Revenue Share (%), by Testing Mode 2024 & 2032
- Figure 66: Asia Pacific Digital Quality Assurance Industry Volume Share (%), by Testing Mode 2024 & 2032
- Figure 67: Asia Pacific Digital Quality Assurance Industry Revenue (Million), by End-user Verticals 2024 & 2032
- Figure 68: Asia Pacific Digital Quality Assurance Industry Volume (K Unit), by End-user Verticals 2024 & 2032
- Figure 69: Asia Pacific Digital Quality Assurance Industry Revenue Share (%), by End-user Verticals 2024 & 2032
- Figure 70: Asia Pacific Digital Quality Assurance Industry Volume Share (%), by End-user Verticals 2024 & 2032
- Figure 71: Asia Pacific Digital Quality Assurance Industry Revenue (Million), by Country 2024 & 2032
- Figure 72: Asia Pacific Digital Quality Assurance Industry Volume (K Unit), by Country 2024 & 2032
- Figure 73: Asia Pacific Digital Quality Assurance Industry Revenue Share (%), by Country 2024 & 2032
- Figure 74: Asia Pacific Digital Quality Assurance Industry Volume Share (%), by Country 2024 & 2032
- Figure 75: Latin America Digital Quality Assurance Industry Revenue (Million), by Testing Type 2024 & 2032
- Figure 76: Latin America Digital Quality Assurance Industry Volume (K Unit), by Testing Type 2024 & 2032
- Figure 77: Latin America Digital Quality Assurance Industry Revenue Share (%), by Testing Type 2024 & 2032
- Figure 78: Latin America Digital Quality Assurance Industry Volume Share (%), by Testing Type 2024 & 2032
- Figure 79: Latin America Digital Quality Assurance Industry Revenue (Million), by Testing Mode 2024 & 2032
- Figure 80: Latin America Digital Quality Assurance Industry Volume (K Unit), by Testing Mode 2024 & 2032
- Figure 81: Latin America Digital Quality Assurance Industry Revenue Share (%), by Testing Mode 2024 & 2032
- Figure 82: Latin America Digital Quality Assurance Industry Volume Share (%), by Testing Mode 2024 & 2032
- Figure 83: Latin America Digital Quality Assurance Industry Revenue (Million), by End-user Verticals 2024 & 2032
- Figure 84: Latin America Digital Quality Assurance Industry Volume (K Unit), by End-user Verticals 2024 & 2032
- Figure 85: Latin America Digital Quality Assurance Industry Revenue Share (%), by End-user Verticals 2024 & 2032
- Figure 86: Latin America Digital Quality Assurance Industry Volume Share (%), by End-user Verticals 2024 & 2032
- Figure 87: Latin America Digital Quality Assurance Industry Revenue (Million), by Country 2024 & 2032
- Figure 88: Latin America Digital Quality Assurance Industry Volume (K Unit), by Country 2024 & 2032
- Figure 89: Latin America Digital Quality Assurance Industry Revenue Share (%), by Country 2024 & 2032
- Figure 90: Latin America Digital Quality Assurance Industry Volume Share (%), by Country 2024 & 2032
- Figure 91: Middle East Digital Quality Assurance Industry Revenue (Million), by Testing Type 2024 & 2032
- Figure 92: Middle East Digital Quality Assurance Industry Volume (K Unit), by Testing Type 2024 & 2032
- Figure 93: Middle East Digital Quality Assurance Industry Revenue Share (%), by Testing Type 2024 & 2032
- Figure 94: Middle East Digital Quality Assurance Industry Volume Share (%), by Testing Type 2024 & 2032
- Figure 95: Middle East Digital Quality Assurance Industry Revenue (Million), by Testing Mode 2024 & 2032
- Figure 96: Middle East Digital Quality Assurance Industry Volume (K Unit), by Testing Mode 2024 & 2032
- Figure 97: Middle East Digital Quality Assurance Industry Revenue Share (%), by Testing Mode 2024 & 2032
- Figure 98: Middle East Digital Quality Assurance Industry Volume Share (%), by Testing Mode 2024 & 2032
- Figure 99: Middle East Digital Quality Assurance Industry Revenue (Million), by End-user Verticals 2024 & 2032
- Figure 100: Middle East Digital Quality Assurance Industry Volume (K Unit), by End-user Verticals 2024 & 2032
- Figure 101: Middle East Digital Quality Assurance Industry Revenue Share (%), by End-user Verticals 2024 & 2032
- Figure 102: Middle East Digital Quality Assurance Industry Volume Share (%), by End-user Verticals 2024 & 2032
- Figure 103: Middle East Digital Quality Assurance Industry Revenue (Million), by Country 2024 & 2032
- Figure 104: Middle East Digital Quality Assurance Industry Volume (K Unit), by Country 2024 & 2032
- Figure 105: Middle East Digital Quality Assurance Industry Revenue Share (%), by Country 2024 & 2032
- Figure 106: Middle East Digital Quality Assurance Industry Volume Share (%), by Country 2024 & 2032
List of Tables
- Table 1: Global Digital Quality Assurance Industry Revenue Million Forecast, by Region 2019 & 2032
- Table 2: Global Digital Quality Assurance Industry Volume K Unit Forecast, by Region 2019 & 2032
- Table 3: Global Digital Quality Assurance Industry Revenue Million Forecast, by Testing Type 2019 & 2032
- Table 4: Global Digital Quality Assurance Industry Volume K Unit Forecast, by Testing Type 2019 & 2032
- Table 5: Global Digital Quality Assurance Industry Revenue Million Forecast, by Testing Mode 2019 & 2032
- Table 6: Global Digital Quality Assurance Industry Volume K Unit Forecast, by Testing Mode 2019 & 2032
- Table 7: Global Digital Quality Assurance Industry Revenue Million Forecast, by End-user Verticals 2019 & 2032
- Table 8: Global Digital Quality Assurance Industry Volume K Unit Forecast, by End-user Verticals 2019 & 2032
- Table 9: Global Digital Quality Assurance Industry Revenue Million Forecast, by Region 2019 & 2032
- Table 10: Global Digital Quality Assurance Industry Volume K Unit Forecast, by Region 2019 & 2032
- Table 11: Global Digital Quality Assurance Industry Revenue Million Forecast, by Country 2019 & 2032
- Table 12: Global Digital Quality Assurance Industry Volume K Unit Forecast, by Country 2019 & 2032
- Table 13: United States Digital Quality Assurance Industry Revenue (Million) Forecast, by Application 2019 & 2032
- Table 14: United States Digital Quality Assurance Industry Volume (K Unit) Forecast, by Application 2019 & 2032
- Table 15: Canada Digital Quality Assurance Industry Revenue (Million) Forecast, by Application 2019 & 2032
- Table 16: Canada Digital Quality Assurance Industry Volume (K Unit) Forecast, by Application 2019 & 2032
- Table 17: Mexico Digital Quality Assurance Industry Revenue (Million) Forecast, by Application 2019 & 2032
- Table 18: Mexico Digital Quality Assurance Industry Volume (K Unit) Forecast, by Application 2019 & 2032
- Table 19: Global Digital Quality Assurance Industry Revenue Million Forecast, by Country 2019 & 2032
- Table 20: Global Digital Quality Assurance Industry Volume K Unit Forecast, by Country 2019 & 2032
- Table 21: Germany Digital Quality Assurance Industry Revenue (Million) Forecast, by Application 2019 & 2032
- Table 22: Germany Digital Quality Assurance Industry Volume (K Unit) Forecast, by Application 2019 & 2032
- Table 23: United Kingdom Digital Quality Assurance Industry Revenue (Million) Forecast, by Application 2019 & 2032
- Table 24: United Kingdom Digital Quality Assurance Industry Volume (K Unit) Forecast, by Application 2019 & 2032
- Table 25: France Digital Quality Assurance Industry Revenue (Million) Forecast, by Application 2019 & 2032
- Table 26: France Digital Quality Assurance Industry Volume (K Unit) Forecast, by Application 2019 & 2032
- Table 27: Spain Digital Quality Assurance Industry Revenue (Million) Forecast, by Application 2019 & 2032
- Table 28: Spain Digital Quality Assurance Industry Volume (K Unit) Forecast, by Application 2019 & 2032
- Table 29: Italy Digital Quality Assurance Industry Revenue (Million) Forecast, by Application 2019 & 2032
- Table 30: Italy Digital Quality Assurance Industry Volume (K Unit) Forecast, by Application 2019 & 2032
- Table 31: Spain Digital Quality Assurance Industry Revenue (Million) Forecast, by Application 2019 & 2032
- Table 32: Spain Digital Quality Assurance Industry Volume (K Unit) Forecast, by Application 2019 & 2032
- Table 33: Belgium Digital Quality Assurance Industry Revenue (Million) Forecast, by Application 2019 & 2032
- Table 34: Belgium Digital Quality Assurance Industry Volume (K Unit) Forecast, by Application 2019 & 2032
- Table 35: Netherland Digital Quality Assurance Industry Revenue (Million) Forecast, by Application 2019 & 2032
- Table 36: Netherland Digital Quality Assurance Industry Volume (K Unit) Forecast, by Application 2019 & 2032
- Table 37: Nordics Digital Quality Assurance Industry Revenue (Million) Forecast, by Application 2019 & 2032
- Table 38: Nordics Digital Quality Assurance Industry Volume (K Unit) Forecast, by Application 2019 & 2032
- Table 39: Rest of Europe Digital Quality Assurance Industry Revenue (Million) Forecast, by Application 2019 & 2032
- Table 40: Rest of Europe Digital Quality Assurance Industry Volume (K Unit) Forecast, by Application 2019 & 2032
- Table 41: Global Digital Quality Assurance Industry Revenue Million Forecast, by Country 2019 & 2032
- Table 42: Global Digital Quality Assurance Industry Volume K Unit Forecast, by Country 2019 & 2032
- Table 43: China Digital Quality Assurance Industry Revenue (Million) Forecast, by Application 2019 & 2032
- Table 44: China Digital Quality Assurance Industry Volume (K Unit) Forecast, by Application 2019 & 2032
- Table 45: Japan Digital Quality Assurance Industry Revenue (Million) Forecast, by Application 2019 & 2032
- Table 46: Japan Digital Quality Assurance Industry Volume (K Unit) Forecast, by Application 2019 & 2032
- Table 47: India Digital Quality Assurance Industry Revenue (Million) Forecast, by Application 2019 & 2032
- Table 48: India Digital Quality Assurance Industry Volume (K Unit) Forecast, by Application 2019 & 2032
- Table 49: South Korea Digital Quality Assurance Industry Revenue (Million) Forecast, by Application 2019 & 2032
- Table 50: South Korea Digital Quality Assurance Industry Volume (K Unit) Forecast, by Application 2019 & 2032
- Table 51: Southeast Asia Digital Quality Assurance Industry Revenue (Million) Forecast, by Application 2019 & 2032
- Table 52: Southeast Asia Digital Quality Assurance Industry Volume (K Unit) Forecast, by Application 2019 & 2032
- Table 53: Australia Digital Quality Assurance Industry Revenue (Million) Forecast, by Application 2019 & 2032
- Table 54: Australia Digital Quality Assurance Industry Volume (K Unit) Forecast, by Application 2019 & 2032
- Table 55: Indonesia Digital Quality Assurance Industry Revenue (Million) Forecast, by Application 2019 & 2032
- Table 56: Indonesia Digital Quality Assurance Industry Volume (K Unit) Forecast, by Application 2019 & 2032
- Table 57: Phillipes Digital Quality Assurance Industry Revenue (Million) Forecast, by Application 2019 & 2032
- Table 58: Phillipes Digital Quality Assurance Industry Volume (K Unit) Forecast, by Application 2019 & 2032
- Table 59: Singapore Digital Quality Assurance Industry Revenue (Million) Forecast, by Application 2019 & 2032
- Table 60: Singapore Digital Quality Assurance Industry Volume (K Unit) Forecast, by Application 2019 & 2032
- Table 61: Thailandc Digital Quality Assurance Industry Revenue (Million) Forecast, by Application 2019 & 2032
- Table 62: Thailandc Digital Quality Assurance Industry Volume (K Unit) Forecast, by Application 2019 & 2032
- Table 63: Rest of Asia Pacific Digital Quality Assurance Industry Revenue (Million) Forecast, by Application 2019 & 2032
- Table 64: Rest of Asia Pacific Digital Quality Assurance Industry Volume (K Unit) Forecast, by Application 2019 & 2032
- Table 65: Global Digital Quality Assurance Industry Revenue Million Forecast, by Country 2019 & 2032
- Table 66: Global Digital Quality Assurance Industry Volume K Unit Forecast, by Country 2019 & 2032
- Table 67: Brazil Digital Quality Assurance Industry Revenue (Million) Forecast, by Application 2019 & 2032
- Table 68: Brazil Digital Quality Assurance Industry Volume (K Unit) Forecast, by Application 2019 & 2032
- Table 69: Argentina Digital Quality Assurance Industry Revenue (Million) Forecast, by Application 2019 & 2032
- Table 70: Argentina Digital Quality Assurance Industry Volume (K Unit) Forecast, by Application 2019 & 2032
- Table 71: Peru Digital Quality Assurance Industry Revenue (Million) Forecast, by Application 2019 & 2032
- Table 72: Peru Digital Quality Assurance Industry Volume (K Unit) Forecast, by Application 2019 & 2032
- Table 73: Chile Digital Quality Assurance Industry Revenue (Million) Forecast, by Application 2019 & 2032
- Table 74: Chile Digital Quality Assurance Industry Volume (K Unit) Forecast, by Application 2019 & 2032
- Table 75: Colombia Digital Quality Assurance Industry Revenue (Million) Forecast, by Application 2019 & 2032
- Table 76: Colombia Digital Quality Assurance Industry Volume (K Unit) Forecast, by Application 2019 & 2032
- Table 77: Ecuador Digital Quality Assurance Industry Revenue (Million) Forecast, by Application 2019 & 2032
- Table 78: Ecuador Digital Quality Assurance Industry Volume (K Unit) Forecast, by Application 2019 & 2032
- Table 79: Venezuela Digital Quality Assurance Industry Revenue (Million) Forecast, by Application 2019 & 2032
- Table 80: Venezuela Digital Quality Assurance Industry Volume (K Unit) Forecast, by Application 2019 & 2032
- Table 81: Rest of South America Digital Quality Assurance Industry Revenue (Million) Forecast, by Application 2019 & 2032
- Table 82: Rest of South America Digital Quality Assurance Industry Volume (K Unit) Forecast, by Application 2019 & 2032
- Table 83: Global Digital Quality Assurance Industry Revenue Million Forecast, by Country 2019 & 2032
- Table 84: Global Digital Quality Assurance Industry Volume K Unit Forecast, by Country 2019 & 2032
- Table 85: United States Digital Quality Assurance Industry Revenue (Million) Forecast, by Application 2019 & 2032
- Table 86: United States Digital Quality Assurance Industry Volume (K Unit) Forecast, by Application 2019 & 2032
- Table 87: Canada Digital Quality Assurance Industry Revenue (Million) Forecast, by Application 2019 & 2032
- Table 88: Canada Digital Quality Assurance Industry Volume (K Unit) Forecast, by Application 2019 & 2032
- Table 89: Mexico Digital Quality Assurance Industry Revenue (Million) Forecast, by Application 2019 & 2032
- Table 90: Mexico Digital Quality Assurance Industry Volume (K Unit) Forecast, by Application 2019 & 2032
- Table 91: Global Digital Quality Assurance Industry Revenue Million Forecast, by Country 2019 & 2032
- Table 92: Global Digital Quality Assurance Industry Volume K Unit Forecast, by Country 2019 & 2032
- Table 93: United Arab Emirates Digital Quality Assurance Industry Revenue (Million) Forecast, by Application 2019 & 2032
- Table 94: United Arab Emirates Digital Quality Assurance Industry Volume (K Unit) Forecast, by Application 2019 & 2032
- Table 95: Saudi Arabia Digital Quality Assurance Industry Revenue (Million) Forecast, by Application 2019 & 2032
- Table 96: Saudi Arabia Digital Quality Assurance Industry Volume (K Unit) Forecast, by Application 2019 & 2032
- Table 97: South Africa Digital Quality Assurance Industry Revenue (Million) Forecast, by Application 2019 & 2032
- Table 98: South Africa Digital Quality Assurance Industry Volume (K Unit) Forecast, by Application 2019 & 2032
- Table 99: Rest of Middle East and Africa Digital Quality Assurance Industry Revenue (Million) Forecast, by Application 2019 & 2032
- Table 100: Rest of Middle East and Africa Digital Quality Assurance Industry Volume (K Unit) Forecast, by Application 2019 & 2032
- Table 101: Global Digital Quality Assurance Industry Revenue Million Forecast, by Testing Type 2019 & 2032
- Table 102: Global Digital Quality Assurance Industry Volume K Unit Forecast, by Testing Type 2019 & 2032
- Table 103: Global Digital Quality Assurance Industry Revenue Million Forecast, by Testing Mode 2019 & 2032
- Table 104: Global Digital Quality Assurance Industry Volume K Unit Forecast, by Testing Mode 2019 & 2032
- Table 105: Global Digital Quality Assurance Industry Revenue Million Forecast, by End-user Verticals 2019 & 2032
- Table 106: Global Digital Quality Assurance Industry Volume K Unit Forecast, by End-user Verticals 2019 & 2032
- Table 107: Global Digital Quality Assurance Industry Revenue Million Forecast, by Country 2019 & 2032
- Table 108: Global Digital Quality Assurance Industry Volume K Unit Forecast, by Country 2019 & 2032
- Table 109: Global Digital Quality Assurance Industry Revenue Million Forecast, by Testing Type 2019 & 2032
- Table 110: Global Digital Quality Assurance Industry Volume K Unit Forecast, by Testing Type 2019 & 2032
- Table 111: Global Digital Quality Assurance Industry Revenue Million Forecast, by Testing Mode 2019 & 2032
- Table 112: Global Digital Quality Assurance Industry Volume K Unit Forecast, by Testing Mode 2019 & 2032
- Table 113: Global Digital Quality Assurance Industry Revenue Million Forecast, by End-user Verticals 2019 & 2032
- Table 114: Global Digital Quality Assurance Industry Volume K Unit Forecast, by End-user Verticals 2019 & 2032
- Table 115: Global Digital Quality Assurance Industry Revenue Million Forecast, by Country 2019 & 2032
- Table 116: Global Digital Quality Assurance Industry Volume K Unit Forecast, by Country 2019 & 2032
- Table 117: Global Digital Quality Assurance Industry Revenue Million Forecast, by Testing Type 2019 & 2032
- Table 118: Global Digital Quality Assurance Industry Volume K Unit Forecast, by Testing Type 2019 & 2032
- Table 119: Global Digital Quality Assurance Industry Revenue Million Forecast, by Testing Mode 2019 & 2032
- Table 120: Global Digital Quality Assurance Industry Volume K Unit Forecast, by Testing Mode 2019 & 2032
- Table 121: Global Digital Quality Assurance Industry Revenue Million Forecast, by End-user Verticals 2019 & 2032
- Table 122: Global Digital Quality Assurance Industry Volume K Unit Forecast, by End-user Verticals 2019 & 2032
- Table 123: Global Digital Quality Assurance Industry Revenue Million Forecast, by Country 2019 & 2032
- Table 124: Global Digital Quality Assurance Industry Volume K Unit Forecast, by Country 2019 & 2032
- Table 125: Global Digital Quality Assurance Industry Revenue Million Forecast, by Testing Type 2019 & 2032
- Table 126: Global Digital Quality Assurance Industry Volume K Unit Forecast, by Testing Type 2019 & 2032
- Table 127: Global Digital Quality Assurance Industry Revenue Million Forecast, by Testing Mode 2019 & 2032
- Table 128: Global Digital Quality Assurance Industry Volume K Unit Forecast, by Testing Mode 2019 & 2032
- Table 129: Global Digital Quality Assurance Industry Revenue Million Forecast, by End-user Verticals 2019 & 2032
- Table 130: Global Digital Quality Assurance Industry Volume K Unit Forecast, by End-user Verticals 2019 & 2032
- Table 131: Global Digital Quality Assurance Industry Revenue Million Forecast, by Country 2019 & 2032
- Table 132: Global Digital Quality Assurance Industry Volume K Unit Forecast, by Country 2019 & 2032
- Table 133: Global Digital Quality Assurance Industry Revenue Million Forecast, by Testing Type 2019 & 2032
- Table 134: Global Digital Quality Assurance Industry Volume K Unit Forecast, by Testing Type 2019 & 2032
- Table 135: Global Digital Quality Assurance Industry Revenue Million Forecast, by Testing Mode 2019 & 2032
- Table 136: Global Digital Quality Assurance Industry Volume K Unit Forecast, by Testing Mode 2019 & 2032
- Table 137: Global Digital Quality Assurance Industry Revenue Million Forecast, by End-user Verticals 2019 & 2032
- Table 138: Global Digital Quality Assurance Industry Volume K Unit Forecast, by End-user Verticals 2019 & 2032
- Table 139: Global Digital Quality Assurance Industry Revenue Million Forecast, by Country 2019 & 2032
- Table 140: Global Digital Quality Assurance Industry Volume K Unit Forecast, by Country 2019 & 2032
Frequently Asked Questions
1. What is the projected Compound Annual Growth Rate (CAGR) of the Digital Quality Assurance Industry?
The projected CAGR is approximately 12.90%.
2. Which companies are prominent players in the Digital Quality Assurance Industry?
Key companies in the market include Cigniti Technologies, Software Quality Systems AG, Wipro Limited, TATA Consultancy Services Limited, Accenture plc, Hexaware Technologies, Capgemini SE, Thinksys Inc, DXC Technology Company, Atos SE, Sixth Gear Studios, Micro Focus, Maven Infosoft Pvt Ltd.
3. What are the main segments of the Digital Quality Assurance Industry?
The market segments include Testing Type, Testing Mode, End-user Verticals.
4. Can you provide details about the market size?
The market size is estimated to be USD XX Million as of 2022.
5. What are some drivers contributing to market growth?
Growing Need of API Monitoring in the Digital Economy; The Increasing Use of Test Automation Leads to Lower the Operational Costs and Enhance the QA.
6. What are the notable trends driving market growth?
Healthcare sector is expected to register significant growth.
7. Are there any restraints impacting market growth?
High Initial Setup Cost; Large Installation Space.
8. Can you provide examples of recent developments in the market?
September 2022 - A new born intensive care unit (NICU) and special newborn care unit (SNCU) facility was recently opened at the Mother and Child Health Center (MCHC) in Hyderabad's Nalgonda district by Cigniti Technologies, an AI and IP-led digital assurance and engineering services company. The digital company claimed that it worked with the non-profit Nirmaan to address the shortage of NICU/SNCU beds, medical equipment such radiant warmers, phototherapy machines, pulse oximeters, syringe and infusion pumps, multipara monitors, HFNC devices, and ward air conditioners.
9. What pricing options are available for accessing the report?
Pricing options include single-user, multi-user, and enterprise licenses priced at USD 4750, USD 5250, and USD 8750 respectively.
10. Is the market size provided in terms of value or volume?
The market size is provided in terms of value, measured in Million and volume, measured in K Unit.
11. Are there any specific market keywords associated with the report?
Yes, the market keyword associated with the report is "Digital Quality Assurance Industry," which aids in identifying and referencing the specific market segment covered.
12. How do I determine which pricing option suits my needs best?
The pricing options vary based on user requirements and access needs. Individual users may opt for single-user licenses, while businesses requiring broader access may choose multi-user or enterprise licenses for cost-effective access to the report.
13. Are there any additional resources or data provided in the Digital Quality Assurance Industry report?
While the report offers comprehensive insights, it's advisable to review the specific contents or supplementary materials provided to ascertain if additional resources or data are available.
14. How can I stay updated on further developments or reports in the Digital Quality Assurance Industry?
To stay informed about further developments, trends, and reports in the Digital Quality Assurance Industry, consider subscribing to industry newsletters, following relevant companies and organizations, or regularly checking reputable industry news sources and publications.
Methodology
Step 1 - Identification of Relevant Samples Size from Population Database


Step 2 - Approaches for Defining Global Market Size (Value, Volume* & Price*)

Note*: In applicable scenarios
Step 3 - Data Sources
Primary Research
- Web Analytics
- Survey Reports
- Research Institute
- Latest Research Reports
- Opinion Leaders
Secondary Research
- Annual Reports
- White Paper
- Latest Press Release
- Industry Association
- Paid Database
- Investor Presentations

Step 4 - Data Triangulation
Involves using different sources of information in order to increase the validity of a study
These sources are likely to be stakeholders in a program - participants, other researchers, program staff, other community members, and so on.
Then we put all data in single framework & apply various statistical tools to find out the dynamic on the market.
During the analysis stage, feedback from the stakeholder groups would be compared to determine areas of agreement as well as areas of divergence


