
Key Insights
The Drilling Waste Management Services market is experiencing robust growth, driven by increasing oil and gas exploration and production activities globally, particularly in regions like North America, the Middle East, and Asia Pacific. Stringent environmental regulations concerning waste disposal and a rising focus on sustainable practices are further propelling market expansion. The market is segmented by service type (Solid Control, Containment & Handling, and Others) and location of deployment (Onshore and Offshore). Onshore operations currently dominate the market share due to higher drilling activity and easier accessibility, but offshore segments are projected to witness significant growth due to increasing deep-water drilling projects. Technological advancements, such as improved waste treatment technologies and automation, are enhancing efficiency and reducing environmental impact, contributing positively to market expansion. The competitive landscape is marked by a mix of large multinational corporations and specialized service providers. These companies are engaged in strategic partnerships, acquisitions, and technological innovations to gain a competitive edge and meet the evolving demands of the industry.
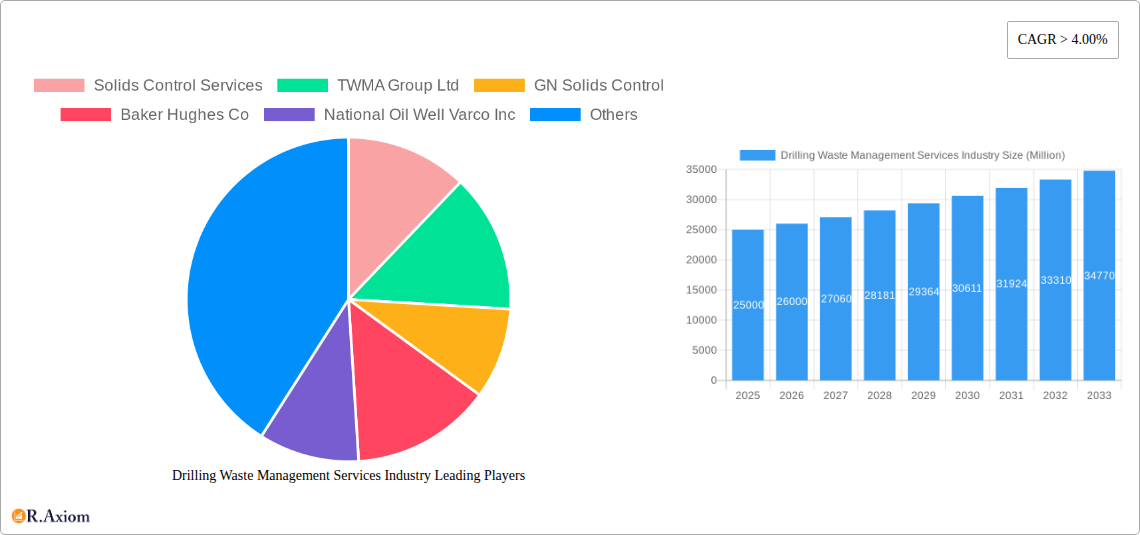
Looking ahead, the market is poised for continued expansion, with a projected Compound Annual Growth Rate (CAGR) exceeding 4%. This growth will be fueled by the continued exploration and exploitation of unconventional oil and gas resources (like shale gas), growing demand for efficient and environmentally compliant waste management solutions, and increasing investments in advanced technologies within the oil and gas sector. However, factors like fluctuating oil and gas prices and economic uncertainties in certain regions pose potential restraints to market growth. The ongoing shift towards renewable energy sources might also indirectly impact the long-term trajectory, although the immediate future remains promising for the Drilling Waste Management Services market. The industry is expected to consolidate further, with larger players acquiring smaller ones to gain scale and enhance their service offerings.
Drilling Waste Management Services Industry: A Comprehensive Market Report (2019-2033)
This detailed report provides a comprehensive analysis of the global Drilling Waste Management Services industry, offering invaluable insights for stakeholders, investors, and industry professionals. The study covers the period from 2019 to 2033, with a focus on the forecast period of 2025-2033 and a base year of 2025. The market is valued at XX Million in 2025 and is projected to reach XX Million by 2033, exhibiting a CAGR of XX%.
Drilling Waste Management Services Industry Market Concentration & Innovation
The Drilling Waste Management Services market is moderately concentrated, with several major players commanding significant market share. Solids Control Services, TWMA Group Ltd, GN Solids Control, Baker Hughes Co, National Oil Well Varco Inc, Schlumberger Ltd, Eco-Logic Environmental Engineering Inc, Halliburton Company, Weatherford International PLC, and SAR AS are some of the key players, although the market includes many smaller, specialized firms. Market share data for 2025 estimates the top 5 players hold approximately 60% of the market, with the remaining share distributed among numerous smaller participants. Innovation is driven by stringent environmental regulations, the increasing need for efficient and sustainable waste management solutions, and technological advancements in solid control systems and waste treatment technologies.
- Market Concentration: Top 5 players hold approximately 60% of the market share in 2025.
- Innovation Drivers: Stringent environmental regulations, demand for sustainable solutions, technological advancements.
- Regulatory Frameworks: Vary significantly across jurisdictions, impacting operational costs and strategies.
- Product Substitutes: Limited viable substitutes currently exist for specialized waste management services, though alternative technologies are under development.
- End-User Trends: Growing focus on minimizing environmental impact and improving operational efficiency drives demand for advanced waste management solutions.
- M&A Activities: The industry has witnessed several M&A activities in recent years, with deal values exceeding XX Million in the period 2019-2024. These activities often focus on expanding geographical reach, acquiring specialized technologies, or strengthening market position.
Drilling Waste Management Services Industry Industry Trends & Insights
The global Drilling Waste Management Services market is experiencing robust growth, fueled by several key trends. The increasing global demand for energy, particularly in developing economies, is a significant driver. The exploration and production of oil and gas, particularly in offshore environments, necessitates specialized waste management services, thereby enhancing market expansion. Technological advancements, including automation and the development of more efficient and environmentally friendly waste processing technologies, are creating new opportunities. The rising awareness of environmental sustainability and stricter regulatory frameworks are also pushing industry players to adopt eco-friendly practices, contributing to market growth. Competitive dynamics are shaped by price competition, technological innovation, and the ongoing consolidation through mergers and acquisitions. Market penetration of advanced waste management solutions is increasing gradually, with penetration rates expected to reach approximately XX% by 2033.
Dominant Markets & Segments in Drilling Waste Management Services Industry
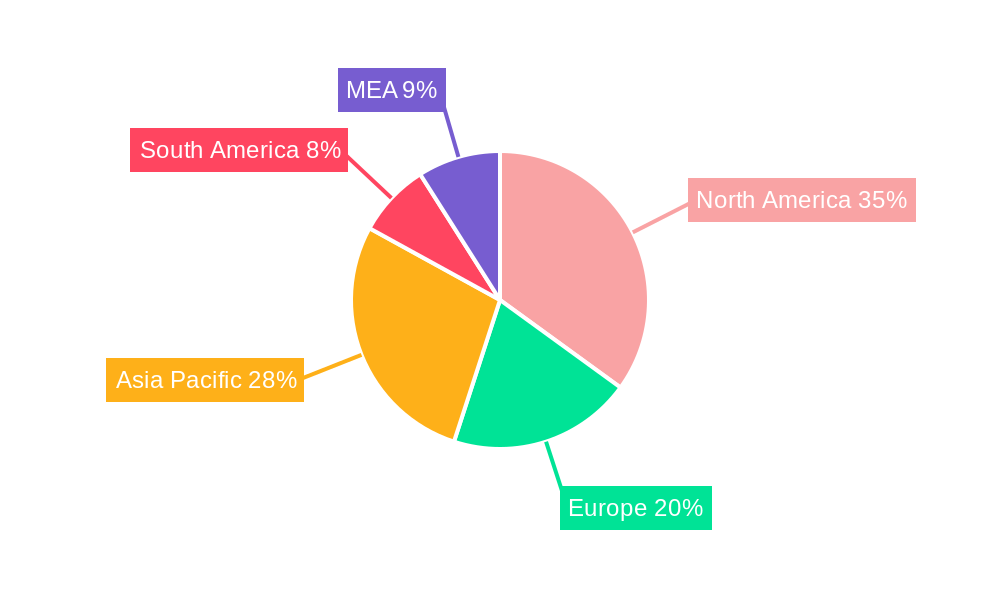
The onshore segment currently dominates the Drilling Waste Management Services market, primarily due to the higher concentration of drilling activities compared to offshore operations. However, the offshore segment is expected to witness significant growth due to increasing offshore exploration and production activities. Among services, Solid Control accounts for the largest market share, followed by Containment & Handling. Geographically, North America and the Middle East represent the largest markets due to extensive oil and gas exploration and production activities.
- Onshore Dominance: Higher volume of drilling activities, relatively lower operational costs.
- Offshore Growth: Increasing offshore exploration and production, necessitating specialized services.
- Solid Control Segment Leadership: Essential for efficient drilling operations, driving high demand.
- Containment & Handling Segment Significance: Crucial for environmental compliance and safety.
- Regional Dominance: North America and the Middle East lead due to high oil & gas activity.
- Key Drivers (North America): Robust oil & gas industry, stringent environmental regulations.
- Key Drivers (Middle East): Significant oil & gas reserves, large-scale projects.
Drilling Waste Management Services Industry Product Developments
Recent product innovations focus on improving efficiency, reducing environmental impact, and enhancing safety. This includes the development of advanced solid control systems, improved waste treatment technologies, and the integration of automation and data analytics for optimized waste management processes. These innovations enhance the competitiveness of service providers by offering superior performance, cost-effectiveness, and reduced environmental footprint.
Report Scope & Segmentation Analysis
This report segments the Drilling Waste Management Services market by service type (Solid Control, Containment & Handling, Others) and location of deployment (Onshore, Offshore). Each segment is analyzed in detail, providing market size, growth projections, and competitive dynamics. The Solid Control segment is projected to experience the highest growth rate due to its crucial role in efficient drilling operations. Similarly, the Onshore segment is projected to continue its dominance due to the higher volume of onshore drilling activities.
Key Drivers of Drilling Waste Management Services Industry Growth
Several factors drive the growth of the Drilling Waste Management Services industry. The increasing demand for energy globally, particularly in emerging economies, is a major factor. Stricter environmental regulations and a rising focus on sustainability are pushing for innovative and environmentally friendly waste management solutions. Technological advancements, including the development of advanced waste treatment technologies and automation, are also improving efficiency and reducing operational costs.
Challenges in the Drilling Waste Management Services Industry Sector
The Drilling Waste Management Services industry faces several challenges. Stringent and evolving environmental regulations increase compliance costs and operational complexity. Fluctuations in oil and gas prices can impact demand and profitability. Furthermore, intense competition and the need for continuous innovation to maintain a competitive edge pose significant challenges. Supply chain disruptions can also significantly affect the availability of necessary equipment and materials.
Emerging Opportunities in Drilling Waste Management Services Industry
Emerging opportunities lie in the development and adoption of innovative technologies, such as AI-powered monitoring and control systems, and advanced waste treatment technologies. Expansion into new and emerging markets with growing oil and gas exploration activities presents lucrative opportunities. Further, the growing focus on circular economy principles and the potential for waste recycling and resource recovery presents significant opportunities for innovation and growth.
Leading Players in the Drilling Waste Management Services Industry Market
- Solids Control Services
- TWMA Group Ltd
- GN Solids Control
- Baker Hughes Co
- National Oil Well Varco Inc
- Schlumberger Ltd
- Eco-Logic Environmental Engineering Inc
- Halliburton Company
- Weatherford International PLC
- SAR AS
Key Developments in Drilling Waste Management Services Industry Industry
- 2022 Q4: Schlumberger Ltd announced a new partnership to develop advanced waste treatment technologies.
- 2023 Q1: Baker Hughes Co launched a new automated solid control system.
- 2024 Q2: GN Solids Control acquired a smaller competitor, expanding its market share. (Further key developments can be added here)
Strategic Outlook for Drilling Waste Management Services Industry Market
The future of the Drilling Waste Management Services market looks promising, driven by sustained growth in the oil and gas industry, stringent environmental regulations, and ongoing technological advancements. The focus on sustainability and efficiency will continue to shape market dynamics, presenting opportunities for companies that can offer innovative and environmentally friendly solutions. The industry is likely to witness further consolidation through mergers and acquisitions, leading to a more concentrated market structure.
Drilling Waste Management Services Industry Segmentation
-
1. Service
- 1.1. Solid Control
- 1.2. Containment & Handling
- 1.3. Others
-
2. Location of Deployment
- 2.1. Onshore
- 2.2. Offshore
Drilling Waste Management Services Industry Segmentation By Geography
- 1. North America
- 2. Europe
- 3. Asia Pacific
- 4. South America
- 5. Middle East and Africa
Drilling Waste Management Services Industry REPORT HIGHLIGHTS
| Aspects | Details |
|---|---|
| Study Period | 2019-2033 |
| Base Year | 2024 |
| Estimated Year | 2025 |
| Forecast Period | 2025-2033 |
| Historical Period | 2019-2024 |
| Growth Rate | CAGR of > 4.00% from 2019-2033 |
| Segmentation |
|
Table of Contents
- 1. Introduction
- 1.1. Research Scope
- 1.2. Market Segmentation
- 1.3. Research Methodology
- 1.4. Definitions and Assumptions
- 2. Executive Summary
- 2.1. Introduction
- 3. Market Dynamics
- 3.1. Introduction
- 3.2. Market Drivers
- 3.2.1. 4.; Presence of Strict Government Regulations to Control Air Pollution
- 3.3. Market Restrains
- 3.3.1. 4.; Increasing Adoption of Renewable Energy
- 3.4. Market Trends
- 3.4.1. Offshore Oil & Gas to Dominate the Market
- 4. Market Factor Analysis
- 4.1. Porters Five Forces
- 4.2. Supply/Value Chain
- 4.3. PESTEL analysis
- 4.4. Market Entropy
- 4.5. Patent/Trademark Analysis
- 5. Global Drilling Waste Management Services Industry Analysis, Insights and Forecast, 2019-2031
- 5.1. Market Analysis, Insights and Forecast - by Service
- 5.1.1. Solid Control
- 5.1.2. Containment & Handling
- 5.1.3. Others
- 5.2. Market Analysis, Insights and Forecast - by Location of Deployment
- 5.2.1. Onshore
- 5.2.2. Offshore
- 5.3. Market Analysis, Insights and Forecast - by Region
- 5.3.1. North America
- 5.3.2. Europe
- 5.3.3. Asia Pacific
- 5.3.4. South America
- 5.3.5. Middle East and Africa
- 5.1. Market Analysis, Insights and Forecast - by Service
- 6. North America Drilling Waste Management Services Industry Analysis, Insights and Forecast, 2019-2031
- 6.1. Market Analysis, Insights and Forecast - by Service
- 6.1.1. Solid Control
- 6.1.2. Containment & Handling
- 6.1.3. Others
- 6.2. Market Analysis, Insights and Forecast - by Location of Deployment
- 6.2.1. Onshore
- 6.2.2. Offshore
- 6.1. Market Analysis, Insights and Forecast - by Service
- 7. Europe Drilling Waste Management Services Industry Analysis, Insights and Forecast, 2019-2031
- 7.1. Market Analysis, Insights and Forecast - by Service
- 7.1.1. Solid Control
- 7.1.2. Containment & Handling
- 7.1.3. Others
- 7.2. Market Analysis, Insights and Forecast - by Location of Deployment
- 7.2.1. Onshore
- 7.2.2. Offshore
- 7.1. Market Analysis, Insights and Forecast - by Service
- 8. Asia Pacific Drilling Waste Management Services Industry Analysis, Insights and Forecast, 2019-2031
- 8.1. Market Analysis, Insights and Forecast - by Service
- 8.1.1. Solid Control
- 8.1.2. Containment & Handling
- 8.1.3. Others
- 8.2. Market Analysis, Insights and Forecast - by Location of Deployment
- 8.2.1. Onshore
- 8.2.2. Offshore
- 8.1. Market Analysis, Insights and Forecast - by Service
- 9. South America Drilling Waste Management Services Industry Analysis, Insights and Forecast, 2019-2031
- 9.1. Market Analysis, Insights and Forecast - by Service
- 9.1.1. Solid Control
- 9.1.2. Containment & Handling
- 9.1.3. Others
- 9.2. Market Analysis, Insights and Forecast - by Location of Deployment
- 9.2.1. Onshore
- 9.2.2. Offshore
- 9.1. Market Analysis, Insights and Forecast - by Service
- 10. Middle East and Africa Drilling Waste Management Services Industry Analysis, Insights and Forecast, 2019-2031
- 10.1. Market Analysis, Insights and Forecast - by Service
- 10.1.1. Solid Control
- 10.1.2. Containment & Handling
- 10.1.3. Others
- 10.2. Market Analysis, Insights and Forecast - by Location of Deployment
- 10.2.1. Onshore
- 10.2.2. Offshore
- 10.1. Market Analysis, Insights and Forecast - by Service
- 11. North America Drilling Waste Management Services Industry Analysis, Insights and Forecast, 2019-2031
- 11.1. Market Analysis, Insights and Forecast - By Country/Sub-region
- 11.1.1 United States
- 11.1.2 Canada
- 11.1.3 Mexico
- 12. Europe Drilling Waste Management Services Industry Analysis, Insights and Forecast, 2019-2031
- 12.1. Market Analysis, Insights and Forecast - By Country/Sub-region
- 12.1.1 Germany
- 12.1.2 United Kingdom
- 12.1.3 France
- 12.1.4 Spain
- 12.1.5 Italy
- 12.1.6 Spain
- 12.1.7 Belgium
- 12.1.8 Netherland
- 12.1.9 Nordics
- 12.1.10 Rest of Europe
- 13. Asia Pacific Drilling Waste Management Services Industry Analysis, Insights and Forecast, 2019-2031
- 13.1. Market Analysis, Insights and Forecast - By Country/Sub-region
- 13.1.1 China
- 13.1.2 Japan
- 13.1.3 India
- 13.1.4 South Korea
- 13.1.5 Southeast Asia
- 13.1.6 Australia
- 13.1.7 Indonesia
- 13.1.8 Phillipes
- 13.1.9 Singapore
- 13.1.10 Thailandc
- 13.1.11 Rest of Asia Pacific
- 14. South America Drilling Waste Management Services Industry Analysis, Insights and Forecast, 2019-2031
- 14.1. Market Analysis, Insights and Forecast - By Country/Sub-region
- 14.1.1 Brazil
- 14.1.2 Argentina
- 14.1.3 Peru
- 14.1.4 Chile
- 14.1.5 Colombia
- 14.1.6 Ecuador
- 14.1.7 Venezuela
- 14.1.8 Rest of South America
- 15. North America Drilling Waste Management Services Industry Analysis, Insights and Forecast, 2019-2031
- 15.1. Market Analysis, Insights and Forecast - By Country/Sub-region
- 15.1.1 United States
- 15.1.2 Canada
- 15.1.3 Mexico
- 16. MEA Drilling Waste Management Services Industry Analysis, Insights and Forecast, 2019-2031
- 16.1. Market Analysis, Insights and Forecast - By Country/Sub-region
- 16.1.1 United Arab Emirates
- 16.1.2 Saudi Arabia
- 16.1.3 South Africa
- 16.1.4 Rest of Middle East and Africa
- 17. Competitive Analysis
- 17.1. Global Market Share Analysis 2024
- 17.2. Company Profiles
- 17.2.1 Solids Control Services
- 17.2.1.1. Overview
- 17.2.1.2. Products
- 17.2.1.3. SWOT Analysis
- 17.2.1.4. Recent Developments
- 17.2.1.5. Financials (Based on Availability)
- 17.2.2 TWMA Group Ltd
- 17.2.2.1. Overview
- 17.2.2.2. Products
- 17.2.2.3. SWOT Analysis
- 17.2.2.4. Recent Developments
- 17.2.2.5. Financials (Based on Availability)
- 17.2.3 GN Solids Control
- 17.2.3.1. Overview
- 17.2.3.2. Products
- 17.2.3.3. SWOT Analysis
- 17.2.3.4. Recent Developments
- 17.2.3.5. Financials (Based on Availability)
- 17.2.4 Baker Hughes Co
- 17.2.4.1. Overview
- 17.2.4.2. Products
- 17.2.4.3. SWOT Analysis
- 17.2.4.4. Recent Developments
- 17.2.4.5. Financials (Based on Availability)
- 17.2.5 National Oil Well Varco Inc
- 17.2.5.1. Overview
- 17.2.5.2. Products
- 17.2.5.3. SWOT Analysis
- 17.2.5.4. Recent Developments
- 17.2.5.5. Financials (Based on Availability)
- 17.2.6 Schlumberger Ltd
- 17.2.6.1. Overview
- 17.2.6.2. Products
- 17.2.6.3. SWOT Analysis
- 17.2.6.4. Recent Developments
- 17.2.6.5. Financials (Based on Availability)
- 17.2.7 Eco-Logic Environmental Engineering Inc
- 17.2.7.1. Overview
- 17.2.7.2. Products
- 17.2.7.3. SWOT Analysis
- 17.2.7.4. Recent Developments
- 17.2.7.5. Financials (Based on Availability)
- 17.2.8 Halliburton Company
- 17.2.8.1. Overview
- 17.2.8.2. Products
- 17.2.8.3. SWOT Analysis
- 17.2.8.4. Recent Developments
- 17.2.8.5. Financials (Based on Availability)
- 17.2.9 Weatherford International PLC*List Not Exhaustive
- 17.2.9.1. Overview
- 17.2.9.2. Products
- 17.2.9.3. SWOT Analysis
- 17.2.9.4. Recent Developments
- 17.2.9.5. Financials (Based on Availability)
- 17.2.10 SAR AS
- 17.2.10.1. Overview
- 17.2.10.2. Products
- 17.2.10.3. SWOT Analysis
- 17.2.10.4. Recent Developments
- 17.2.10.5. Financials (Based on Availability)
- 17.2.1 Solids Control Services
List of Figures
- Figure 1: Global Drilling Waste Management Services Industry Revenue Breakdown (Million, %) by Region 2024 & 2032
- Figure 2: North America Drilling Waste Management Services Industry Revenue (Million), by Country 2024 & 2032
- Figure 3: North America Drilling Waste Management Services Industry Revenue Share (%), by Country 2024 & 2032
- Figure 4: Europe Drilling Waste Management Services Industry Revenue (Million), by Country 2024 & 2032
- Figure 5: Europe Drilling Waste Management Services Industry Revenue Share (%), by Country 2024 & 2032
- Figure 6: Asia Pacific Drilling Waste Management Services Industry Revenue (Million), by Country 2024 & 2032
- Figure 7: Asia Pacific Drilling Waste Management Services Industry Revenue Share (%), by Country 2024 & 2032
- Figure 8: South America Drilling Waste Management Services Industry Revenue (Million), by Country 2024 & 2032
- Figure 9: South America Drilling Waste Management Services Industry Revenue Share (%), by Country 2024 & 2032
- Figure 10: North America Drilling Waste Management Services Industry Revenue (Million), by Country 2024 & 2032
- Figure 11: North America Drilling Waste Management Services Industry Revenue Share (%), by Country 2024 & 2032
- Figure 12: MEA Drilling Waste Management Services Industry Revenue (Million), by Country 2024 & 2032
- Figure 13: MEA Drilling Waste Management Services Industry Revenue Share (%), by Country 2024 & 2032
- Figure 14: North America Drilling Waste Management Services Industry Revenue (Million), by Service 2024 & 2032
- Figure 15: North America Drilling Waste Management Services Industry Revenue Share (%), by Service 2024 & 2032
- Figure 16: North America Drilling Waste Management Services Industry Revenue (Million), by Location of Deployment 2024 & 2032
- Figure 17: North America Drilling Waste Management Services Industry Revenue Share (%), by Location of Deployment 2024 & 2032
- Figure 18: North America Drilling Waste Management Services Industry Revenue (Million), by Country 2024 & 2032
- Figure 19: North America Drilling Waste Management Services Industry Revenue Share (%), by Country 2024 & 2032
- Figure 20: Europe Drilling Waste Management Services Industry Revenue (Million), by Service 2024 & 2032
- Figure 21: Europe Drilling Waste Management Services Industry Revenue Share (%), by Service 2024 & 2032
- Figure 22: Europe Drilling Waste Management Services Industry Revenue (Million), by Location of Deployment 2024 & 2032
- Figure 23: Europe Drilling Waste Management Services Industry Revenue Share (%), by Location of Deployment 2024 & 2032
- Figure 24: Europe Drilling Waste Management Services Industry Revenue (Million), by Country 2024 & 2032
- Figure 25: Europe Drilling Waste Management Services Industry Revenue Share (%), by Country 2024 & 2032
- Figure 26: Asia Pacific Drilling Waste Management Services Industry Revenue (Million), by Service 2024 & 2032
- Figure 27: Asia Pacific Drilling Waste Management Services Industry Revenue Share (%), by Service 2024 & 2032
- Figure 28: Asia Pacific Drilling Waste Management Services Industry Revenue (Million), by Location of Deployment 2024 & 2032
- Figure 29: Asia Pacific Drilling Waste Management Services Industry Revenue Share (%), by Location of Deployment 2024 & 2032
- Figure 30: Asia Pacific Drilling Waste Management Services Industry Revenue (Million), by Country 2024 & 2032
- Figure 31: Asia Pacific Drilling Waste Management Services Industry Revenue Share (%), by Country 2024 & 2032
- Figure 32: South America Drilling Waste Management Services Industry Revenue (Million), by Service 2024 & 2032
- Figure 33: South America Drilling Waste Management Services Industry Revenue Share (%), by Service 2024 & 2032
- Figure 34: South America Drilling Waste Management Services Industry Revenue (Million), by Location of Deployment 2024 & 2032
- Figure 35: South America Drilling Waste Management Services Industry Revenue Share (%), by Location of Deployment 2024 & 2032
- Figure 36: South America Drilling Waste Management Services Industry Revenue (Million), by Country 2024 & 2032
- Figure 37: South America Drilling Waste Management Services Industry Revenue Share (%), by Country 2024 & 2032
- Figure 38: Middle East and Africa Drilling Waste Management Services Industry Revenue (Million), by Service 2024 & 2032
- Figure 39: Middle East and Africa Drilling Waste Management Services Industry Revenue Share (%), by Service 2024 & 2032
- Figure 40: Middle East and Africa Drilling Waste Management Services Industry Revenue (Million), by Location of Deployment 2024 & 2032
- Figure 41: Middle East and Africa Drilling Waste Management Services Industry Revenue Share (%), by Location of Deployment 2024 & 2032
- Figure 42: Middle East and Africa Drilling Waste Management Services Industry Revenue (Million), by Country 2024 & 2032
- Figure 43: Middle East and Africa Drilling Waste Management Services Industry Revenue Share (%), by Country 2024 & 2032
List of Tables
- Table 1: Global Drilling Waste Management Services Industry Revenue Million Forecast, by Region 2019 & 2032
- Table 2: Global Drilling Waste Management Services Industry Revenue Million Forecast, by Service 2019 & 2032
- Table 3: Global Drilling Waste Management Services Industry Revenue Million Forecast, by Location of Deployment 2019 & 2032
- Table 4: Global Drilling Waste Management Services Industry Revenue Million Forecast, by Region 2019 & 2032
- Table 5: Global Drilling Waste Management Services Industry Revenue Million Forecast, by Country 2019 & 2032
- Table 6: United States Drilling Waste Management Services Industry Revenue (Million) Forecast, by Application 2019 & 2032
- Table 7: Canada Drilling Waste Management Services Industry Revenue (Million) Forecast, by Application 2019 & 2032
- Table 8: Mexico Drilling Waste Management Services Industry Revenue (Million) Forecast, by Application 2019 & 2032
- Table 9: Global Drilling Waste Management Services Industry Revenue Million Forecast, by Country 2019 & 2032
- Table 10: Germany Drilling Waste Management Services Industry Revenue (Million) Forecast, by Application 2019 & 2032
- Table 11: United Kingdom Drilling Waste Management Services Industry Revenue (Million) Forecast, by Application 2019 & 2032
- Table 12: France Drilling Waste Management Services Industry Revenue (Million) Forecast, by Application 2019 & 2032
- Table 13: Spain Drilling Waste Management Services Industry Revenue (Million) Forecast, by Application 2019 & 2032
- Table 14: Italy Drilling Waste Management Services Industry Revenue (Million) Forecast, by Application 2019 & 2032
- Table 15: Spain Drilling Waste Management Services Industry Revenue (Million) Forecast, by Application 2019 & 2032
- Table 16: Belgium Drilling Waste Management Services Industry Revenue (Million) Forecast, by Application 2019 & 2032
- Table 17: Netherland Drilling Waste Management Services Industry Revenue (Million) Forecast, by Application 2019 & 2032
- Table 18: Nordics Drilling Waste Management Services Industry Revenue (Million) Forecast, by Application 2019 & 2032
- Table 19: Rest of Europe Drilling Waste Management Services Industry Revenue (Million) Forecast, by Application 2019 & 2032
- Table 20: Global Drilling Waste Management Services Industry Revenue Million Forecast, by Country 2019 & 2032
- Table 21: China Drilling Waste Management Services Industry Revenue (Million) Forecast, by Application 2019 & 2032
- Table 22: Japan Drilling Waste Management Services Industry Revenue (Million) Forecast, by Application 2019 & 2032
- Table 23: India Drilling Waste Management Services Industry Revenue (Million) Forecast, by Application 2019 & 2032
- Table 24: South Korea Drilling Waste Management Services Industry Revenue (Million) Forecast, by Application 2019 & 2032
- Table 25: Southeast Asia Drilling Waste Management Services Industry Revenue (Million) Forecast, by Application 2019 & 2032
- Table 26: Australia Drilling Waste Management Services Industry Revenue (Million) Forecast, by Application 2019 & 2032
- Table 27: Indonesia Drilling Waste Management Services Industry Revenue (Million) Forecast, by Application 2019 & 2032
- Table 28: Phillipes Drilling Waste Management Services Industry Revenue (Million) Forecast, by Application 2019 & 2032
- Table 29: Singapore Drilling Waste Management Services Industry Revenue (Million) Forecast, by Application 2019 & 2032
- Table 30: Thailandc Drilling Waste Management Services Industry Revenue (Million) Forecast, by Application 2019 & 2032
- Table 31: Rest of Asia Pacific Drilling Waste Management Services Industry Revenue (Million) Forecast, by Application 2019 & 2032
- Table 32: Global Drilling Waste Management Services Industry Revenue Million Forecast, by Country 2019 & 2032
- Table 33: Brazil Drilling Waste Management Services Industry Revenue (Million) Forecast, by Application 2019 & 2032
- Table 34: Argentina Drilling Waste Management Services Industry Revenue (Million) Forecast, by Application 2019 & 2032
- Table 35: Peru Drilling Waste Management Services Industry Revenue (Million) Forecast, by Application 2019 & 2032
- Table 36: Chile Drilling Waste Management Services Industry Revenue (Million) Forecast, by Application 2019 & 2032
- Table 37: Colombia Drilling Waste Management Services Industry Revenue (Million) Forecast, by Application 2019 & 2032
- Table 38: Ecuador Drilling Waste Management Services Industry Revenue (Million) Forecast, by Application 2019 & 2032
- Table 39: Venezuela Drilling Waste Management Services Industry Revenue (Million) Forecast, by Application 2019 & 2032
- Table 40: Rest of South America Drilling Waste Management Services Industry Revenue (Million) Forecast, by Application 2019 & 2032
- Table 41: Global Drilling Waste Management Services Industry Revenue Million Forecast, by Country 2019 & 2032
- Table 42: United States Drilling Waste Management Services Industry Revenue (Million) Forecast, by Application 2019 & 2032
- Table 43: Canada Drilling Waste Management Services Industry Revenue (Million) Forecast, by Application 2019 & 2032
- Table 44: Mexico Drilling Waste Management Services Industry Revenue (Million) Forecast, by Application 2019 & 2032
- Table 45: Global Drilling Waste Management Services Industry Revenue Million Forecast, by Country 2019 & 2032
- Table 46: United Arab Emirates Drilling Waste Management Services Industry Revenue (Million) Forecast, by Application 2019 & 2032
- Table 47: Saudi Arabia Drilling Waste Management Services Industry Revenue (Million) Forecast, by Application 2019 & 2032
- Table 48: South Africa Drilling Waste Management Services Industry Revenue (Million) Forecast, by Application 2019 & 2032
- Table 49: Rest of Middle East and Africa Drilling Waste Management Services Industry Revenue (Million) Forecast, by Application 2019 & 2032
- Table 50: Global Drilling Waste Management Services Industry Revenue Million Forecast, by Service 2019 & 2032
- Table 51: Global Drilling Waste Management Services Industry Revenue Million Forecast, by Location of Deployment 2019 & 2032
- Table 52: Global Drilling Waste Management Services Industry Revenue Million Forecast, by Country 2019 & 2032
- Table 53: Global Drilling Waste Management Services Industry Revenue Million Forecast, by Service 2019 & 2032
- Table 54: Global Drilling Waste Management Services Industry Revenue Million Forecast, by Location of Deployment 2019 & 2032
- Table 55: Global Drilling Waste Management Services Industry Revenue Million Forecast, by Country 2019 & 2032
- Table 56: Global Drilling Waste Management Services Industry Revenue Million Forecast, by Service 2019 & 2032
- Table 57: Global Drilling Waste Management Services Industry Revenue Million Forecast, by Location of Deployment 2019 & 2032
- Table 58: Global Drilling Waste Management Services Industry Revenue Million Forecast, by Country 2019 & 2032
- Table 59: Global Drilling Waste Management Services Industry Revenue Million Forecast, by Service 2019 & 2032
- Table 60: Global Drilling Waste Management Services Industry Revenue Million Forecast, by Location of Deployment 2019 & 2032
- Table 61: Global Drilling Waste Management Services Industry Revenue Million Forecast, by Country 2019 & 2032
- Table 62: Global Drilling Waste Management Services Industry Revenue Million Forecast, by Service 2019 & 2032
- Table 63: Global Drilling Waste Management Services Industry Revenue Million Forecast, by Location of Deployment 2019 & 2032
- Table 64: Global Drilling Waste Management Services Industry Revenue Million Forecast, by Country 2019 & 2032
Frequently Asked Questions
1. What is the projected Compound Annual Growth Rate (CAGR) of the Drilling Waste Management Services Industry?
The projected CAGR is approximately > 4.00%.
2. Which companies are prominent players in the Drilling Waste Management Services Industry?
Key companies in the market include Solids Control Services, TWMA Group Ltd, GN Solids Control, Baker Hughes Co, National Oil Well Varco Inc, Schlumberger Ltd, Eco-Logic Environmental Engineering Inc, Halliburton Company, Weatherford International PLC*List Not Exhaustive, SAR AS.
3. What are the main segments of the Drilling Waste Management Services Industry?
The market segments include Service, Location of Deployment.
4. Can you provide details about the market size?
The market size is estimated to be USD XX Million as of 2022.
5. What are some drivers contributing to market growth?
4.; Presence of Strict Government Regulations to Control Air Pollution.
6. What are the notable trends driving market growth?
Offshore Oil & Gas to Dominate the Market.
7. Are there any restraints impacting market growth?
4.; Increasing Adoption of Renewable Energy.
8. Can you provide examples of recent developments in the market?
N/A
9. What pricing options are available for accessing the report?
Pricing options include single-user, multi-user, and enterprise licenses priced at USD 4750, USD 5250, and USD 8750 respectively.
10. Is the market size provided in terms of value or volume?
The market size is provided in terms of value, measured in Million.
11. Are there any specific market keywords associated with the report?
Yes, the market keyword associated with the report is "Drilling Waste Management Services Industry," which aids in identifying and referencing the specific market segment covered.
12. How do I determine which pricing option suits my needs best?
The pricing options vary based on user requirements and access needs. Individual users may opt for single-user licenses, while businesses requiring broader access may choose multi-user or enterprise licenses for cost-effective access to the report.
13. Are there any additional resources or data provided in the Drilling Waste Management Services Industry report?
While the report offers comprehensive insights, it's advisable to review the specific contents or supplementary materials provided to ascertain if additional resources or data are available.
14. How can I stay updated on further developments or reports in the Drilling Waste Management Services Industry?
To stay informed about further developments, trends, and reports in the Drilling Waste Management Services Industry, consider subscribing to industry newsletters, following relevant companies and organizations, or regularly checking reputable industry news sources and publications.
Methodology
Step 1 - Identification of Relevant Samples Size from Population Database


Step 2 - Approaches for Defining Global Market Size (Value, Volume* & Price*)

Note*: In applicable scenarios
Step 3 - Data Sources
Primary Research
- Web Analytics
- Survey Reports
- Research Institute
- Latest Research Reports
- Opinion Leaders
Secondary Research
- Annual Reports
- White Paper
- Latest Press Release
- Industry Association
- Paid Database
- Investor Presentations

Step 4 - Data Triangulation
Involves using different sources of information in order to increase the validity of a study
These sources are likely to be stakeholders in a program - participants, other researchers, program staff, other community members, and so on.
Then we put all data in single framework & apply various statistical tools to find out the dynamic on the market.
During the analysis stage, feedback from the stakeholder groups would be compared to determine areas of agreement as well as areas of divergence


