
Key Insights
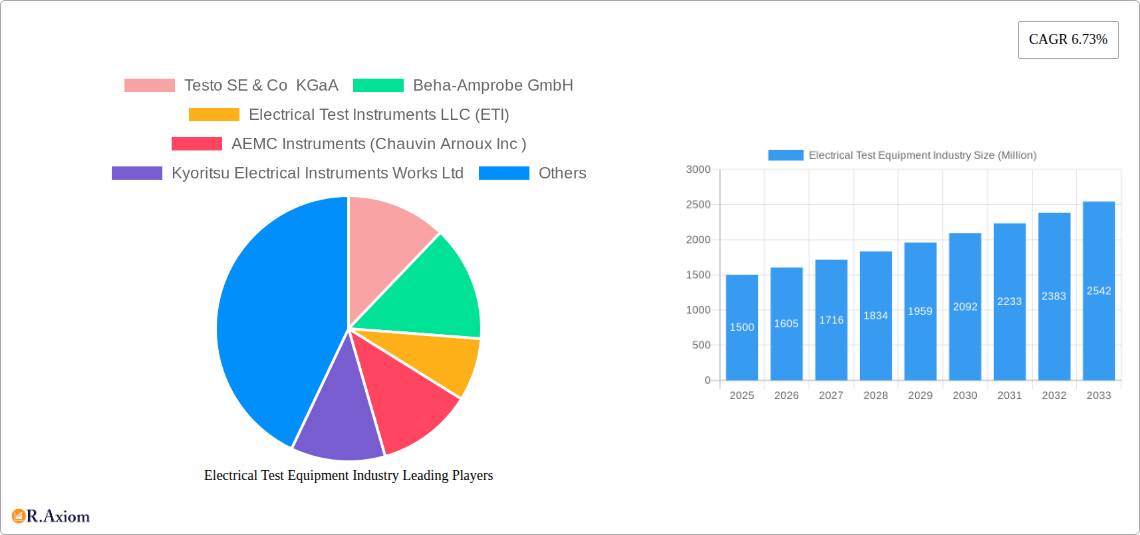
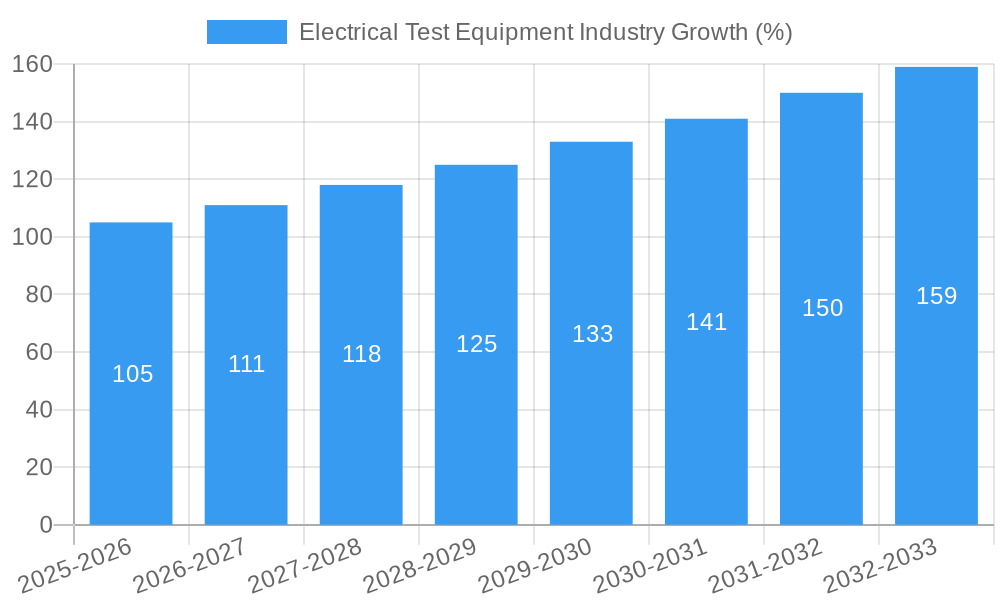
The global electrical test equipment market, valued at approximately $XX million in 2025, is projected to experience robust growth, driven by a compound annual growth rate (CAGR) of 6.73% from 2025 to 2033. This expansion is fueled by several key factors. Firstly, the increasing demand for reliable and efficient power grids globally necessitates rigorous testing and maintenance of electrical equipment, driving demand for advanced testing solutions. Secondly, the growth of industries like renewable energy, aerospace, and consumer electronics, all heavily reliant on sophisticated electrical systems, creates significant opportunities for electrical test equipment manufacturers. Stringent safety regulations and quality control standards across various sectors further bolster market growth. Technological advancements, such as the development of portable and smart testing devices, are also contributing to the market's expansion by improving efficiency and accessibility. Furthermore, the rising adoption of Industry 4.0 principles and automation in manufacturing processes is increasing the need for integrated and automated testing solutions.
However, the market faces certain challenges. The high initial investment cost associated with advanced testing equipment may limit adoption, particularly among small and medium-sized enterprises (SMEs). Competition from established players and emerging manufacturers can also exert pressure on pricing and profit margins. Additionally, fluctuations in raw material prices and global economic uncertainties can affect market growth. Despite these headwinds, the long-term prospects for the electrical test equipment market remain positive, driven by ongoing technological innovations, increasing infrastructure investments, and stringent safety regulations across diverse industries. The market segmentation, encompassing various equipment types (stationary, portable), testing applications (voltage, functionality, etc.), and industry applications (energy, aerospace, manufacturing, etc.) offers significant opportunities for specialized players to cater to specific niche needs.
This comprehensive report provides an in-depth analysis of the Electrical Test Equipment industry, encompassing market size, segmentation, leading players, technological advancements, and future growth prospects. The study period covers 2019-2033, with 2025 as the base and estimated year. The report is crucial for industry stakeholders, investors, and strategic decision-makers seeking a thorough understanding of this dynamic market. The total market size in 2025 is estimated at xx Million, projected to reach xx Million by 2033, exhibiting a CAGR of xx%.
Electrical Test Equipment Industry Market Concentration & Innovation
The Electrical Test Equipment market exhibits a moderately concentrated landscape, with a few major players holding significant market share. Fluke Corporation, Keysight Technologies Inc, and Megger Group Limited are among the leading companies, collectively accounting for an estimated xx% of the global market share in 2025. However, several smaller, specialized players also contribute significantly to niche segments.
Innovation is a key driver, fueled by the increasing demand for sophisticated testing solutions across diverse industries. The industry is characterized by continuous product development, focusing on enhanced accuracy, portability, automation, and integration with smart technologies. Stringent safety and regulatory standards across various geographic regions also influence innovation.
Product substitution is a relatively low concern, given the specialized nature of the equipment. However, the emergence of cloud-based testing solutions and digital transformation initiatives presents both opportunities and challenges.
Mergers and acquisitions (M&A) activities have played a role in shaping market consolidation. While specific M&A deal values are not publicly available for all transactions, several significant acquisitions have involved both established players and smaller technology companies in recent years, driving technological advancements and market expansion. Examples include [Insert specific examples and values if available, otherwise use "xx Million" as a placeholder for deal values].
- Market Concentration: High (xx% market share held by top 3 players)
- Innovation Drivers: Advancements in digital technologies, stringent safety regulations, rising demand for higher accuracy and efficiency.
- Regulatory Frameworks: Vary by region, impacting product design and certification.
- Product Substitutes: Limited, but cloud-based solutions pose potential competition.
- End-User Trends: Increasing adoption of automation and smart technologies.
- M&A Activities: Consolidation through acquisitions, driving technological integration and market expansion.
Electrical Test Equipment Industry Industry Trends & Insights
The Electrical Test Equipment industry is witnessing robust growth, driven by several factors. The rising demand for reliable and efficient power infrastructure is a key catalyst. This is particularly evident in the energy and power sector, experiencing significant investment in renewable energy sources and smart grids. Moreover, the increasing adoption of automation in manufacturing processes necessitates advanced testing solutions to ensure quality control and enhance productivity. The electronics sector, particularly in consumer electronics and aerospace and defense, is another growth area due to the rising sophistication of electronic components and devices.
Technological advancements play a significant role, with the integration of digital technologies, AI, and IoT capabilities enhancing the functionality and efficiency of test equipment. Consumer preference is shifting towards versatile, user-friendly, and data-driven testing solutions. The competitive dynamics are characterized by continuous product innovation, strategic partnerships, and a focus on providing comprehensive solutions to meet the diverse needs of end-users. This results in a dynamic landscape with ongoing competition and innovation.
- Market Growth Drivers: Growing investment in infrastructure (especially renewable energy and smart grids), increasing automation in manufacturing, rising demand for high-quality electronic devices.
- Technological Disruptions: Integration of digital technologies, AI, and IoT.
- Consumer Preferences: User-friendly interface, advanced data analytics capabilities, and portability.
- Competitive Dynamics: Strong competition characterized by innovation, strategic partnerships, and focus on comprehensive solutions.
Dominant Markets & Segments in Electrical Test Equipment Industry
The global electrical test equipment market is segmented by equipment type (stationary and portable), testing application (voltage testing, functionality testing, other testing applications), and industry application (energy and power, aerospace and defense, manufacturing, consumer electronics, oil and gas, and other industrial applications).
By Equipment Type: The portable segment is experiencing faster growth due to its flexibility and ease of use, particularly in field applications.
By Testing Application: Voltage testing constitutes a significant portion of the market due to its critical role in ensuring safety and reliability across industries.
By Industry Application: The energy and power sector holds a dominant position, followed by manufacturing and aerospace & defense, driven by the high demand for reliable equipment and regulatory compliance needs.
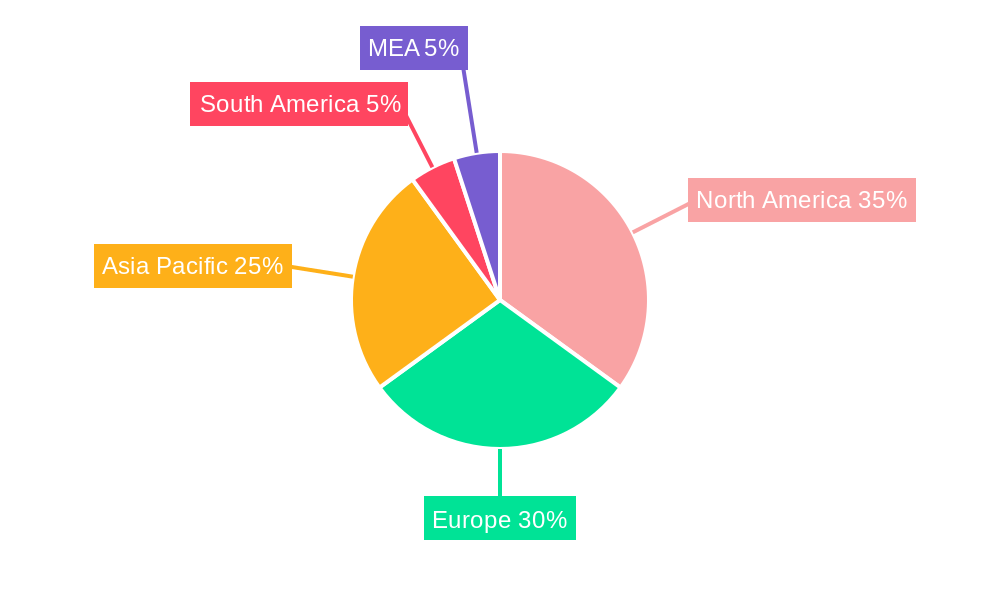
Leading Regions/Countries: (Detailed analysis required to identify leading regions/countries. This section needs specific data to populate meaningfully. Placeholder text below.)
- North America (Key drivers: Stringent safety regulations, technological advancements, significant investments in infrastructure)
- Europe (Key drivers: Growing industrial automation, focus on renewable energy)
- Asia Pacific (Key drivers: Rapid industrialization, increasing electronics manufacturing)
Electrical Test Equipment Industry Product Developments
Recent years have witnessed significant product innovations, including the introduction of integrated, multi-functional test equipment, cloud-based data management systems, and advanced diagnostic tools. These advancements enable faster testing cycles, improved accuracy, and better data analysis capabilities. Companies are focusing on enhancing user experience and integration capabilities, catering to the increasing demand for streamlined workflows and data-driven decision-making. The market favors products that are compact, lightweight, robust, and easily integrated into existing systems.
Report Scope & Segmentation Analysis
By Equipment Type: This section will analyze the market size, growth projections, and competitive dynamics of stationary and portable electrical test equipment. The portable segment is expected to witness significant growth due to its flexibility.
By Testing Application: This section will analyze the market size, growth projections, and competitive dynamics for voltage testing, functionality testing, and other testing applications. Voltage testing is a significant sector.
By Industry Application: This section will analyze the market size, growth projections, and competitive dynamics for various industry applications such as energy and power, aerospace and defense, manufacturing, consumer electronics, oil and gas, and other industrial applications. The energy and power segment is expected to be a significant driver of market growth.
Key Drivers of Electrical Test Equipment Industry Growth
Growth is primarily driven by rising demand for efficient and reliable power grids, stringent safety standards, and the increasing adoption of automation across industries. Technological advancements, particularly the integration of digital technologies and smart sensors, significantly improve test accuracy and efficiency. Government regulations and initiatives promoting renewable energy and industrial safety also fuel the market.
Challenges in the Electrical Test Equipment Industry Sector
Challenges include intense competition, fluctuating raw material prices, and the need for continuous innovation to meet evolving industry standards. Supply chain disruptions can affect production and delivery timelines. Moreover, maintaining compliance with evolving safety regulations across different geographical markets poses a significant challenge.
Emerging Opportunities in Electrical Test Equipment Industry
Emerging opportunities lie in the development of advanced testing solutions for renewable energy systems, smart grids, and electric vehicles. There's also potential in integrating IoT and AI capabilities into test equipment to enhance data analytics and predictive maintenance. Developing testing solutions for emerging technologies like 5G and IoT presents considerable opportunities for growth.
Leading Players in the Electrical Test Equipment Industry Market
- Testo SE & Co KGaA
- Beha-Amprobe GmbH
- Electrical Test Instruments LLC (ETI)
- AEMC Instruments (Chauvin Arnoux Inc)
- Kyoritsu Electrical Instruments Works Ltd
- Megger Group Limited
- Fluke Corporation
- Keysight Technologies Inc
- Scientific Mes-Technik Pvt Ltd
- PCE Holding GmbH
- Haefely Hipotronics (Hubbell Incorporated)
Key Developments in Electrical Test Equipment Industry Industry
- March 2022: Fluke Networks upgraded its LinkIQ Cable+Network Tester, enhancing IP network testing, industrial Ethernet cabling testing, and multilingual support.
- January 2022: Anritsu Corporation's 5G NR Mobile Device Test Platform ME7834NR received approval for industry-first Release 16 Protocol Conformance tests.
- March 2021: Anritsu introduced the TRX Test module, MU887002A, improving 5G device production-line inspection efficiency.
Strategic Outlook for Electrical Test Equipment Industry Market
The Electrical Test Equipment market is poised for continued growth, driven by increasing automation across sectors, rising demand for efficient energy infrastructure, and the need for robust safety standards. Technological advancements and the adoption of digital technologies will continue to shape the market landscape, presenting significant opportunities for innovation and expansion in the coming years. The focus on sustainable energy and the adoption of new technologies will create demand for specialized test equipment, fueling market growth.
Electrical Test Equipment Industry Segmentation
-
1. Equipment Type
- 1.1. Stationary
- 1.2. Portable
-
2. Testing Application
- 2.1. Voltage Testing
- 2.2. Functionality Testing
- 2.3. Other Testing Applications
-
3. Industry Application
- 3.1. Energy and Power
- 3.2. Aerospace and Defense
- 3.3. Manufacturing
- 3.4. Consumer Electronics
- 3.5. Oil and Gas
- 3.6. Other Industrial Applications
Electrical Test Equipment Industry Segmentation By Geography
- 1. North America
- 2. Europe
- 3. Asia Pacific
- 4. Latin America
- 5. Middle East
Electrical Test Equipment Industry REPORT HIGHLIGHTS
| Aspects | Details |
|---|---|
| Study Period | 2019-2033 |
| Base Year | 2024 |
| Estimated Year | 2025 |
| Forecast Period | 2025-2033 |
| Historical Period | 2019-2024 |
| Growth Rate | CAGR of 6.73% from 2019-2033 |
| Segmentation |
|
Table of Contents
- 1. Introduction
- 1.1. Research Scope
- 1.2. Market Segmentation
- 1.3. Research Methodology
- 1.4. Definitions and Assumptions
- 2. Executive Summary
- 2.1. Introduction
- 3. Market Dynamics
- 3.1. Introduction
- 3.2. Market Drivers
- 3.2.1. Government Regulations for Electric Safety Measures; Industrial Development in Emerging Regions
- 3.3. Market Restrains
- 3.3.1. High Initial Cost of 3D Motion Capture Software
- 3.4. Market Trends
- 3.4.1. Energy & Power is Expected to Hold Significant Share
- 4. Market Factor Analysis
- 4.1. Porters Five Forces
- 4.2. Supply/Value Chain
- 4.3. PESTEL analysis
- 4.4. Market Entropy
- 4.5. Patent/Trademark Analysis
- 5. Global Electrical Test Equipment Industry Analysis, Insights and Forecast, 2019-2031
- 5.1. Market Analysis, Insights and Forecast - by Equipment Type
- 5.1.1. Stationary
- 5.1.2. Portable
- 5.2. Market Analysis, Insights and Forecast - by Testing Application
- 5.2.1. Voltage Testing
- 5.2.2. Functionality Testing
- 5.2.3. Other Testing Applications
- 5.3. Market Analysis, Insights and Forecast - by Industry Application
- 5.3.1. Energy and Power
- 5.3.2. Aerospace and Defense
- 5.3.3. Manufacturing
- 5.3.4. Consumer Electronics
- 5.3.5. Oil and Gas
- 5.3.6. Other Industrial Applications
- 5.4. Market Analysis, Insights and Forecast - by Region
- 5.4.1. North America
- 5.4.2. Europe
- 5.4.3. Asia Pacific
- 5.4.4. Latin America
- 5.4.5. Middle East
- 5.1. Market Analysis, Insights and Forecast - by Equipment Type
- 6. North America Electrical Test Equipment Industry Analysis, Insights and Forecast, 2019-2031
- 6.1. Market Analysis, Insights and Forecast - by Equipment Type
- 6.1.1. Stationary
- 6.1.2. Portable
- 6.2. Market Analysis, Insights and Forecast - by Testing Application
- 6.2.1. Voltage Testing
- 6.2.2. Functionality Testing
- 6.2.3. Other Testing Applications
- 6.3. Market Analysis, Insights and Forecast - by Industry Application
- 6.3.1. Energy and Power
- 6.3.2. Aerospace and Defense
- 6.3.3. Manufacturing
- 6.3.4. Consumer Electronics
- 6.3.5. Oil and Gas
- 6.3.6. Other Industrial Applications
- 6.1. Market Analysis, Insights and Forecast - by Equipment Type
- 7. Europe Electrical Test Equipment Industry Analysis, Insights and Forecast, 2019-2031
- 7.1. Market Analysis, Insights and Forecast - by Equipment Type
- 7.1.1. Stationary
- 7.1.2. Portable
- 7.2. Market Analysis, Insights and Forecast - by Testing Application
- 7.2.1. Voltage Testing
- 7.2.2. Functionality Testing
- 7.2.3. Other Testing Applications
- 7.3. Market Analysis, Insights and Forecast - by Industry Application
- 7.3.1. Energy and Power
- 7.3.2. Aerospace and Defense
- 7.3.3. Manufacturing
- 7.3.4. Consumer Electronics
- 7.3.5. Oil and Gas
- 7.3.6. Other Industrial Applications
- 7.1. Market Analysis, Insights and Forecast - by Equipment Type
- 8. Asia Pacific Electrical Test Equipment Industry Analysis, Insights and Forecast, 2019-2031
- 8.1. Market Analysis, Insights and Forecast - by Equipment Type
- 8.1.1. Stationary
- 8.1.2. Portable
- 8.2. Market Analysis, Insights and Forecast - by Testing Application
- 8.2.1. Voltage Testing
- 8.2.2. Functionality Testing
- 8.2.3. Other Testing Applications
- 8.3. Market Analysis, Insights and Forecast - by Industry Application
- 8.3.1. Energy and Power
- 8.3.2. Aerospace and Defense
- 8.3.3. Manufacturing
- 8.3.4. Consumer Electronics
- 8.3.5. Oil and Gas
- 8.3.6. Other Industrial Applications
- 8.1. Market Analysis, Insights and Forecast - by Equipment Type
- 9. Latin America Electrical Test Equipment Industry Analysis, Insights and Forecast, 2019-2031
- 9.1. Market Analysis, Insights and Forecast - by Equipment Type
- 9.1.1. Stationary
- 9.1.2. Portable
- 9.2. Market Analysis, Insights and Forecast - by Testing Application
- 9.2.1. Voltage Testing
- 9.2.2. Functionality Testing
- 9.2.3. Other Testing Applications
- 9.3. Market Analysis, Insights and Forecast - by Industry Application
- 9.3.1. Energy and Power
- 9.3.2. Aerospace and Defense
- 9.3.3. Manufacturing
- 9.3.4. Consumer Electronics
- 9.3.5. Oil and Gas
- 9.3.6. Other Industrial Applications
- 9.1. Market Analysis, Insights and Forecast - by Equipment Type
- 10. Middle East Electrical Test Equipment Industry Analysis, Insights and Forecast, 2019-2031
- 10.1. Market Analysis, Insights and Forecast - by Equipment Type
- 10.1.1. Stationary
- 10.1.2. Portable
- 10.2. Market Analysis, Insights and Forecast - by Testing Application
- 10.2.1. Voltage Testing
- 10.2.2. Functionality Testing
- 10.2.3. Other Testing Applications
- 10.3. Market Analysis, Insights and Forecast - by Industry Application
- 10.3.1. Energy and Power
- 10.3.2. Aerospace and Defense
- 10.3.3. Manufacturing
- 10.3.4. Consumer Electronics
- 10.3.5. Oil and Gas
- 10.3.6. Other Industrial Applications
- 10.1. Market Analysis, Insights and Forecast - by Equipment Type
- 11. North America Electrical Test Equipment Industry Analysis, Insights and Forecast, 2019-2031
- 11.1. Market Analysis, Insights and Forecast - By Country/Sub-region
- 11.1.1 United States
- 11.1.2 Canada
- 11.1.3 Mexico
- 12. Europe Electrical Test Equipment Industry Analysis, Insights and Forecast, 2019-2031
- 12.1. Market Analysis, Insights and Forecast - By Country/Sub-region
- 12.1.1 Germany
- 12.1.2 United Kingdom
- 12.1.3 France
- 12.1.4 Spain
- 12.1.5 Italy
- 12.1.6 Spain
- 12.1.7 Belgium
- 12.1.8 Netherland
- 12.1.9 Nordics
- 12.1.10 Rest of Europe
- 13. Asia Pacific Electrical Test Equipment Industry Analysis, Insights and Forecast, 2019-2031
- 13.1. Market Analysis, Insights and Forecast - By Country/Sub-region
- 13.1.1 China
- 13.1.2 Japan
- 13.1.3 India
- 13.1.4 South Korea
- 13.1.5 Southeast Asia
- 13.1.6 Australia
- 13.1.7 Indonesia
- 13.1.8 Phillipes
- 13.1.9 Singapore
- 13.1.10 Thailandc
- 13.1.11 Rest of Asia Pacific
- 14. South America Electrical Test Equipment Industry Analysis, Insights and Forecast, 2019-2031
- 14.1. Market Analysis, Insights and Forecast - By Country/Sub-region
- 14.1.1 Brazil
- 14.1.2 Argentina
- 14.1.3 Peru
- 14.1.4 Chile
- 14.1.5 Colombia
- 14.1.6 Ecuador
- 14.1.7 Venezuela
- 14.1.8 Rest of South America
- 15. North America Electrical Test Equipment Industry Analysis, Insights and Forecast, 2019-2031
- 15.1. Market Analysis, Insights and Forecast - By Country/Sub-region
- 15.1.1 United States
- 15.1.2 Canada
- 15.1.3 Mexico
- 16. MEA Electrical Test Equipment Industry Analysis, Insights and Forecast, 2019-2031
- 16.1. Market Analysis, Insights and Forecast - By Country/Sub-region
- 16.1.1 United Arab Emirates
- 16.1.2 Saudi Arabia
- 16.1.3 South Africa
- 16.1.4 Rest of Middle East and Africa
- 17. Competitive Analysis
- 17.1. Global Market Share Analysis 2024
- 17.2. Company Profiles
- 17.2.1 Testo SE & Co KGaA
- 17.2.1.1. Overview
- 17.2.1.2. Products
- 17.2.1.3. SWOT Analysis
- 17.2.1.4. Recent Developments
- 17.2.1.5. Financials (Based on Availability)
- 17.2.2 Beha-Amprobe GmbH
- 17.2.2.1. Overview
- 17.2.2.2. Products
- 17.2.2.3. SWOT Analysis
- 17.2.2.4. Recent Developments
- 17.2.2.5. Financials (Based on Availability)
- 17.2.3 Electrical Test Instruments LLC (ETI)
- 17.2.3.1. Overview
- 17.2.3.2. Products
- 17.2.3.3. SWOT Analysis
- 17.2.3.4. Recent Developments
- 17.2.3.5. Financials (Based on Availability)
- 17.2.4 AEMC Instruments (Chauvin Arnoux Inc )
- 17.2.4.1. Overview
- 17.2.4.2. Products
- 17.2.4.3. SWOT Analysis
- 17.2.4.4. Recent Developments
- 17.2.4.5. Financials (Based on Availability)
- 17.2.5 Kyoritsu Electrical Instruments Works Ltd
- 17.2.5.1. Overview
- 17.2.5.2. Products
- 17.2.5.3. SWOT Analysis
- 17.2.5.4. Recent Developments
- 17.2.5.5. Financials (Based on Availability)
- 17.2.6 Megger Group Limited
- 17.2.6.1. Overview
- 17.2.6.2. Products
- 17.2.6.3. SWOT Analysis
- 17.2.6.4. Recent Developments
- 17.2.6.5. Financials (Based on Availability)
- 17.2.7 Fluke Corporation
- 17.2.7.1. Overview
- 17.2.7.2. Products
- 17.2.7.3. SWOT Analysis
- 17.2.7.4. Recent Developments
- 17.2.7.5. Financials (Based on Availability)
- 17.2.8 Keysight Technologies Inc
- 17.2.8.1. Overview
- 17.2.8.2. Products
- 17.2.8.3. SWOT Analysis
- 17.2.8.4. Recent Developments
- 17.2.8.5. Financials (Based on Availability)
- 17.2.9 Scientific Mes-Technik Pvt Ltd
- 17.2.9.1. Overview
- 17.2.9.2. Products
- 17.2.9.3. SWOT Analysis
- 17.2.9.4. Recent Developments
- 17.2.9.5. Financials (Based on Availability)
- 17.2.10 PCE Holding GmbH
- 17.2.10.1. Overview
- 17.2.10.2. Products
- 17.2.10.3. SWOT Analysis
- 17.2.10.4. Recent Developments
- 17.2.10.5. Financials (Based on Availability)
- 17.2.11 Haefely Hipotronics (Hubbell Incorporated)
- 17.2.11.1. Overview
- 17.2.11.2. Products
- 17.2.11.3. SWOT Analysis
- 17.2.11.4. Recent Developments
- 17.2.11.5. Financials (Based on Availability)
- 17.2.1 Testo SE & Co KGaA
List of Figures
- Figure 1: Global Electrical Test Equipment Industry Revenue Breakdown (Million, %) by Region 2024 & 2032
- Figure 2: Global Electrical Test Equipment Industry Volume Breakdown (K Unit, %) by Region 2024 & 2032
- Figure 3: North America Electrical Test Equipment Industry Revenue (Million), by Country 2024 & 2032
- Figure 4: North America Electrical Test Equipment Industry Volume (K Unit), by Country 2024 & 2032
- Figure 5: North America Electrical Test Equipment Industry Revenue Share (%), by Country 2024 & 2032
- Figure 6: North America Electrical Test Equipment Industry Volume Share (%), by Country 2024 & 2032
- Figure 7: Europe Electrical Test Equipment Industry Revenue (Million), by Country 2024 & 2032
- Figure 8: Europe Electrical Test Equipment Industry Volume (K Unit), by Country 2024 & 2032
- Figure 9: Europe Electrical Test Equipment Industry Revenue Share (%), by Country 2024 & 2032
- Figure 10: Europe Electrical Test Equipment Industry Volume Share (%), by Country 2024 & 2032
- Figure 11: Asia Pacific Electrical Test Equipment Industry Revenue (Million), by Country 2024 & 2032
- Figure 12: Asia Pacific Electrical Test Equipment Industry Volume (K Unit), by Country 2024 & 2032
- Figure 13: Asia Pacific Electrical Test Equipment Industry Revenue Share (%), by Country 2024 & 2032
- Figure 14: Asia Pacific Electrical Test Equipment Industry Volume Share (%), by Country 2024 & 2032
- Figure 15: South America Electrical Test Equipment Industry Revenue (Million), by Country 2024 & 2032
- Figure 16: South America Electrical Test Equipment Industry Volume (K Unit), by Country 2024 & 2032
- Figure 17: South America Electrical Test Equipment Industry Revenue Share (%), by Country 2024 & 2032
- Figure 18: South America Electrical Test Equipment Industry Volume Share (%), by Country 2024 & 2032
- Figure 19: North America Electrical Test Equipment Industry Revenue (Million), by Country 2024 & 2032
- Figure 20: North America Electrical Test Equipment Industry Volume (K Unit), by Country 2024 & 2032
- Figure 21: North America Electrical Test Equipment Industry Revenue Share (%), by Country 2024 & 2032
- Figure 22: North America Electrical Test Equipment Industry Volume Share (%), by Country 2024 & 2032
- Figure 23: MEA Electrical Test Equipment Industry Revenue (Million), by Country 2024 & 2032
- Figure 24: MEA Electrical Test Equipment Industry Volume (K Unit), by Country 2024 & 2032
- Figure 25: MEA Electrical Test Equipment Industry Revenue Share (%), by Country 2024 & 2032
- Figure 26: MEA Electrical Test Equipment Industry Volume Share (%), by Country 2024 & 2032
- Figure 27: North America Electrical Test Equipment Industry Revenue (Million), by Equipment Type 2024 & 2032
- Figure 28: North America Electrical Test Equipment Industry Volume (K Unit), by Equipment Type 2024 & 2032
- Figure 29: North America Electrical Test Equipment Industry Revenue Share (%), by Equipment Type 2024 & 2032
- Figure 30: North America Electrical Test Equipment Industry Volume Share (%), by Equipment Type 2024 & 2032
- Figure 31: North America Electrical Test Equipment Industry Revenue (Million), by Testing Application 2024 & 2032
- Figure 32: North America Electrical Test Equipment Industry Volume (K Unit), by Testing Application 2024 & 2032
- Figure 33: North America Electrical Test Equipment Industry Revenue Share (%), by Testing Application 2024 & 2032
- Figure 34: North America Electrical Test Equipment Industry Volume Share (%), by Testing Application 2024 & 2032
- Figure 35: North America Electrical Test Equipment Industry Revenue (Million), by Industry Application 2024 & 2032
- Figure 36: North America Electrical Test Equipment Industry Volume (K Unit), by Industry Application 2024 & 2032
- Figure 37: North America Electrical Test Equipment Industry Revenue Share (%), by Industry Application 2024 & 2032
- Figure 38: North America Electrical Test Equipment Industry Volume Share (%), by Industry Application 2024 & 2032
- Figure 39: North America Electrical Test Equipment Industry Revenue (Million), by Country 2024 & 2032
- Figure 40: North America Electrical Test Equipment Industry Volume (K Unit), by Country 2024 & 2032
- Figure 41: North America Electrical Test Equipment Industry Revenue Share (%), by Country 2024 & 2032
- Figure 42: North America Electrical Test Equipment Industry Volume Share (%), by Country 2024 & 2032
- Figure 43: Europe Electrical Test Equipment Industry Revenue (Million), by Equipment Type 2024 & 2032
- Figure 44: Europe Electrical Test Equipment Industry Volume (K Unit), by Equipment Type 2024 & 2032
- Figure 45: Europe Electrical Test Equipment Industry Revenue Share (%), by Equipment Type 2024 & 2032
- Figure 46: Europe Electrical Test Equipment Industry Volume Share (%), by Equipment Type 2024 & 2032
- Figure 47: Europe Electrical Test Equipment Industry Revenue (Million), by Testing Application 2024 & 2032
- Figure 48: Europe Electrical Test Equipment Industry Volume (K Unit), by Testing Application 2024 & 2032
- Figure 49: Europe Electrical Test Equipment Industry Revenue Share (%), by Testing Application 2024 & 2032
- Figure 50: Europe Electrical Test Equipment Industry Volume Share (%), by Testing Application 2024 & 2032
- Figure 51: Europe Electrical Test Equipment Industry Revenue (Million), by Industry Application 2024 & 2032
- Figure 52: Europe Electrical Test Equipment Industry Volume (K Unit), by Industry Application 2024 & 2032
- Figure 53: Europe Electrical Test Equipment Industry Revenue Share (%), by Industry Application 2024 & 2032
- Figure 54: Europe Electrical Test Equipment Industry Volume Share (%), by Industry Application 2024 & 2032
- Figure 55: Europe Electrical Test Equipment Industry Revenue (Million), by Country 2024 & 2032
- Figure 56: Europe Electrical Test Equipment Industry Volume (K Unit), by Country 2024 & 2032
- Figure 57: Europe Electrical Test Equipment Industry Revenue Share (%), by Country 2024 & 2032
- Figure 58: Europe Electrical Test Equipment Industry Volume Share (%), by Country 2024 & 2032
- Figure 59: Asia Pacific Electrical Test Equipment Industry Revenue (Million), by Equipment Type 2024 & 2032
- Figure 60: Asia Pacific Electrical Test Equipment Industry Volume (K Unit), by Equipment Type 2024 & 2032
- Figure 61: Asia Pacific Electrical Test Equipment Industry Revenue Share (%), by Equipment Type 2024 & 2032
- Figure 62: Asia Pacific Electrical Test Equipment Industry Volume Share (%), by Equipment Type 2024 & 2032
- Figure 63: Asia Pacific Electrical Test Equipment Industry Revenue (Million), by Testing Application 2024 & 2032
- Figure 64: Asia Pacific Electrical Test Equipment Industry Volume (K Unit), by Testing Application 2024 & 2032
- Figure 65: Asia Pacific Electrical Test Equipment Industry Revenue Share (%), by Testing Application 2024 & 2032
- Figure 66: Asia Pacific Electrical Test Equipment Industry Volume Share (%), by Testing Application 2024 & 2032
- Figure 67: Asia Pacific Electrical Test Equipment Industry Revenue (Million), by Industry Application 2024 & 2032
- Figure 68: Asia Pacific Electrical Test Equipment Industry Volume (K Unit), by Industry Application 2024 & 2032
- Figure 69: Asia Pacific Electrical Test Equipment Industry Revenue Share (%), by Industry Application 2024 & 2032
- Figure 70: Asia Pacific Electrical Test Equipment Industry Volume Share (%), by Industry Application 2024 & 2032
- Figure 71: Asia Pacific Electrical Test Equipment Industry Revenue (Million), by Country 2024 & 2032
- Figure 72: Asia Pacific Electrical Test Equipment Industry Volume (K Unit), by Country 2024 & 2032
- Figure 73: Asia Pacific Electrical Test Equipment Industry Revenue Share (%), by Country 2024 & 2032
- Figure 74: Asia Pacific Electrical Test Equipment Industry Volume Share (%), by Country 2024 & 2032
- Figure 75: Latin America Electrical Test Equipment Industry Revenue (Million), by Equipment Type 2024 & 2032
- Figure 76: Latin America Electrical Test Equipment Industry Volume (K Unit), by Equipment Type 2024 & 2032
- Figure 77: Latin America Electrical Test Equipment Industry Revenue Share (%), by Equipment Type 2024 & 2032
- Figure 78: Latin America Electrical Test Equipment Industry Volume Share (%), by Equipment Type 2024 & 2032
- Figure 79: Latin America Electrical Test Equipment Industry Revenue (Million), by Testing Application 2024 & 2032
- Figure 80: Latin America Electrical Test Equipment Industry Volume (K Unit), by Testing Application 2024 & 2032
- Figure 81: Latin America Electrical Test Equipment Industry Revenue Share (%), by Testing Application 2024 & 2032
- Figure 82: Latin America Electrical Test Equipment Industry Volume Share (%), by Testing Application 2024 & 2032
- Figure 83: Latin America Electrical Test Equipment Industry Revenue (Million), by Industry Application 2024 & 2032
- Figure 84: Latin America Electrical Test Equipment Industry Volume (K Unit), by Industry Application 2024 & 2032
- Figure 85: Latin America Electrical Test Equipment Industry Revenue Share (%), by Industry Application 2024 & 2032
- Figure 86: Latin America Electrical Test Equipment Industry Volume Share (%), by Industry Application 2024 & 2032
- Figure 87: Latin America Electrical Test Equipment Industry Revenue (Million), by Country 2024 & 2032
- Figure 88: Latin America Electrical Test Equipment Industry Volume (K Unit), by Country 2024 & 2032
- Figure 89: Latin America Electrical Test Equipment Industry Revenue Share (%), by Country 2024 & 2032
- Figure 90: Latin America Electrical Test Equipment Industry Volume Share (%), by Country 2024 & 2032
- Figure 91: Middle East Electrical Test Equipment Industry Revenue (Million), by Equipment Type 2024 & 2032
- Figure 92: Middle East Electrical Test Equipment Industry Volume (K Unit), by Equipment Type 2024 & 2032
- Figure 93: Middle East Electrical Test Equipment Industry Revenue Share (%), by Equipment Type 2024 & 2032
- Figure 94: Middle East Electrical Test Equipment Industry Volume Share (%), by Equipment Type 2024 & 2032
- Figure 95: Middle East Electrical Test Equipment Industry Revenue (Million), by Testing Application 2024 & 2032
- Figure 96: Middle East Electrical Test Equipment Industry Volume (K Unit), by Testing Application 2024 & 2032
- Figure 97: Middle East Electrical Test Equipment Industry Revenue Share (%), by Testing Application 2024 & 2032
- Figure 98: Middle East Electrical Test Equipment Industry Volume Share (%), by Testing Application 2024 & 2032
- Figure 99: Middle East Electrical Test Equipment Industry Revenue (Million), by Industry Application 2024 & 2032
- Figure 100: Middle East Electrical Test Equipment Industry Volume (K Unit), by Industry Application 2024 & 2032
- Figure 101: Middle East Electrical Test Equipment Industry Revenue Share (%), by Industry Application 2024 & 2032
- Figure 102: Middle East Electrical Test Equipment Industry Volume Share (%), by Industry Application 2024 & 2032
- Figure 103: Middle East Electrical Test Equipment Industry Revenue (Million), by Country 2024 & 2032
- Figure 104: Middle East Electrical Test Equipment Industry Volume (K Unit), by Country 2024 & 2032
- Figure 105: Middle East Electrical Test Equipment Industry Revenue Share (%), by Country 2024 & 2032
- Figure 106: Middle East Electrical Test Equipment Industry Volume Share (%), by Country 2024 & 2032
List of Tables
- Table 1: Global Electrical Test Equipment Industry Revenue Million Forecast, by Region 2019 & 2032
- Table 2: Global Electrical Test Equipment Industry Volume K Unit Forecast, by Region 2019 & 2032
- Table 3: Global Electrical Test Equipment Industry Revenue Million Forecast, by Equipment Type 2019 & 2032
- Table 4: Global Electrical Test Equipment Industry Volume K Unit Forecast, by Equipment Type 2019 & 2032
- Table 5: Global Electrical Test Equipment Industry Revenue Million Forecast, by Testing Application 2019 & 2032
- Table 6: Global Electrical Test Equipment Industry Volume K Unit Forecast, by Testing Application 2019 & 2032
- Table 7: Global Electrical Test Equipment Industry Revenue Million Forecast, by Industry Application 2019 & 2032
- Table 8: Global Electrical Test Equipment Industry Volume K Unit Forecast, by Industry Application 2019 & 2032
- Table 9: Global Electrical Test Equipment Industry Revenue Million Forecast, by Region 2019 & 2032
- Table 10: Global Electrical Test Equipment Industry Volume K Unit Forecast, by Region 2019 & 2032
- Table 11: Global Electrical Test Equipment Industry Revenue Million Forecast, by Country 2019 & 2032
- Table 12: Global Electrical Test Equipment Industry Volume K Unit Forecast, by Country 2019 & 2032
- Table 13: United States Electrical Test Equipment Industry Revenue (Million) Forecast, by Application 2019 & 2032
- Table 14: United States Electrical Test Equipment Industry Volume (K Unit) Forecast, by Application 2019 & 2032
- Table 15: Canada Electrical Test Equipment Industry Revenue (Million) Forecast, by Application 2019 & 2032
- Table 16: Canada Electrical Test Equipment Industry Volume (K Unit) Forecast, by Application 2019 & 2032
- Table 17: Mexico Electrical Test Equipment Industry Revenue (Million) Forecast, by Application 2019 & 2032
- Table 18: Mexico Electrical Test Equipment Industry Volume (K Unit) Forecast, by Application 2019 & 2032
- Table 19: Global Electrical Test Equipment Industry Revenue Million Forecast, by Country 2019 & 2032
- Table 20: Global Electrical Test Equipment Industry Volume K Unit Forecast, by Country 2019 & 2032
- Table 21: Germany Electrical Test Equipment Industry Revenue (Million) Forecast, by Application 2019 & 2032
- Table 22: Germany Electrical Test Equipment Industry Volume (K Unit) Forecast, by Application 2019 & 2032
- Table 23: United Kingdom Electrical Test Equipment Industry Revenue (Million) Forecast, by Application 2019 & 2032
- Table 24: United Kingdom Electrical Test Equipment Industry Volume (K Unit) Forecast, by Application 2019 & 2032
- Table 25: France Electrical Test Equipment Industry Revenue (Million) Forecast, by Application 2019 & 2032
- Table 26: France Electrical Test Equipment Industry Volume (K Unit) Forecast, by Application 2019 & 2032
- Table 27: Spain Electrical Test Equipment Industry Revenue (Million) Forecast, by Application 2019 & 2032
- Table 28: Spain Electrical Test Equipment Industry Volume (K Unit) Forecast, by Application 2019 & 2032
- Table 29: Italy Electrical Test Equipment Industry Revenue (Million) Forecast, by Application 2019 & 2032
- Table 30: Italy Electrical Test Equipment Industry Volume (K Unit) Forecast, by Application 2019 & 2032
- Table 31: Spain Electrical Test Equipment Industry Revenue (Million) Forecast, by Application 2019 & 2032
- Table 32: Spain Electrical Test Equipment Industry Volume (K Unit) Forecast, by Application 2019 & 2032
- Table 33: Belgium Electrical Test Equipment Industry Revenue (Million) Forecast, by Application 2019 & 2032
- Table 34: Belgium Electrical Test Equipment Industry Volume (K Unit) Forecast, by Application 2019 & 2032
- Table 35: Netherland Electrical Test Equipment Industry Revenue (Million) Forecast, by Application 2019 & 2032
- Table 36: Netherland Electrical Test Equipment Industry Volume (K Unit) Forecast, by Application 2019 & 2032
- Table 37: Nordics Electrical Test Equipment Industry Revenue (Million) Forecast, by Application 2019 & 2032
- Table 38: Nordics Electrical Test Equipment Industry Volume (K Unit) Forecast, by Application 2019 & 2032
- Table 39: Rest of Europe Electrical Test Equipment Industry Revenue (Million) Forecast, by Application 2019 & 2032
- Table 40: Rest of Europe Electrical Test Equipment Industry Volume (K Unit) Forecast, by Application 2019 & 2032
- Table 41: Global Electrical Test Equipment Industry Revenue Million Forecast, by Country 2019 & 2032
- Table 42: Global Electrical Test Equipment Industry Volume K Unit Forecast, by Country 2019 & 2032
- Table 43: China Electrical Test Equipment Industry Revenue (Million) Forecast, by Application 2019 & 2032
- Table 44: China Electrical Test Equipment Industry Volume (K Unit) Forecast, by Application 2019 & 2032
- Table 45: Japan Electrical Test Equipment Industry Revenue (Million) Forecast, by Application 2019 & 2032
- Table 46: Japan Electrical Test Equipment Industry Volume (K Unit) Forecast, by Application 2019 & 2032
- Table 47: India Electrical Test Equipment Industry Revenue (Million) Forecast, by Application 2019 & 2032
- Table 48: India Electrical Test Equipment Industry Volume (K Unit) Forecast, by Application 2019 & 2032
- Table 49: South Korea Electrical Test Equipment Industry Revenue (Million) Forecast, by Application 2019 & 2032
- Table 50: South Korea Electrical Test Equipment Industry Volume (K Unit) Forecast, by Application 2019 & 2032
- Table 51: Southeast Asia Electrical Test Equipment Industry Revenue (Million) Forecast, by Application 2019 & 2032
- Table 52: Southeast Asia Electrical Test Equipment Industry Volume (K Unit) Forecast, by Application 2019 & 2032
- Table 53: Australia Electrical Test Equipment Industry Revenue (Million) Forecast, by Application 2019 & 2032
- Table 54: Australia Electrical Test Equipment Industry Volume (K Unit) Forecast, by Application 2019 & 2032
- Table 55: Indonesia Electrical Test Equipment Industry Revenue (Million) Forecast, by Application 2019 & 2032
- Table 56: Indonesia Electrical Test Equipment Industry Volume (K Unit) Forecast, by Application 2019 & 2032
- Table 57: Phillipes Electrical Test Equipment Industry Revenue (Million) Forecast, by Application 2019 & 2032
- Table 58: Phillipes Electrical Test Equipment Industry Volume (K Unit) Forecast, by Application 2019 & 2032
- Table 59: Singapore Electrical Test Equipment Industry Revenue (Million) Forecast, by Application 2019 & 2032
- Table 60: Singapore Electrical Test Equipment Industry Volume (K Unit) Forecast, by Application 2019 & 2032
- Table 61: Thailandc Electrical Test Equipment Industry Revenue (Million) Forecast, by Application 2019 & 2032
- Table 62: Thailandc Electrical Test Equipment Industry Volume (K Unit) Forecast, by Application 2019 & 2032
- Table 63: Rest of Asia Pacific Electrical Test Equipment Industry Revenue (Million) Forecast, by Application 2019 & 2032
- Table 64: Rest of Asia Pacific Electrical Test Equipment Industry Volume (K Unit) Forecast, by Application 2019 & 2032
- Table 65: Global Electrical Test Equipment Industry Revenue Million Forecast, by Country 2019 & 2032
- Table 66: Global Electrical Test Equipment Industry Volume K Unit Forecast, by Country 2019 & 2032
- Table 67: Brazil Electrical Test Equipment Industry Revenue (Million) Forecast, by Application 2019 & 2032
- Table 68: Brazil Electrical Test Equipment Industry Volume (K Unit) Forecast, by Application 2019 & 2032
- Table 69: Argentina Electrical Test Equipment Industry Revenue (Million) Forecast, by Application 2019 & 2032
- Table 70: Argentina Electrical Test Equipment Industry Volume (K Unit) Forecast, by Application 2019 & 2032
- Table 71: Peru Electrical Test Equipment Industry Revenue (Million) Forecast, by Application 2019 & 2032
- Table 72: Peru Electrical Test Equipment Industry Volume (K Unit) Forecast, by Application 2019 & 2032
- Table 73: Chile Electrical Test Equipment Industry Revenue (Million) Forecast, by Application 2019 & 2032
- Table 74: Chile Electrical Test Equipment Industry Volume (K Unit) Forecast, by Application 2019 & 2032
- Table 75: Colombia Electrical Test Equipment Industry Revenue (Million) Forecast, by Application 2019 & 2032
- Table 76: Colombia Electrical Test Equipment Industry Volume (K Unit) Forecast, by Application 2019 & 2032
- Table 77: Ecuador Electrical Test Equipment Industry Revenue (Million) Forecast, by Application 2019 & 2032
- Table 78: Ecuador Electrical Test Equipment Industry Volume (K Unit) Forecast, by Application 2019 & 2032
- Table 79: Venezuela Electrical Test Equipment Industry Revenue (Million) Forecast, by Application 2019 & 2032
- Table 80: Venezuela Electrical Test Equipment Industry Volume (K Unit) Forecast, by Application 2019 & 2032
- Table 81: Rest of South America Electrical Test Equipment Industry Revenue (Million) Forecast, by Application 2019 & 2032
- Table 82: Rest of South America Electrical Test Equipment Industry Volume (K Unit) Forecast, by Application 2019 & 2032
- Table 83: Global Electrical Test Equipment Industry Revenue Million Forecast, by Country 2019 & 2032
- Table 84: Global Electrical Test Equipment Industry Volume K Unit Forecast, by Country 2019 & 2032
- Table 85: United States Electrical Test Equipment Industry Revenue (Million) Forecast, by Application 2019 & 2032
- Table 86: United States Electrical Test Equipment Industry Volume (K Unit) Forecast, by Application 2019 & 2032
- Table 87: Canada Electrical Test Equipment Industry Revenue (Million) Forecast, by Application 2019 & 2032
- Table 88: Canada Electrical Test Equipment Industry Volume (K Unit) Forecast, by Application 2019 & 2032
- Table 89: Mexico Electrical Test Equipment Industry Revenue (Million) Forecast, by Application 2019 & 2032
- Table 90: Mexico Electrical Test Equipment Industry Volume (K Unit) Forecast, by Application 2019 & 2032
- Table 91: Global Electrical Test Equipment Industry Revenue Million Forecast, by Country 2019 & 2032
- Table 92: Global Electrical Test Equipment Industry Volume K Unit Forecast, by Country 2019 & 2032
- Table 93: United Arab Emirates Electrical Test Equipment Industry Revenue (Million) Forecast, by Application 2019 & 2032
- Table 94: United Arab Emirates Electrical Test Equipment Industry Volume (K Unit) Forecast, by Application 2019 & 2032
- Table 95: Saudi Arabia Electrical Test Equipment Industry Revenue (Million) Forecast, by Application 2019 & 2032
- Table 96: Saudi Arabia Electrical Test Equipment Industry Volume (K Unit) Forecast, by Application 2019 & 2032
- Table 97: South Africa Electrical Test Equipment Industry Revenue (Million) Forecast, by Application 2019 & 2032
- Table 98: South Africa Electrical Test Equipment Industry Volume (K Unit) Forecast, by Application 2019 & 2032
- Table 99: Rest of Middle East and Africa Electrical Test Equipment Industry Revenue (Million) Forecast, by Application 2019 & 2032
- Table 100: Rest of Middle East and Africa Electrical Test Equipment Industry Volume (K Unit) Forecast, by Application 2019 & 2032
- Table 101: Global Electrical Test Equipment Industry Revenue Million Forecast, by Equipment Type 2019 & 2032
- Table 102: Global Electrical Test Equipment Industry Volume K Unit Forecast, by Equipment Type 2019 & 2032
- Table 103: Global Electrical Test Equipment Industry Revenue Million Forecast, by Testing Application 2019 & 2032
- Table 104: Global Electrical Test Equipment Industry Volume K Unit Forecast, by Testing Application 2019 & 2032
- Table 105: Global Electrical Test Equipment Industry Revenue Million Forecast, by Industry Application 2019 & 2032
- Table 106: Global Electrical Test Equipment Industry Volume K Unit Forecast, by Industry Application 2019 & 2032
- Table 107: Global Electrical Test Equipment Industry Revenue Million Forecast, by Country 2019 & 2032
- Table 108: Global Electrical Test Equipment Industry Volume K Unit Forecast, by Country 2019 & 2032
- Table 109: Global Electrical Test Equipment Industry Revenue Million Forecast, by Equipment Type 2019 & 2032
- Table 110: Global Electrical Test Equipment Industry Volume K Unit Forecast, by Equipment Type 2019 & 2032
- Table 111: Global Electrical Test Equipment Industry Revenue Million Forecast, by Testing Application 2019 & 2032
- Table 112: Global Electrical Test Equipment Industry Volume K Unit Forecast, by Testing Application 2019 & 2032
- Table 113: Global Electrical Test Equipment Industry Revenue Million Forecast, by Industry Application 2019 & 2032
- Table 114: Global Electrical Test Equipment Industry Volume K Unit Forecast, by Industry Application 2019 & 2032
- Table 115: Global Electrical Test Equipment Industry Revenue Million Forecast, by Country 2019 & 2032
- Table 116: Global Electrical Test Equipment Industry Volume K Unit Forecast, by Country 2019 & 2032
- Table 117: Global Electrical Test Equipment Industry Revenue Million Forecast, by Equipment Type 2019 & 2032
- Table 118: Global Electrical Test Equipment Industry Volume K Unit Forecast, by Equipment Type 2019 & 2032
- Table 119: Global Electrical Test Equipment Industry Revenue Million Forecast, by Testing Application 2019 & 2032
- Table 120: Global Electrical Test Equipment Industry Volume K Unit Forecast, by Testing Application 2019 & 2032
- Table 121: Global Electrical Test Equipment Industry Revenue Million Forecast, by Industry Application 2019 & 2032
- Table 122: Global Electrical Test Equipment Industry Volume K Unit Forecast, by Industry Application 2019 & 2032
- Table 123: Global Electrical Test Equipment Industry Revenue Million Forecast, by Country 2019 & 2032
- Table 124: Global Electrical Test Equipment Industry Volume K Unit Forecast, by Country 2019 & 2032
- Table 125: Global Electrical Test Equipment Industry Revenue Million Forecast, by Equipment Type 2019 & 2032
- Table 126: Global Electrical Test Equipment Industry Volume K Unit Forecast, by Equipment Type 2019 & 2032
- Table 127: Global Electrical Test Equipment Industry Revenue Million Forecast, by Testing Application 2019 & 2032
- Table 128: Global Electrical Test Equipment Industry Volume K Unit Forecast, by Testing Application 2019 & 2032
- Table 129: Global Electrical Test Equipment Industry Revenue Million Forecast, by Industry Application 2019 & 2032
- Table 130: Global Electrical Test Equipment Industry Volume K Unit Forecast, by Industry Application 2019 & 2032
- Table 131: Global Electrical Test Equipment Industry Revenue Million Forecast, by Country 2019 & 2032
- Table 132: Global Electrical Test Equipment Industry Volume K Unit Forecast, by Country 2019 & 2032
- Table 133: Global Electrical Test Equipment Industry Revenue Million Forecast, by Equipment Type 2019 & 2032
- Table 134: Global Electrical Test Equipment Industry Volume K Unit Forecast, by Equipment Type 2019 & 2032
- Table 135: Global Electrical Test Equipment Industry Revenue Million Forecast, by Testing Application 2019 & 2032
- Table 136: Global Electrical Test Equipment Industry Volume K Unit Forecast, by Testing Application 2019 & 2032
- Table 137: Global Electrical Test Equipment Industry Revenue Million Forecast, by Industry Application 2019 & 2032
- Table 138: Global Electrical Test Equipment Industry Volume K Unit Forecast, by Industry Application 2019 & 2032
- Table 139: Global Electrical Test Equipment Industry Revenue Million Forecast, by Country 2019 & 2032
- Table 140: Global Electrical Test Equipment Industry Volume K Unit Forecast, by Country 2019 & 2032
Frequently Asked Questions
1. What is the projected Compound Annual Growth Rate (CAGR) of the Electrical Test Equipment Industry?
The projected CAGR is approximately 6.73%.
2. Which companies are prominent players in the Electrical Test Equipment Industry?
Key companies in the market include Testo SE & Co KGaA, Beha-Amprobe GmbH, Electrical Test Instruments LLC (ETI), AEMC Instruments (Chauvin Arnoux Inc ), Kyoritsu Electrical Instruments Works Ltd, Megger Group Limited, Fluke Corporation, Keysight Technologies Inc , Scientific Mes-Technik Pvt Ltd, PCE Holding GmbH, Haefely Hipotronics (Hubbell Incorporated).
3. What are the main segments of the Electrical Test Equipment Industry?
The market segments include Equipment Type, Testing Application, Industry Application.
4. Can you provide details about the market size?
The market size is estimated to be USD XX Million as of 2022.
5. What are some drivers contributing to market growth?
Government Regulations for Electric Safety Measures; Industrial Development in Emerging Regions.
6. What are the notable trends driving market growth?
Energy & Power is Expected to Hold Significant Share.
7. Are there any restraints impacting market growth?
High Initial Cost of 3D Motion Capture Software.
8. Can you provide examples of recent developments in the market?
March 2022 - Fluke Networks has announced an upgrade to its LinkIQ Cable+Network Tester, which expands the tester's ability to test and troubleshoot IP networks, test industrial Ethernet cabling, and provide user support in twelve languages. This new software includes all new LinkIQ units and is a free upgrade for existing customers.
9. What pricing options are available for accessing the report?
Pricing options include single-user, multi-user, and enterprise licenses priced at USD 4750, USD 5250, and USD 8750 respectively.
10. Is the market size provided in terms of value or volume?
The market size is provided in terms of value, measured in Million and volume, measured in K Unit.
11. Are there any specific market keywords associated with the report?
Yes, the market keyword associated with the report is "Electrical Test Equipment Industry," which aids in identifying and referencing the specific market segment covered.
12. How do I determine which pricing option suits my needs best?
The pricing options vary based on user requirements and access needs. Individual users may opt for single-user licenses, while businesses requiring broader access may choose multi-user or enterprise licenses for cost-effective access to the report.
13. Are there any additional resources or data provided in the Electrical Test Equipment Industry report?
While the report offers comprehensive insights, it's advisable to review the specific contents or supplementary materials provided to ascertain if additional resources or data are available.
14. How can I stay updated on further developments or reports in the Electrical Test Equipment Industry?
To stay informed about further developments, trends, and reports in the Electrical Test Equipment Industry, consider subscribing to industry newsletters, following relevant companies and organizations, or regularly checking reputable industry news sources and publications.
Methodology
Step 1 - Identification of Relevant Samples Size from Population Database


Step 2 - Approaches for Defining Global Market Size (Value, Volume* & Price*)

Note*: In applicable scenarios
Step 3 - Data Sources
Primary Research
- Web Analytics
- Survey Reports
- Research Institute
- Latest Research Reports
- Opinion Leaders
Secondary Research
- Annual Reports
- White Paper
- Latest Press Release
- Industry Association
- Paid Database
- Investor Presentations

Step 4 - Data Triangulation
Involves using different sources of information in order to increase the validity of a study
These sources are likely to be stakeholders in a program - participants, other researchers, program staff, other community members, and so on.
Then we put all data in single framework & apply various statistical tools to find out the dynamic on the market.
During the analysis stage, feedback from the stakeholder groups would be compared to determine areas of agreement as well as areas of divergence


