
Key Insights
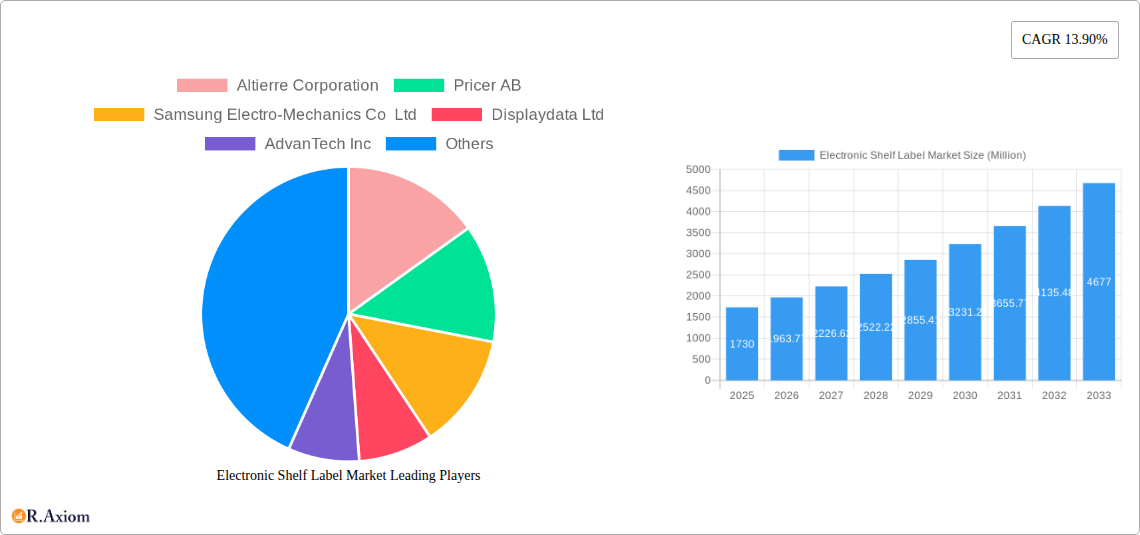
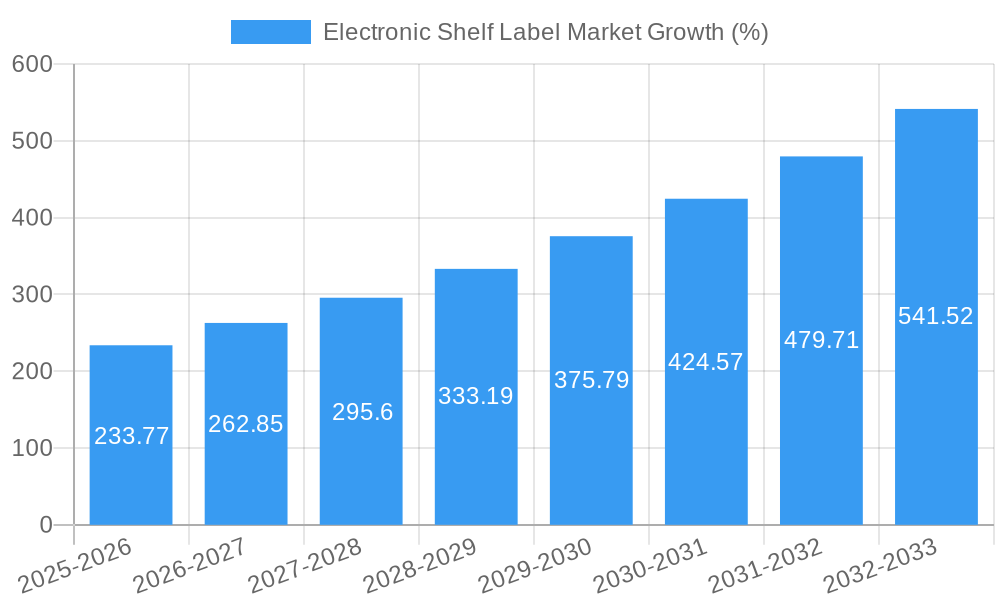
The Electronic Shelf Label (ESL) market is experiencing robust growth, projected to reach a value of $1.73 billion in 2025 and maintain a Compound Annual Growth Rate (CAGR) of 13.90% from 2025 to 2033. This expansion is driven by several key factors. Firstly, the increasing demand for efficient inventory management and optimized pricing strategies within the retail sector is a major catalyst. Retailers are adopting ESLs to reduce labor costs associated with manual price updates, improve operational efficiency, and enhance the overall customer experience through dynamic pricing and promotional campaigns. Secondly, technological advancements in ESL technology, such as the development of more energy-efficient E-paper displays and improved connectivity options, are fueling market growth. The shift towards digitalization within the retail landscape further strengthens this trend. Finally, the growing adoption of ESLs across various retail formats, including hypermarkets, supermarkets, specialty stores, and non-food retail stores, contributes significantly to market expansion. Competition among major players like Altierre Corporation, Pricer AB, Samsung Electro-Mechanics, and others is further driving innovation and market penetration.
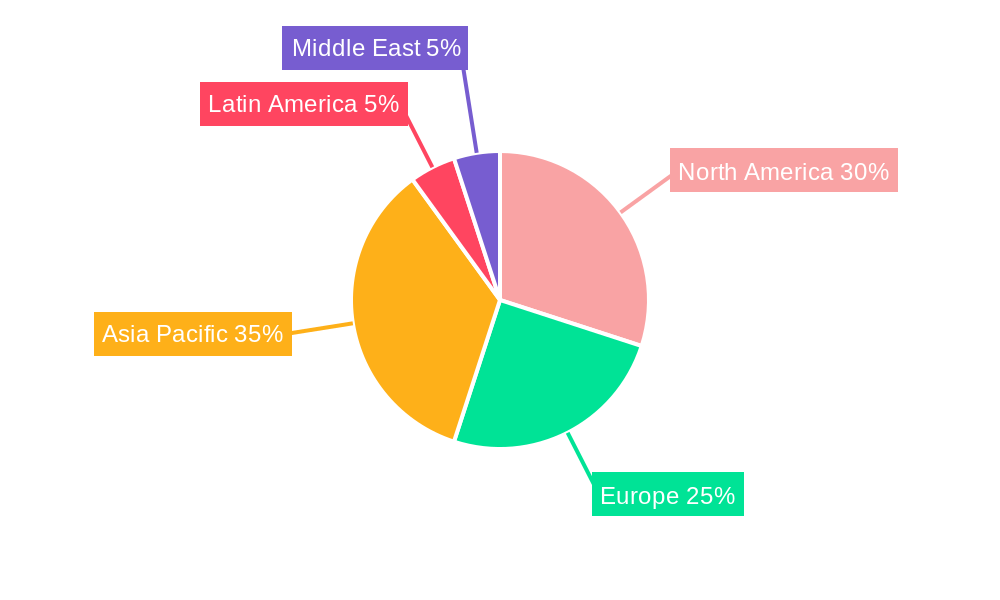
The segmentation of the ESL market by product type (LCD ESLs and E-paper ESLs) and store type reveals interesting dynamics. E-paper ESLs are expected to gain significant traction due to their low power consumption and superior readability, even in bright lighting conditions. Hypermarkets and supermarkets are currently the largest consumers of ESLs, but the adoption rate is rapidly increasing in specialty stores and non-food retail sectors, indicating substantial future growth potential. Geographical analysis suggests that the Asia Pacific region will likely dominate the market due to its large retail base and rapid technological adoption. However, North America and Europe will also contribute significantly to the overall market size, reflecting the ongoing digital transformation within these mature retail markets. The historical period (2019-2024) data is not directly provided, but extrapolating from the 2025 market size and CAGR, a significant growth trajectory is apparent.
Electronic Shelf Label Market: A Comprehensive Report (2019-2033)
This in-depth report provides a comprehensive analysis of the Electronic Shelf Label (ESL) market, covering market size, segmentation, growth drivers, challenges, and key players. The study period spans from 2019 to 2033, with 2025 serving as the base and estimated year. The report offers actionable insights for industry stakeholders, investors, and businesses seeking to navigate this dynamic market.
Electronic Shelf Label Market Concentration & Innovation
The Electronic Shelf Label market exhibits a moderately consolidated structure, with several key players holding significant market share. Market concentration is influenced by factors such as technological advancements, economies of scale, and the ability to offer integrated solutions. The market share held by the top five players is estimated to be around xx% in 2025, while smaller players account for the remaining market share. Innovation is a key driver, with ongoing development in display technologies (LCD and E-paper), connectivity options, and software integration. Regulatory frameworks governing data privacy and security are increasingly impacting market dynamics, influencing the design and functionality of ESL systems. Product substitutes such as traditional paper labels still compete for market share, but ESLs' advantages in dynamic pricing and real-time inventory management are gradually driving adoption. End-user trends, such as the increasing demand for enhanced customer experience and operational efficiency within retail settings, directly influence market growth. Mergers and acquisitions (M&A) activities, though not extremely frequent, play a role in shaping the market landscape. Recent M&A activity involving ESL companies has reached an estimated value of xx Million in the past five years. This activity is expected to increase slightly over the next few years.
- Market Share (2025): Top 5 players – xx%; Others – xx%
- M&A Deal Value (2019-2024): Estimated xx Million
- Key Innovation Drivers: Advanced display technologies, improved connectivity, sophisticated software integration, data analytics capabilities.
- Regulatory Influences: Data privacy regulations, cybersecurity standards.
Electronic Shelf Label Market Industry Trends & Insights
The Electronic Shelf Label market is experiencing robust growth, driven by the escalating adoption of digital technologies in the retail sector. The market is projected to witness a Compound Annual Growth Rate (CAGR) of xx% during the forecast period (2025-2033). Technological disruptions, particularly advancements in display technology and wireless communication protocols, contribute significantly to market expansion. Consumer preferences for enhanced shopping experiences and personalized offers fuel demand for dynamic pricing and promotional capabilities offered by ESLs. The market penetration of ESLs in various retail segments varies but is projected to increase from xx% in 2025 to xx% by 2033, driven by factors such as reduced labor costs and improved inventory management. The competitive dynamics within the ESL sector are intense, with leading players focusing on innovation, strategic partnerships, and geographic expansion to maintain their market position.
Dominant Markets & Segments in Electronic Shelf Label Market
The North American region currently holds the largest market share within the global ESL market, followed by Europe and Asia Pacific. Within these regions, hypermarkets and supermarkets are the dominant segments, followed by specialty stores and non-food retail stores. E-paper ESLs currently dominate the product segment due to their superior energy efficiency and longevity. However, LCD ESLs offer advantages in terms of image quality and dynamic content display capabilities. This is expected to drive increased LCD ESL adoption in the coming years.
Key Drivers for Regional Dominance:
- North America: High retail density, early adoption of technological advancements, robust infrastructure for technology integration.
- Europe: Growing focus on operational efficiency within retail, government initiatives promoting digitalization, strong presence of ESL vendors.
Key Drivers for Segment Dominance:
- Hypermarkets & Supermarkets: Large-scale deployments, significant cost savings through improved inventory management, high ROI potential.
- E-paper ESLs: Lower power consumption, longer lifespan, suitability for large-scale deployments.
Electronic Shelf Label Market Product Developments
Recent years have seen significant advancements in ESL technology, with a focus on improving energy efficiency, display quality, and connectivity options. The integration of advanced features such as dynamic pricing, targeted promotions, and real-time inventory tracking enhances the value proposition of ESLs for retailers. Technological trends, including the adoption of low-power wireless technologies and cloud-based software platforms, are shaping the future of the ESL market. This results in more efficient data management, remote control capabilities, and expanded functionalities, making ESLs increasingly attractive to various retail segments.
Report Scope & Segmentation Analysis
This report segments the Electronic Shelf Label market based on Product (LCD ESLs and E-paper ESLs) and Store Type (Hypermarkets, Supermarkets, Specialty Stores, and Non-food Retail Stores).
By Product:
- LCD ESLs: The LCD ESL segment is projected to experience a CAGR of xx% during the forecast period, driven by their ability to display high-quality images and dynamic content. The segment is characterized by intense competition among manufacturers, focusing on cost optimization and feature enhancement.
- E-paper ESLs: The E-paper ESL segment is anticipated to maintain significant market share due to its energy efficiency and long battery life. Competitive dynamics within this segment revolve around optimizing cost-effectiveness and enhancing the durability and lifespan of these labels.
By Store Type:
- Hypermarkets & Supermarkets: These segments represent the largest application areas for ESLs due to their substantial need for efficient inventory management and dynamic pricing strategies.
- Specialty Stores & Non-food Retail Stores: The adoption of ESLs in these segments is growing gradually as retailers seek to enhance the customer experience and improve operational efficiency.
Key Drivers of Electronic Shelf Label Market Growth
The growth of the Electronic Shelf Label market is fueled by several factors. Technological advancements in display technology and wireless connectivity are making ESLs more cost-effective and feature-rich. Rising labor costs and the increasing need for efficient inventory management further drive adoption. Government regulations promoting digitalization in the retail sector and the increasing consumer demand for personalized shopping experiences also contribute to market growth. The ability of ESLs to optimize dynamic pricing strategies and enhance overall operational efficiency within retail settings is a major contributing factor.
Challenges in the Electronic Shelf Label Market Sector
Despite the positive outlook, the Electronic Shelf Label market faces several challenges. High initial investment costs for deploying ESL systems can be a barrier to entry for smaller retailers. Supply chain disruptions and the dependence on specialized infrastructure for installation and maintenance can impact market growth. Intense competition among vendors also presents a challenge. Security and privacy issues surrounding the data collected and processed by ESL systems pose a further constraint on market growth. The total impact of these challenges is estimated to cause a xx% reduction in potential market growth during the forecast period.
Emerging Opportunities in Electronic Shelf Label Market
Several opportunities exist for growth within the Electronic Shelf Label market. The expansion into emerging markets with growing retail sectors presents significant potential. The development of integrated ESL systems that incorporate advanced features such as artificial intelligence (AI) and machine learning (ML) enhances capabilities and creates new avenues for market expansion. Increasing consumer demand for personalized and interactive shopping experiences drives innovation and provides further opportunities within the sector.
Leading Players in the Electronic Shelf Label Market Market
- Altierre Corporation
- Pricer AB
- Samsung Electro-Mechanics Co Ltd
- Displaydata Ltd
- AdvanTech Inc
- M2 Communication Inc
- SES-imagotag
- E ink Holdings Inc
- Wincor Nixdorf AG
- Diebold Nixdorf
- Panasonic Corporation
- LG Corporation
Key Developments in Electronic Shelf Label Market Industry
- September 2022: SES-imagotag launched VUSION OS (V:OS), a Retail IoT operating system, enabling real-time insights for retailers. This significantly enhances the capabilities of ESL systems and improves data-driven decision-making.
- May 2022: SOLUM launched Newton TOUCH, a complete LCD signage solution, providing a more dynamic and engaging retail experience. This improves customer engagement and boosts sales opportunities through visually compelling in-store promotions.
Strategic Outlook for Electronic Shelf Label Market Market
The Electronic Shelf Label market is poised for significant growth in the coming years, driven by technological advancements, increasing retail digitization, and the growing demand for enhanced shopping experiences. The market will witness increasing competition among vendors and consolidation through mergers and acquisitions. Focusing on innovation, cost optimization, and strategic partnerships will be crucial for players seeking success in this competitive landscape. The expansion into new markets and the development of innovative solutions tailored to specific retail segments will shape the future dynamics of the Electronic Shelf Label market.
Electronic Shelf Label Market Segmentation
-
1. Product
- 1.1. LCD ESLs
- 1.2. E-paper ESLs
-
2. Store Type
- 2.1. Hyper Markets
- 2.2. Super Markets
- 2.3. Specialty Stores and Non-food Retail Stores
Electronic Shelf Label Market Segmentation By Geography
- 1. North America
- 2. Europe
- 3. Asia Pacific
- 4. Latin America
- 5. Middle East and Africa
Electronic Shelf Label Market REPORT HIGHLIGHTS
| Aspects | Details |
|---|---|
| Study Period | 2019-2033 |
| Base Year | 2024 |
| Estimated Year | 2025 |
| Forecast Period | 2025-2033 |
| Historical Period | 2019-2024 |
| Growth Rate | CAGR of 13.90% from 2019-2033 |
| Segmentation |
|
Table of Contents
- 1. Introduction
- 1.1. Research Scope
- 1.2. Market Segmentation
- 1.3. Research Methodology
- 1.4. Definitions and Assumptions
- 2. Executive Summary
- 2.1. Introduction
- 3. Market Dynamics
- 3.1. Introduction
- 3.2. Market Drivers
- 3.2.1. NFC penetration in POS and Smartphones
- 3.3. Market Restrains
- 3.3.1. High Initial Investments
- 3.4. Market Trends
- 3.4.1. NFC Mobile Payment is expected to boost market growth
- 4. Market Factor Analysis
- 4.1. Porters Five Forces
- 4.2. Supply/Value Chain
- 4.3. PESTEL analysis
- 4.4. Market Entropy
- 4.5. Patent/Trademark Analysis
- 5. Global Electronic Shelf Label Market Analysis, Insights and Forecast, 2019-2031
- 5.1. Market Analysis, Insights and Forecast - by Product
- 5.1.1. LCD ESLs
- 5.1.2. E-paper ESLs
- 5.2. Market Analysis, Insights and Forecast - by Store Type
- 5.2.1. Hyper Markets
- 5.2.2. Super Markets
- 5.2.3. Specialty Stores and Non-food Retail Stores
- 5.3. Market Analysis, Insights and Forecast - by Region
- 5.3.1. North America
- 5.3.2. Europe
- 5.3.3. Asia Pacific
- 5.3.4. Latin America
- 5.3.5. Middle East and Africa
- 5.1. Market Analysis, Insights and Forecast - by Product
- 6. North America Electronic Shelf Label Market Analysis, Insights and Forecast, 2019-2031
- 6.1. Market Analysis, Insights and Forecast - by Product
- 6.1.1. LCD ESLs
- 6.1.2. E-paper ESLs
- 6.2. Market Analysis, Insights and Forecast - by Store Type
- 6.2.1. Hyper Markets
- 6.2.2. Super Markets
- 6.2.3. Specialty Stores and Non-food Retail Stores
- 6.1. Market Analysis, Insights and Forecast - by Product
- 7. Europe Electronic Shelf Label Market Analysis, Insights and Forecast, 2019-2031
- 7.1. Market Analysis, Insights and Forecast - by Product
- 7.1.1. LCD ESLs
- 7.1.2. E-paper ESLs
- 7.2. Market Analysis, Insights and Forecast - by Store Type
- 7.2.1. Hyper Markets
- 7.2.2. Super Markets
- 7.2.3. Specialty Stores and Non-food Retail Stores
- 7.1. Market Analysis, Insights and Forecast - by Product
- 8. Asia Pacific Electronic Shelf Label Market Analysis, Insights and Forecast, 2019-2031
- 8.1. Market Analysis, Insights and Forecast - by Product
- 8.1.1. LCD ESLs
- 8.1.2. E-paper ESLs
- 8.2. Market Analysis, Insights and Forecast - by Store Type
- 8.2.1. Hyper Markets
- 8.2.2. Super Markets
- 8.2.3. Specialty Stores and Non-food Retail Stores
- 8.1. Market Analysis, Insights and Forecast - by Product
- 9. Latin America Electronic Shelf Label Market Analysis, Insights and Forecast, 2019-2031
- 9.1. Market Analysis, Insights and Forecast - by Product
- 9.1.1. LCD ESLs
- 9.1.2. E-paper ESLs
- 9.2. Market Analysis, Insights and Forecast - by Store Type
- 9.2.1. Hyper Markets
- 9.2.2. Super Markets
- 9.2.3. Specialty Stores and Non-food Retail Stores
- 9.1. Market Analysis, Insights and Forecast - by Product
- 10. Middle East and Africa Electronic Shelf Label Market Analysis, Insights and Forecast, 2019-2031
- 10.1. Market Analysis, Insights and Forecast - by Product
- 10.1.1. LCD ESLs
- 10.1.2. E-paper ESLs
- 10.2. Market Analysis, Insights and Forecast - by Store Type
- 10.2.1. Hyper Markets
- 10.2.2. Super Markets
- 10.2.3. Specialty Stores and Non-food Retail Stores
- 10.1. Market Analysis, Insights and Forecast - by Product
- 11. North America Electronic Shelf Label Market Analysis, Insights and Forecast, 2019-2031
- 11.1. Market Analysis, Insights and Forecast - By Country/Sub-region
- 11.1.1.
- 12. Europe Electronic Shelf Label Market Analysis, Insights and Forecast, 2019-2031
- 12.1. Market Analysis, Insights and Forecast - By Country/Sub-region
- 12.1.1.
- 13. Asia Pacific Electronic Shelf Label Market Analysis, Insights and Forecast, 2019-2031
- 13.1. Market Analysis, Insights and Forecast - By Country/Sub-region
- 13.1.1.
- 14. Latin America Electronic Shelf Label Market Analysis, Insights and Forecast, 2019-2031
- 14.1. Market Analysis, Insights and Forecast - By Country/Sub-region
- 14.1.1.
- 15. Middle East Electronic Shelf Label Market Analysis, Insights and Forecast, 2019-2031
- 15.1. Market Analysis, Insights and Forecast - By Country/Sub-region
- 15.1.1.
- 16. Competitive Analysis
- 16.1. Global Market Share Analysis 2024
- 16.2. Company Profiles
- 16.2.1 Altierre Corporation
- 16.2.1.1. Overview
- 16.2.1.2. Products
- 16.2.1.3. SWOT Analysis
- 16.2.1.4. Recent Developments
- 16.2.1.5. Financials (Based on Availability)
- 16.2.2 Pricer AB
- 16.2.2.1. Overview
- 16.2.2.2. Products
- 16.2.2.3. SWOT Analysis
- 16.2.2.4. Recent Developments
- 16.2.2.5. Financials (Based on Availability)
- 16.2.3 Samsung Electro-Mechanics Co Ltd
- 16.2.3.1. Overview
- 16.2.3.2. Products
- 16.2.3.3. SWOT Analysis
- 16.2.3.4. Recent Developments
- 16.2.3.5. Financials (Based on Availability)
- 16.2.4 Displaydata Ltd
- 16.2.4.1. Overview
- 16.2.4.2. Products
- 16.2.4.3. SWOT Analysis
- 16.2.4.4. Recent Developments
- 16.2.4.5. Financials (Based on Availability)
- 16.2.5 AdvanTech Inc
- 16.2.5.1. Overview
- 16.2.5.2. Products
- 16.2.5.3. SWOT Analysis
- 16.2.5.4. Recent Developments
- 16.2.5.5. Financials (Based on Availability)
- 16.2.6 M2 Communication Inc
- 16.2.6.1. Overview
- 16.2.6.2. Products
- 16.2.6.3. SWOT Analysis
- 16.2.6.4. Recent Developments
- 16.2.6.5. Financials (Based on Availability)
- 16.2.7 SES-imagotag
- 16.2.7.1. Overview
- 16.2.7.2. Products
- 16.2.7.3. SWOT Analysis
- 16.2.7.4. Recent Developments
- 16.2.7.5. Financials (Based on Availability)
- 16.2.8 E ink Holdings Inc
- 16.2.8.1. Overview
- 16.2.8.2. Products
- 16.2.8.3. SWOT Analysis
- 16.2.8.4. Recent Developments
- 16.2.8.5. Financials (Based on Availability)
- 16.2.9 Wincor Nixdorf AG
- 16.2.9.1. Overview
- 16.2.9.2. Products
- 16.2.9.3. SWOT Analysis
- 16.2.9.4. Recent Developments
- 16.2.9.5. Financials (Based on Availability)
- 16.2.10 Diebold Nixdorf
- 16.2.10.1. Overview
- 16.2.10.2. Products
- 16.2.10.3. SWOT Analysis
- 16.2.10.4. Recent Developments
- 16.2.10.5. Financials (Based on Availability)
- 16.2.11 Panasonic Corporation
- 16.2.11.1. Overview
- 16.2.11.2. Products
- 16.2.11.3. SWOT Analysis
- 16.2.11.4. Recent Developments
- 16.2.11.5. Financials (Based on Availability)
- 16.2.12 LG Corporation
- 16.2.12.1. Overview
- 16.2.12.2. Products
- 16.2.12.3. SWOT Analysis
- 16.2.12.4. Recent Developments
- 16.2.12.5. Financials (Based on Availability)
- 16.2.1 Altierre Corporation
List of Figures
- Figure 1: Global Electronic Shelf Label Market Revenue Breakdown (Million, %) by Region 2024 & 2032
- Figure 2: North America Electronic Shelf Label Market Revenue (Million), by Country 2024 & 2032
- Figure 3: North America Electronic Shelf Label Market Revenue Share (%), by Country 2024 & 2032
- Figure 4: Europe Electronic Shelf Label Market Revenue (Million), by Country 2024 & 2032
- Figure 5: Europe Electronic Shelf Label Market Revenue Share (%), by Country 2024 & 2032
- Figure 6: Asia Pacific Electronic Shelf Label Market Revenue (Million), by Country 2024 & 2032
- Figure 7: Asia Pacific Electronic Shelf Label Market Revenue Share (%), by Country 2024 & 2032
- Figure 8: Latin America Electronic Shelf Label Market Revenue (Million), by Country 2024 & 2032
- Figure 9: Latin America Electronic Shelf Label Market Revenue Share (%), by Country 2024 & 2032
- Figure 10: Middle East Electronic Shelf Label Market Revenue (Million), by Country 2024 & 2032
- Figure 11: Middle East Electronic Shelf Label Market Revenue Share (%), by Country 2024 & 2032
- Figure 12: North America Electronic Shelf Label Market Revenue (Million), by Product 2024 & 2032
- Figure 13: North America Electronic Shelf Label Market Revenue Share (%), by Product 2024 & 2032
- Figure 14: North America Electronic Shelf Label Market Revenue (Million), by Store Type 2024 & 2032
- Figure 15: North America Electronic Shelf Label Market Revenue Share (%), by Store Type 2024 & 2032
- Figure 16: North America Electronic Shelf Label Market Revenue (Million), by Country 2024 & 2032
- Figure 17: North America Electronic Shelf Label Market Revenue Share (%), by Country 2024 & 2032
- Figure 18: Europe Electronic Shelf Label Market Revenue (Million), by Product 2024 & 2032
- Figure 19: Europe Electronic Shelf Label Market Revenue Share (%), by Product 2024 & 2032
- Figure 20: Europe Electronic Shelf Label Market Revenue (Million), by Store Type 2024 & 2032
- Figure 21: Europe Electronic Shelf Label Market Revenue Share (%), by Store Type 2024 & 2032
- Figure 22: Europe Electronic Shelf Label Market Revenue (Million), by Country 2024 & 2032
- Figure 23: Europe Electronic Shelf Label Market Revenue Share (%), by Country 2024 & 2032
- Figure 24: Asia Pacific Electronic Shelf Label Market Revenue (Million), by Product 2024 & 2032
- Figure 25: Asia Pacific Electronic Shelf Label Market Revenue Share (%), by Product 2024 & 2032
- Figure 26: Asia Pacific Electronic Shelf Label Market Revenue (Million), by Store Type 2024 & 2032
- Figure 27: Asia Pacific Electronic Shelf Label Market Revenue Share (%), by Store Type 2024 & 2032
- Figure 28: Asia Pacific Electronic Shelf Label Market Revenue (Million), by Country 2024 & 2032
- Figure 29: Asia Pacific Electronic Shelf Label Market Revenue Share (%), by Country 2024 & 2032
- Figure 30: Latin America Electronic Shelf Label Market Revenue (Million), by Product 2024 & 2032
- Figure 31: Latin America Electronic Shelf Label Market Revenue Share (%), by Product 2024 & 2032
- Figure 32: Latin America Electronic Shelf Label Market Revenue (Million), by Store Type 2024 & 2032
- Figure 33: Latin America Electronic Shelf Label Market Revenue Share (%), by Store Type 2024 & 2032
- Figure 34: Latin America Electronic Shelf Label Market Revenue (Million), by Country 2024 & 2032
- Figure 35: Latin America Electronic Shelf Label Market Revenue Share (%), by Country 2024 & 2032
- Figure 36: Middle East and Africa Electronic Shelf Label Market Revenue (Million), by Product 2024 & 2032
- Figure 37: Middle East and Africa Electronic Shelf Label Market Revenue Share (%), by Product 2024 & 2032
- Figure 38: Middle East and Africa Electronic Shelf Label Market Revenue (Million), by Store Type 2024 & 2032
- Figure 39: Middle East and Africa Electronic Shelf Label Market Revenue Share (%), by Store Type 2024 & 2032
- Figure 40: Middle East and Africa Electronic Shelf Label Market Revenue (Million), by Country 2024 & 2032
- Figure 41: Middle East and Africa Electronic Shelf Label Market Revenue Share (%), by Country 2024 & 2032
List of Tables
- Table 1: Global Electronic Shelf Label Market Revenue Million Forecast, by Region 2019 & 2032
- Table 2: Global Electronic Shelf Label Market Revenue Million Forecast, by Product 2019 & 2032
- Table 3: Global Electronic Shelf Label Market Revenue Million Forecast, by Store Type 2019 & 2032
- Table 4: Global Electronic Shelf Label Market Revenue Million Forecast, by Region 2019 & 2032
- Table 5: Global Electronic Shelf Label Market Revenue Million Forecast, by Country 2019 & 2032
- Table 6: Electronic Shelf Label Market Revenue (Million) Forecast, by Application 2019 & 2032
- Table 7: Global Electronic Shelf Label Market Revenue Million Forecast, by Country 2019 & 2032
- Table 8: Electronic Shelf Label Market Revenue (Million) Forecast, by Application 2019 & 2032
- Table 9: Global Electronic Shelf Label Market Revenue Million Forecast, by Country 2019 & 2032
- Table 10: Electronic Shelf Label Market Revenue (Million) Forecast, by Application 2019 & 2032
- Table 11: Global Electronic Shelf Label Market Revenue Million Forecast, by Country 2019 & 2032
- Table 12: Electronic Shelf Label Market Revenue (Million) Forecast, by Application 2019 & 2032
- Table 13: Global Electronic Shelf Label Market Revenue Million Forecast, by Country 2019 & 2032
- Table 14: Electronic Shelf Label Market Revenue (Million) Forecast, by Application 2019 & 2032
- Table 15: Global Electronic Shelf Label Market Revenue Million Forecast, by Product 2019 & 2032
- Table 16: Global Electronic Shelf Label Market Revenue Million Forecast, by Store Type 2019 & 2032
- Table 17: Global Electronic Shelf Label Market Revenue Million Forecast, by Country 2019 & 2032
- Table 18: Global Electronic Shelf Label Market Revenue Million Forecast, by Product 2019 & 2032
- Table 19: Global Electronic Shelf Label Market Revenue Million Forecast, by Store Type 2019 & 2032
- Table 20: Global Electronic Shelf Label Market Revenue Million Forecast, by Country 2019 & 2032
- Table 21: Global Electronic Shelf Label Market Revenue Million Forecast, by Product 2019 & 2032
- Table 22: Global Electronic Shelf Label Market Revenue Million Forecast, by Store Type 2019 & 2032
- Table 23: Global Electronic Shelf Label Market Revenue Million Forecast, by Country 2019 & 2032
- Table 24: Global Electronic Shelf Label Market Revenue Million Forecast, by Product 2019 & 2032
- Table 25: Global Electronic Shelf Label Market Revenue Million Forecast, by Store Type 2019 & 2032
- Table 26: Global Electronic Shelf Label Market Revenue Million Forecast, by Country 2019 & 2032
- Table 27: Global Electronic Shelf Label Market Revenue Million Forecast, by Product 2019 & 2032
- Table 28: Global Electronic Shelf Label Market Revenue Million Forecast, by Store Type 2019 & 2032
- Table 29: Global Electronic Shelf Label Market Revenue Million Forecast, by Country 2019 & 2032
Frequently Asked Questions
1. What is the projected Compound Annual Growth Rate (CAGR) of the Electronic Shelf Label Market?
The projected CAGR is approximately 13.90%.
2. Which companies are prominent players in the Electronic Shelf Label Market?
Key companies in the market include Altierre Corporation, Pricer AB, Samsung Electro-Mechanics Co Ltd, Displaydata Ltd, AdvanTech Inc, M2 Communication Inc, SES-imagotag, E ink Holdings Inc, Wincor Nixdorf AG, Diebold Nixdorf, Panasonic Corporation, LG Corporation.
3. What are the main segments of the Electronic Shelf Label Market?
The market segments include Product, Store Type.
4. Can you provide details about the market size?
The market size is estimated to be USD 1.73 Million as of 2022.
5. What are some drivers contributing to market growth?
NFC penetration in POS and Smartphones.
6. What are the notable trends driving market growth?
NFC Mobile Payment is expected to boost market growth.
7. Are there any restraints impacting market growth?
High Initial Investments.
8. Can you provide examples of recent developments in the market?
September 2022 - SES-imagotag, a leader in digital technologies for physical trade and electronic shelf labels, introduced VUSION OS (V:OS), a Retail IoT operating system. This allows retailers to take advantage of insights and information in real time.
9. What pricing options are available for accessing the report?
Pricing options include single-user, multi-user, and enterprise licenses priced at USD 4750, USD 5250, and USD 8750 respectively.
10. Is the market size provided in terms of value or volume?
The market size is provided in terms of value, measured in Million.
11. Are there any specific market keywords associated with the report?
Yes, the market keyword associated with the report is "Electronic Shelf Label Market," which aids in identifying and referencing the specific market segment covered.
12. How do I determine which pricing option suits my needs best?
The pricing options vary based on user requirements and access needs. Individual users may opt for single-user licenses, while businesses requiring broader access may choose multi-user or enterprise licenses for cost-effective access to the report.
13. Are there any additional resources or data provided in the Electronic Shelf Label Market report?
While the report offers comprehensive insights, it's advisable to review the specific contents or supplementary materials provided to ascertain if additional resources or data are available.
14. How can I stay updated on further developments or reports in the Electronic Shelf Label Market?
To stay informed about further developments, trends, and reports in the Electronic Shelf Label Market, consider subscribing to industry newsletters, following relevant companies and organizations, or regularly checking reputable industry news sources and publications.
Methodology
Step 1 - Identification of Relevant Samples Size from Population Database


Step 2 - Approaches for Defining Global Market Size (Value, Volume* & Price*)

Note*: In applicable scenarios
Step 3 - Data Sources
Primary Research
- Web Analytics
- Survey Reports
- Research Institute
- Latest Research Reports
- Opinion Leaders
Secondary Research
- Annual Reports
- White Paper
- Latest Press Release
- Industry Association
- Paid Database
- Investor Presentations

Step 4 - Data Triangulation
Involves using different sources of information in order to increase the validity of a study
These sources are likely to be stakeholders in a program - participants, other researchers, program staff, other community members, and so on.
Then we put all data in single framework & apply various statistical tools to find out the dynamic on the market.
During the analysis stage, feedback from the stakeholder groups would be compared to determine areas of agreement as well as areas of divergence


