
Key Insights
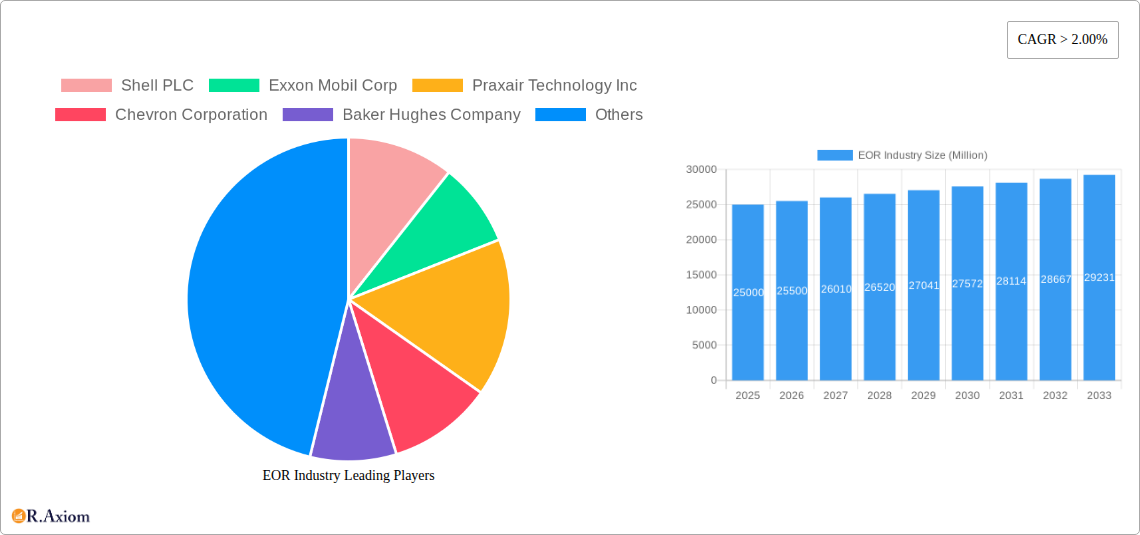
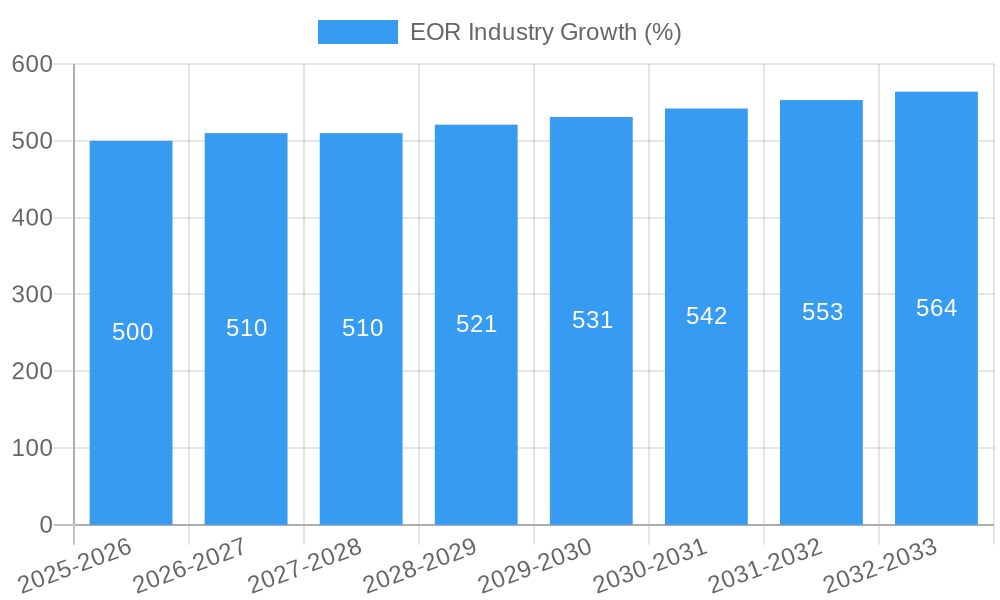
The Enhanced Oil Recovery (EOR) market is experiencing robust growth, driven by the increasing global demand for oil and gas, coupled with dwindling reserves from conventional sources. A CAGR exceeding 2% indicates a steadily expanding market, projected to reach significant value over the forecast period (2025-2033). Several factors contribute to this expansion. Firstly, technological advancements in gas, thermal, chemical, and microbial injection techniques are improving recovery rates and making EOR economically viable in previously challenging reservoirs. Secondly, the exploration of both onshore and offshore locations expands the addressable market and provides opportunities for diverse deployment strategies. Leading players like Shell, ExxonMobil, and Schlumberger are investing heavily in R&D and strategic acquisitions, further fueling market growth. However, challenges remain, including high upfront capital costs associated with EOR projects, fluctuating oil prices impacting project profitability, and environmental concerns regarding the potential impact of certain EOR methods.
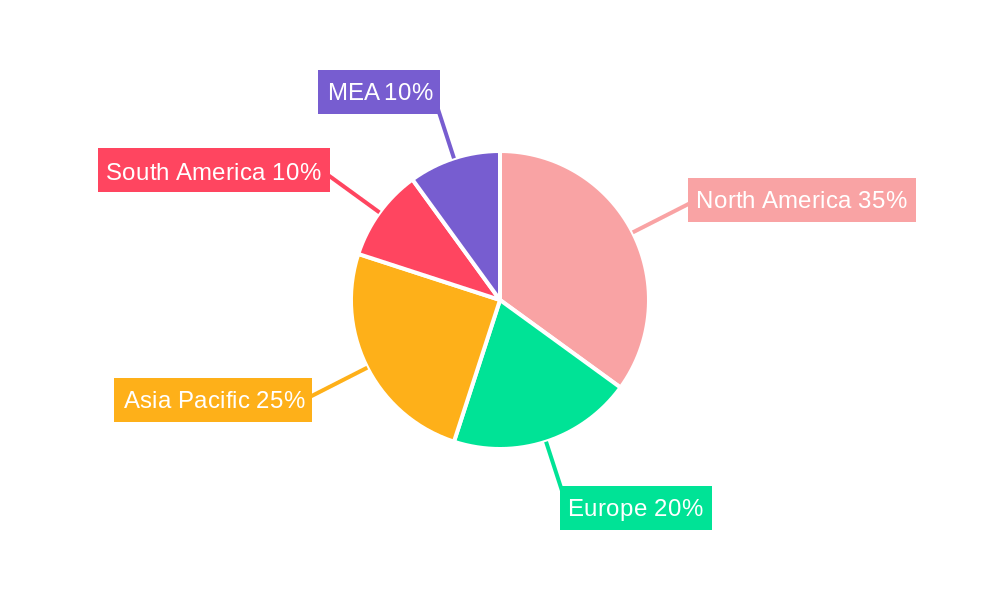
Despite these restraints, the long-term outlook for the EOR market remains positive. The growing focus on sustainable energy practices, while seemingly contradictory, also contributes to EOR's growth. As the world transitions to cleaner energy sources, there’s increasing emphasis on optimizing the extraction of existing fossil fuel reserves to reduce the environmental footprint per unit of energy produced. This translates to greater investment in EOR technologies that maximize recovery efficiency and minimize waste. Regional variations exist, with North America and the Middle East & Africa regions expected to dominate the market due to their substantial oil reserves and ongoing investment in EOR projects. The Asia-Pacific region is also poised for significant growth, driven by increasing energy demand and ongoing infrastructure development. The diverse geographical spread of investment ensures resilience against localized market fluctuations.
Enhanced Oil Recovery (EOR) Industry Market Report: 2019-2033
This comprehensive report provides a detailed analysis of the Enhanced Oil Recovery (EOR) industry, offering invaluable insights for stakeholders, investors, and industry professionals. With a focus on market trends, technological advancements, and competitive landscapes, this report covers the period from 2019 to 2033, including a detailed forecast from 2025 to 2033. The report projects a xx Million market value by 2025 and a CAGR of xx% from 2025 to 2033. The analysis encompasses key players like Shell PLC, Exxon Mobil Corp, Praxair Technology Inc, Chevron Corporation, Baker Hughes Company, TotalEnergies SE, Halliburton Company, Weatherford International PLC, BP PLC, and Schlumberger Limited, and examines various EOR technologies and deployment locations.
EOR Industry Market Concentration & Innovation
The EOR industry exhibits a moderately concentrated market structure, with a few major players holding significant market share. Shell PLC, ExxonMobil Corp, and Chevron Corporation collectively account for approximately xx% of the global market share in 2025 (estimated), reflecting their substantial investments in R&D and global operations. However, the market also presents opportunities for smaller, specialized companies focusing on niche technologies. The competitive landscape is further shaped by mergers and acquisitions (M&A) activities, with notable deals in recent years exceeding xx Million in value, driving consolidation and technological integration. Innovation within the EOR industry is primarily fueled by the need to enhance oil recovery rates from mature fields, rising oil prices and stringent environmental regulations. Regulatory frameworks, particularly concerning carbon emissions and waste management, significantly impact EOR technology adoption. The industry constantly seeks to improve efficiency and reduce environmental impact, with ongoing research into sustainable and cost-effective techniques like microbial injection. Product substitutes, such as shale gas and renewable energy sources, present some competitive pressure, but the sustained demand for oil ensures continued relevance for EOR technologies. End-user trends toward sustainable practices drive innovation towards cleaner and more efficient EOR methods.
- Market Share (2025, Estimated):
- Shell PLC: xx%
- ExxonMobil Corp: xx%
- Chevron Corporation: xx%
- Others: xx%
- M&A Deal Value (2019-2024): Over xx Million
- Key Innovation Drivers: Rising oil prices, stringent environmental regulations, need for enhanced recovery rates from mature fields.
EOR Industry Industry Trends & Insights
The EOR industry is experiencing significant growth driven by several factors. The increasing global demand for oil and gas, coupled with the depletion of easily accessible reserves, necessitates the adoption of advanced EOR techniques to maximize recovery from existing fields. Technological advancements in areas such as gas injection, chemical injection, and thermal injection are improving efficiency and reducing costs. A significant trend is the integration of digital technologies, including data analytics and artificial intelligence, to optimize EOR operations and enhance decision-making. The industry is also witnessing a growing emphasis on sustainability and environmental responsibility. Companies are actively exploring and implementing greener EOR methods to minimize their environmental footprint. Competitive dynamics are characterized by a combination of intense competition among major players and the emergence of innovative start-ups offering specialized EOR solutions. This dynamic market landscape is driving innovation and pushing the boundaries of EOR technology. The global market is projected to reach xx Million by 2033, exhibiting a strong growth trajectory.
- Market Growth Drivers: Increasing oil demand, depletion of conventional reserves, technological advancements, focus on sustainability.
- CAGR (2025-2033, Estimated): xx%
- Market Penetration (2025, Estimated): xx%
Dominant Markets & Segments in EOR Industry
The Middle East and North America currently represent the dominant regions for EOR deployment, driven by substantial oil reserves and robust infrastructure. Within these regions, specific countries like Saudi Arabia and the United States exhibit high levels of activity. Among EOR technologies, chemical injection currently holds the largest market share due to its established efficacy and relative maturity. However, the gas injection segment is rapidly growing, driven by its cost-effectiveness and environmental benefits. Offshore EOR presents unique challenges but also substantial opportunities, with increasing investments in advanced technologies and infrastructure to support offshore operations.
- Leading Region: Middle East
- Leading Country: Saudi Arabia
- Dominant Technology Segment: Chemical Injection
- Key Drivers for Middle East Dominance: Extensive oil reserves, substantial government investment, established infrastructure.
- Key Drivers for Chemical Injection Dominance: Established efficacy, relatively mature technology, wide-spread applicability.
- Key Drivers for Offshore EOR Growth: Potential access to vast reserves, technological advancements.
EOR Industry Product Developments
Recent product innovations focus on enhancing the efficiency and sustainability of EOR processes. This includes advancements in chemical formulations for improved oil displacement, novel gas injection techniques for maximizing sweep efficiency, and the development of environmentally friendly microbial EOR methods. These advancements directly address market needs for cost-effective and environmentally responsible solutions, improving the overall market fit and competitive advantage for companies integrating these technologies.
Report Scope & Segmentation Analysis
This report segments the EOR industry based on technology (Gas Injection, Thermal Injection, Chemical Injection, Microbial Injection, Other Technologies) and location of deployment (Onshore, Offshore). Each segment is analyzed comprehensively, providing growth projections, market size estimations, and competitive dynamics. The Gas Injection segment is poised for significant growth driven by increasing operational efficiency and cost-effectiveness, while the Offshore segment offers unique growth opportunities in the years to come. Market size varies significantly per technology and deployment location.
- Gas Injection: Expected to grow at a CAGR of xx% from 2025-2033.
- Thermal Injection: Projected to reach xx Million by 2033.
- Chemical Injection: Currently dominant, with consistent growth forecasted.
- Microbial Injection: Demonstrates high growth potential due to sustainable nature.
- Onshore: Represents the largest market segment currently.
- Offshore: Growing rapidly, particularly in deepwater applications.
Key Drivers of EOR Industry Growth
Several key factors contribute to the growth of the EOR industry. Firstly, the ever-increasing global demand for oil and gas fuels the necessity for maximizing oil recovery from existing reserves. Technological advancements, particularly in the areas of chemical and gas injection, are enhancing recovery rates and lowering operational costs. Additionally, government policies and incentives supporting EOR projects provide further impetus for growth. For example, tax breaks or subsidies for sustainable EOR technology implementation are boosting this segment of the industry. Lastly, the rising price of crude oil makes EOR projects financially more viable.
Challenges in the EOR Industry Sector
The EOR industry faces several challenges, including the high upfront capital investment required for projects, the complexity of implementing EOR techniques in diverse geological settings, and environmental concerns related to certain EOR methods. Fluctuations in oil prices can affect the economic viability of EOR projects, introducing uncertainty. Supply chain disruptions can also impact the availability of necessary equipment and chemicals, potentially delaying or impacting project timelines and budget. Stringent environmental regulations also add another layer of complexity and cost to EOR operations. These challenges are impacting profitability and market growth.
Emerging Opportunities in EOR Industry
The EOR industry is witnessing emerging opportunities fueled by advancements in several key areas. The integration of digital technologies, including artificial intelligence (AI) and machine learning (ML), offers improved efficiency and cost optimization. Sustainable EOR methods, such as microbial injection, are gaining traction due to their environmental benefits. Furthermore, exploration of unconventional resources, such as heavy oil and oil sands, presents opportunities for EOR technologies. Expansion into new geographical regions with significant untapped reserves also signifies promising growth areas for the industry.
Leading Players in the EOR Industry Market
- Shell PLC
- Exxon Mobil Corp
- Praxair Technology Inc
- Chevron Corporation
- Baker Hughes Company
- TotalEnergies SE
- Halliburton Company
- Weatherford International PLC
- BP PLC
- Schlumberger Limited
Key Developments in EOR Industry Industry
- July 2021: Sinopec launched China's largest CCUS project, reinjecting CO2 for enhanced oil recovery. This significantly impacts the market by showcasing the potential of CCUS in EOR.
- August 2021: J-Power and Schlumberger planned a joint study on CO2-free hydrogen production using coal gasification, with CO2 utilized for EOR. This development highlights the growing interest in carbon-neutral EOR solutions.
- October 2021: Gazprom Neft and Tatarstan signed an agreement to cooperate on EOR technology development and project implementation. This demonstrates a collaborative approach to advancing EOR technologies.
- October 2021: LUKOIL and Gazprom Neft agreed to cooperate on enhancing chemical EOR methods. This focuses on refining existing methods to enhance efficiency and profitability.
Strategic Outlook for EOR Industry Market
The future of the EOR industry looks bright, driven by continued technological advancements, increasing oil demand, and growing focus on sustainability. New technologies and innovative solutions will continue to emerge, offering improved efficiency, reduced costs, and minimal environmental impact. The industry will see increased collaboration among players, leading to enhanced technological breakthroughs and wider adoption of EOR techniques. The market is expected to witness significant growth in the coming years, with several companies positioning themselves to capitalize on emerging opportunities.
EOR Industry Segmentation
-
1. Technology
- 1.1. Gas Injection
- 1.2. Thermal Injection
- 1.3. Chemical Injection
- 1.4. Microbial Injection
- 1.5. Other Technologies
-
2. Location of Deployment
- 2.1. Onshore
- 2.2. Offshore
EOR Industry Segmentation By Geography
- 1. North America
- 2. Europe
- 3. Asia Pacific
- 4. South America
- 5. Middle East
EOR Industry REPORT HIGHLIGHTS
| Aspects | Details |
|---|---|
| Study Period | 2019-2033 |
| Base Year | 2024 |
| Estimated Year | 2025 |
| Forecast Period | 2025-2033 |
| Historical Period | 2019-2024 |
| Growth Rate | CAGR of > 2.00% from 2019-2033 |
| Segmentation |
|
Table of Contents
- 1. Introduction
- 1.1. Research Scope
- 1.2. Market Segmentation
- 1.3. Research Methodology
- 1.4. Definitions and Assumptions
- 2. Executive Summary
- 2.1. Introduction
- 3. Market Dynamics
- 3.1. Introduction
- 3.2. Market Drivers
- 3.2.1. 4.; Rapid Recovery in the Oil and Gas and Mining Industries4.; Surge in the Construction Industry
- 3.3. Market Restrains
- 3.3.1. 4.; High Maintenance and Operation Costs of Submersible Pump Restrain the Market
- 3.4. Market Trends
- 3.4.1. Gas Injection Technique to Dominate the Market
- 4. Market Factor Analysis
- 4.1. Porters Five Forces
- 4.2. Supply/Value Chain
- 4.3. PESTEL analysis
- 4.4. Market Entropy
- 4.5. Patent/Trademark Analysis
- 5. Global EOR Industry Analysis, Insights and Forecast, 2019-2031
- 5.1. Market Analysis, Insights and Forecast - by Technology
- 5.1.1. Gas Injection
- 5.1.2. Thermal Injection
- 5.1.3. Chemical Injection
- 5.1.4. Microbial Injection
- 5.1.5. Other Technologies
- 5.2. Market Analysis, Insights and Forecast - by Location of Deployment
- 5.2.1. Onshore
- 5.2.2. Offshore
- 5.3. Market Analysis, Insights and Forecast - by Region
- 5.3.1. North America
- 5.3.2. Europe
- 5.3.3. Asia Pacific
- 5.3.4. South America
- 5.3.5. Middle East
- 5.1. Market Analysis, Insights and Forecast - by Technology
- 6. North America EOR Industry Analysis, Insights and Forecast, 2019-2031
- 6.1. Market Analysis, Insights and Forecast - by Technology
- 6.1.1. Gas Injection
- 6.1.2. Thermal Injection
- 6.1.3. Chemical Injection
- 6.1.4. Microbial Injection
- 6.1.5. Other Technologies
- 6.2. Market Analysis, Insights and Forecast - by Location of Deployment
- 6.2.1. Onshore
- 6.2.2. Offshore
- 6.1. Market Analysis, Insights and Forecast - by Technology
- 7. Europe EOR Industry Analysis, Insights and Forecast, 2019-2031
- 7.1. Market Analysis, Insights and Forecast - by Technology
- 7.1.1. Gas Injection
- 7.1.2. Thermal Injection
- 7.1.3. Chemical Injection
- 7.1.4. Microbial Injection
- 7.1.5. Other Technologies
- 7.2. Market Analysis, Insights and Forecast - by Location of Deployment
- 7.2.1. Onshore
- 7.2.2. Offshore
- 7.1. Market Analysis, Insights and Forecast - by Technology
- 8. Asia Pacific EOR Industry Analysis, Insights and Forecast, 2019-2031
- 8.1. Market Analysis, Insights and Forecast - by Technology
- 8.1.1. Gas Injection
- 8.1.2. Thermal Injection
- 8.1.3. Chemical Injection
- 8.1.4. Microbial Injection
- 8.1.5. Other Technologies
- 8.2. Market Analysis, Insights and Forecast - by Location of Deployment
- 8.2.1. Onshore
- 8.2.2. Offshore
- 8.1. Market Analysis, Insights and Forecast - by Technology
- 9. South America EOR Industry Analysis, Insights and Forecast, 2019-2031
- 9.1. Market Analysis, Insights and Forecast - by Technology
- 9.1.1. Gas Injection
- 9.1.2. Thermal Injection
- 9.1.3. Chemical Injection
- 9.1.4. Microbial Injection
- 9.1.5. Other Technologies
- 9.2. Market Analysis, Insights and Forecast - by Location of Deployment
- 9.2.1. Onshore
- 9.2.2. Offshore
- 9.1. Market Analysis, Insights and Forecast - by Technology
- 10. Middle East EOR Industry Analysis, Insights and Forecast, 2019-2031
- 10.1. Market Analysis, Insights and Forecast - by Technology
- 10.1.1. Gas Injection
- 10.1.2. Thermal Injection
- 10.1.3. Chemical Injection
- 10.1.4. Microbial Injection
- 10.1.5. Other Technologies
- 10.2. Market Analysis, Insights and Forecast - by Location of Deployment
- 10.2.1. Onshore
- 10.2.2. Offshore
- 10.1. Market Analysis, Insights and Forecast - by Technology
- 11. North America EOR Industry Analysis, Insights and Forecast, 2019-2031
- 11.1. Market Analysis, Insights and Forecast - By Country/Sub-region
- 11.1.1 United States
- 11.1.2 Canada
- 11.1.3 Mexico
- 12. Europe EOR Industry Analysis, Insights and Forecast, 2019-2031
- 12.1. Market Analysis, Insights and Forecast - By Country/Sub-region
- 12.1.1 Germany
- 12.1.2 United Kingdom
- 12.1.3 France
- 12.1.4 Spain
- 12.1.5 Italy
- 12.1.6 Spain
- 12.1.7 Belgium
- 12.1.8 Netherland
- 12.1.9 Nordics
- 12.1.10 Rest of Europe
- 13. Asia Pacific EOR Industry Analysis, Insights and Forecast, 2019-2031
- 13.1. Market Analysis, Insights and Forecast - By Country/Sub-region
- 13.1.1 China
- 13.1.2 Japan
- 13.1.3 India
- 13.1.4 South Korea
- 13.1.5 Southeast Asia
- 13.1.6 Australia
- 13.1.7 Indonesia
- 13.1.8 Phillipes
- 13.1.9 Singapore
- 13.1.10 Thailandc
- 13.1.11 Rest of Asia Pacific
- 14. South America EOR Industry Analysis, Insights and Forecast, 2019-2031
- 14.1. Market Analysis, Insights and Forecast - By Country/Sub-region
- 14.1.1 Brazil
- 14.1.2 Argentina
- 14.1.3 Peru
- 14.1.4 Chile
- 14.1.5 Colombia
- 14.1.6 Ecuador
- 14.1.7 Venezuela
- 14.1.8 Rest of South America
- 15. North America EOR Industry Analysis, Insights and Forecast, 2019-2031
- 15.1. Market Analysis, Insights and Forecast - By Country/Sub-region
- 15.1.1 United States
- 15.1.2 Canada
- 15.1.3 Mexico
- 16. MEA EOR Industry Analysis, Insights and Forecast, 2019-2031
- 16.1. Market Analysis, Insights and Forecast - By Country/Sub-region
- 16.1.1 United Arab Emirates
- 16.1.2 Saudi Arabia
- 16.1.3 South Africa
- 16.1.4 Rest of Middle East and Africa
- 17. Competitive Analysis
- 17.1. Global Market Share Analysis 2024
- 17.2. Company Profiles
- 17.2.1 Shell PLC
- 17.2.1.1. Overview
- 17.2.1.2. Products
- 17.2.1.3. SWOT Analysis
- 17.2.1.4. Recent Developments
- 17.2.1.5. Financials (Based on Availability)
- 17.2.2 Exxon Mobil Corp
- 17.2.2.1. Overview
- 17.2.2.2. Products
- 17.2.2.3. SWOT Analysis
- 17.2.2.4. Recent Developments
- 17.2.2.5. Financials (Based on Availability)
- 17.2.3 Praxair Technology Inc
- 17.2.3.1. Overview
- 17.2.3.2. Products
- 17.2.3.3. SWOT Analysis
- 17.2.3.4. Recent Developments
- 17.2.3.5. Financials (Based on Availability)
- 17.2.4 Chevron Corporation
- 17.2.4.1. Overview
- 17.2.4.2. Products
- 17.2.4.3. SWOT Analysis
- 17.2.4.4. Recent Developments
- 17.2.4.5. Financials (Based on Availability)
- 17.2.5 Baker Hughes Company
- 17.2.5.1. Overview
- 17.2.5.2. Products
- 17.2.5.3. SWOT Analysis
- 17.2.5.4. Recent Developments
- 17.2.5.5. Financials (Based on Availability)
- 17.2.6 TotalEnergies SE
- 17.2.6.1. Overview
- 17.2.6.2. Products
- 17.2.6.3. SWOT Analysis
- 17.2.6.4. Recent Developments
- 17.2.6.5. Financials (Based on Availability)
- 17.2.7 Halliburton Company
- 17.2.7.1. Overview
- 17.2.7.2. Products
- 17.2.7.3. SWOT Analysis
- 17.2.7.4. Recent Developments
- 17.2.7.5. Financials (Based on Availability)
- 17.2.8 Weatherford International PLC*List Not Exhaustive
- 17.2.8.1. Overview
- 17.2.8.2. Products
- 17.2.8.3. SWOT Analysis
- 17.2.8.4. Recent Developments
- 17.2.8.5. Financials (Based on Availability)
- 17.2.9 BP PLC
- 17.2.9.1. Overview
- 17.2.9.2. Products
- 17.2.9.3. SWOT Analysis
- 17.2.9.4. Recent Developments
- 17.2.9.5. Financials (Based on Availability)
- 17.2.10 Schlumberger Limited
- 17.2.10.1. Overview
- 17.2.10.2. Products
- 17.2.10.3. SWOT Analysis
- 17.2.10.4. Recent Developments
- 17.2.10.5. Financials (Based on Availability)
- 17.2.1 Shell PLC
List of Figures
- Figure 1: Global EOR Industry Revenue Breakdown (Million, %) by Region 2024 & 2032
- Figure 2: North America EOR Industry Revenue (Million), by Country 2024 & 2032
- Figure 3: North America EOR Industry Revenue Share (%), by Country 2024 & 2032
- Figure 4: Europe EOR Industry Revenue (Million), by Country 2024 & 2032
- Figure 5: Europe EOR Industry Revenue Share (%), by Country 2024 & 2032
- Figure 6: Asia Pacific EOR Industry Revenue (Million), by Country 2024 & 2032
- Figure 7: Asia Pacific EOR Industry Revenue Share (%), by Country 2024 & 2032
- Figure 8: South America EOR Industry Revenue (Million), by Country 2024 & 2032
- Figure 9: South America EOR Industry Revenue Share (%), by Country 2024 & 2032
- Figure 10: North America EOR Industry Revenue (Million), by Country 2024 & 2032
- Figure 11: North America EOR Industry Revenue Share (%), by Country 2024 & 2032
- Figure 12: MEA EOR Industry Revenue (Million), by Country 2024 & 2032
- Figure 13: MEA EOR Industry Revenue Share (%), by Country 2024 & 2032
- Figure 14: North America EOR Industry Revenue (Million), by Technology 2024 & 2032
- Figure 15: North America EOR Industry Revenue Share (%), by Technology 2024 & 2032
- Figure 16: North America EOR Industry Revenue (Million), by Location of Deployment 2024 & 2032
- Figure 17: North America EOR Industry Revenue Share (%), by Location of Deployment 2024 & 2032
- Figure 18: North America EOR Industry Revenue (Million), by Country 2024 & 2032
- Figure 19: North America EOR Industry Revenue Share (%), by Country 2024 & 2032
- Figure 20: Europe EOR Industry Revenue (Million), by Technology 2024 & 2032
- Figure 21: Europe EOR Industry Revenue Share (%), by Technology 2024 & 2032
- Figure 22: Europe EOR Industry Revenue (Million), by Location of Deployment 2024 & 2032
- Figure 23: Europe EOR Industry Revenue Share (%), by Location of Deployment 2024 & 2032
- Figure 24: Europe EOR Industry Revenue (Million), by Country 2024 & 2032
- Figure 25: Europe EOR Industry Revenue Share (%), by Country 2024 & 2032
- Figure 26: Asia Pacific EOR Industry Revenue (Million), by Technology 2024 & 2032
- Figure 27: Asia Pacific EOR Industry Revenue Share (%), by Technology 2024 & 2032
- Figure 28: Asia Pacific EOR Industry Revenue (Million), by Location of Deployment 2024 & 2032
- Figure 29: Asia Pacific EOR Industry Revenue Share (%), by Location of Deployment 2024 & 2032
- Figure 30: Asia Pacific EOR Industry Revenue (Million), by Country 2024 & 2032
- Figure 31: Asia Pacific EOR Industry Revenue Share (%), by Country 2024 & 2032
- Figure 32: South America EOR Industry Revenue (Million), by Technology 2024 & 2032
- Figure 33: South America EOR Industry Revenue Share (%), by Technology 2024 & 2032
- Figure 34: South America EOR Industry Revenue (Million), by Location of Deployment 2024 & 2032
- Figure 35: South America EOR Industry Revenue Share (%), by Location of Deployment 2024 & 2032
- Figure 36: South America EOR Industry Revenue (Million), by Country 2024 & 2032
- Figure 37: South America EOR Industry Revenue Share (%), by Country 2024 & 2032
- Figure 38: Middle East EOR Industry Revenue (Million), by Technology 2024 & 2032
- Figure 39: Middle East EOR Industry Revenue Share (%), by Technology 2024 & 2032
- Figure 40: Middle East EOR Industry Revenue (Million), by Location of Deployment 2024 & 2032
- Figure 41: Middle East EOR Industry Revenue Share (%), by Location of Deployment 2024 & 2032
- Figure 42: Middle East EOR Industry Revenue (Million), by Country 2024 & 2032
- Figure 43: Middle East EOR Industry Revenue Share (%), by Country 2024 & 2032
List of Tables
- Table 1: Global EOR Industry Revenue Million Forecast, by Region 2019 & 2032
- Table 2: Global EOR Industry Revenue Million Forecast, by Technology 2019 & 2032
- Table 3: Global EOR Industry Revenue Million Forecast, by Location of Deployment 2019 & 2032
- Table 4: Global EOR Industry Revenue Million Forecast, by Region 2019 & 2032
- Table 5: Global EOR Industry Revenue Million Forecast, by Country 2019 & 2032
- Table 6: United States EOR Industry Revenue (Million) Forecast, by Application 2019 & 2032
- Table 7: Canada EOR Industry Revenue (Million) Forecast, by Application 2019 & 2032
- Table 8: Mexico EOR Industry Revenue (Million) Forecast, by Application 2019 & 2032
- Table 9: Global EOR Industry Revenue Million Forecast, by Country 2019 & 2032
- Table 10: Germany EOR Industry Revenue (Million) Forecast, by Application 2019 & 2032
- Table 11: United Kingdom EOR Industry Revenue (Million) Forecast, by Application 2019 & 2032
- Table 12: France EOR Industry Revenue (Million) Forecast, by Application 2019 & 2032
- Table 13: Spain EOR Industry Revenue (Million) Forecast, by Application 2019 & 2032
- Table 14: Italy EOR Industry Revenue (Million) Forecast, by Application 2019 & 2032
- Table 15: Spain EOR Industry Revenue (Million) Forecast, by Application 2019 & 2032
- Table 16: Belgium EOR Industry Revenue (Million) Forecast, by Application 2019 & 2032
- Table 17: Netherland EOR Industry Revenue (Million) Forecast, by Application 2019 & 2032
- Table 18: Nordics EOR Industry Revenue (Million) Forecast, by Application 2019 & 2032
- Table 19: Rest of Europe EOR Industry Revenue (Million) Forecast, by Application 2019 & 2032
- Table 20: Global EOR Industry Revenue Million Forecast, by Country 2019 & 2032
- Table 21: China EOR Industry Revenue (Million) Forecast, by Application 2019 & 2032
- Table 22: Japan EOR Industry Revenue (Million) Forecast, by Application 2019 & 2032
- Table 23: India EOR Industry Revenue (Million) Forecast, by Application 2019 & 2032
- Table 24: South Korea EOR Industry Revenue (Million) Forecast, by Application 2019 & 2032
- Table 25: Southeast Asia EOR Industry Revenue (Million) Forecast, by Application 2019 & 2032
- Table 26: Australia EOR Industry Revenue (Million) Forecast, by Application 2019 & 2032
- Table 27: Indonesia EOR Industry Revenue (Million) Forecast, by Application 2019 & 2032
- Table 28: Phillipes EOR Industry Revenue (Million) Forecast, by Application 2019 & 2032
- Table 29: Singapore EOR Industry Revenue (Million) Forecast, by Application 2019 & 2032
- Table 30: Thailandc EOR Industry Revenue (Million) Forecast, by Application 2019 & 2032
- Table 31: Rest of Asia Pacific EOR Industry Revenue (Million) Forecast, by Application 2019 & 2032
- Table 32: Global EOR Industry Revenue Million Forecast, by Country 2019 & 2032
- Table 33: Brazil EOR Industry Revenue (Million) Forecast, by Application 2019 & 2032
- Table 34: Argentina EOR Industry Revenue (Million) Forecast, by Application 2019 & 2032
- Table 35: Peru EOR Industry Revenue (Million) Forecast, by Application 2019 & 2032
- Table 36: Chile EOR Industry Revenue (Million) Forecast, by Application 2019 & 2032
- Table 37: Colombia EOR Industry Revenue (Million) Forecast, by Application 2019 & 2032
- Table 38: Ecuador EOR Industry Revenue (Million) Forecast, by Application 2019 & 2032
- Table 39: Venezuela EOR Industry Revenue (Million) Forecast, by Application 2019 & 2032
- Table 40: Rest of South America EOR Industry Revenue (Million) Forecast, by Application 2019 & 2032
- Table 41: Global EOR Industry Revenue Million Forecast, by Country 2019 & 2032
- Table 42: United States EOR Industry Revenue (Million) Forecast, by Application 2019 & 2032
- Table 43: Canada EOR Industry Revenue (Million) Forecast, by Application 2019 & 2032
- Table 44: Mexico EOR Industry Revenue (Million) Forecast, by Application 2019 & 2032
- Table 45: Global EOR Industry Revenue Million Forecast, by Country 2019 & 2032
- Table 46: United Arab Emirates EOR Industry Revenue (Million) Forecast, by Application 2019 & 2032
- Table 47: Saudi Arabia EOR Industry Revenue (Million) Forecast, by Application 2019 & 2032
- Table 48: South Africa EOR Industry Revenue (Million) Forecast, by Application 2019 & 2032
- Table 49: Rest of Middle East and Africa EOR Industry Revenue (Million) Forecast, by Application 2019 & 2032
- Table 50: Global EOR Industry Revenue Million Forecast, by Technology 2019 & 2032
- Table 51: Global EOR Industry Revenue Million Forecast, by Location of Deployment 2019 & 2032
- Table 52: Global EOR Industry Revenue Million Forecast, by Country 2019 & 2032
- Table 53: Global EOR Industry Revenue Million Forecast, by Technology 2019 & 2032
- Table 54: Global EOR Industry Revenue Million Forecast, by Location of Deployment 2019 & 2032
- Table 55: Global EOR Industry Revenue Million Forecast, by Country 2019 & 2032
- Table 56: Global EOR Industry Revenue Million Forecast, by Technology 2019 & 2032
- Table 57: Global EOR Industry Revenue Million Forecast, by Location of Deployment 2019 & 2032
- Table 58: Global EOR Industry Revenue Million Forecast, by Country 2019 & 2032
- Table 59: Global EOR Industry Revenue Million Forecast, by Technology 2019 & 2032
- Table 60: Global EOR Industry Revenue Million Forecast, by Location of Deployment 2019 & 2032
- Table 61: Global EOR Industry Revenue Million Forecast, by Country 2019 & 2032
- Table 62: Global EOR Industry Revenue Million Forecast, by Technology 2019 & 2032
- Table 63: Global EOR Industry Revenue Million Forecast, by Location of Deployment 2019 & 2032
- Table 64: Global EOR Industry Revenue Million Forecast, by Country 2019 & 2032
Frequently Asked Questions
1. What is the projected Compound Annual Growth Rate (CAGR) of the EOR Industry?
The projected CAGR is approximately > 2.00%.
2. Which companies are prominent players in the EOR Industry?
Key companies in the market include Shell PLC, Exxon Mobil Corp, Praxair Technology Inc, Chevron Corporation, Baker Hughes Company, TotalEnergies SE, Halliburton Company, Weatherford International PLC*List Not Exhaustive, BP PLC, Schlumberger Limited.
3. What are the main segments of the EOR Industry?
The market segments include Technology, Location of Deployment.
4. Can you provide details about the market size?
The market size is estimated to be USD XX Million as of 2022.
5. What are some drivers contributing to market growth?
4.; Rapid Recovery in the Oil and Gas and Mining Industries4.; Surge in the Construction Industry.
6. What are the notable trends driving market growth?
Gas Injection Technique to Dominate the Market.
7. Are there any restraints impacting market growth?
4.; High Maintenance and Operation Costs of Submersible Pump Restrain the Market.
8. Can you provide examples of recent developments in the market?
In July 2021, Sinopec launched China's largest carbon capture, storage, and utilization (CCUS) project. The scheme involves sending carbon dioxide captured at a petrochemical refinery to the Shengli oilfield, where it will be reinjected as part of the field's enhanced oil recovery program.
9. What pricing options are available for accessing the report?
Pricing options include single-user, multi-user, and enterprise licenses priced at USD 4750, USD 5250, and USD 8750 respectively.
10. Is the market size provided in terms of value or volume?
The market size is provided in terms of value, measured in Million.
11. Are there any specific market keywords associated with the report?
Yes, the market keyword associated with the report is "EOR Industry," which aids in identifying and referencing the specific market segment covered.
12. How do I determine which pricing option suits my needs best?
The pricing options vary based on user requirements and access needs. Individual users may opt for single-user licenses, while businesses requiring broader access may choose multi-user or enterprise licenses for cost-effective access to the report.
13. Are there any additional resources or data provided in the EOR Industry report?
While the report offers comprehensive insights, it's advisable to review the specific contents or supplementary materials provided to ascertain if additional resources or data are available.
14. How can I stay updated on further developments or reports in the EOR Industry?
To stay informed about further developments, trends, and reports in the EOR Industry, consider subscribing to industry newsletters, following relevant companies and organizations, or regularly checking reputable industry news sources and publications.
Methodology
Step 1 - Identification of Relevant Samples Size from Population Database


Step 2 - Approaches for Defining Global Market Size (Value, Volume* & Price*)

Note*: In applicable scenarios
Step 3 - Data Sources
Primary Research
- Web Analytics
- Survey Reports
- Research Institute
- Latest Research Reports
- Opinion Leaders
Secondary Research
- Annual Reports
- White Paper
- Latest Press Release
- Industry Association
- Paid Database
- Investor Presentations

Step 4 - Data Triangulation
Involves using different sources of information in order to increase the validity of a study
These sources are likely to be stakeholders in a program - participants, other researchers, program staff, other community members, and so on.
Then we put all data in single framework & apply various statistical tools to find out the dynamic on the market.
During the analysis stage, feedback from the stakeholder groups would be compared to determine areas of agreement as well as areas of divergence


