
Key Insights
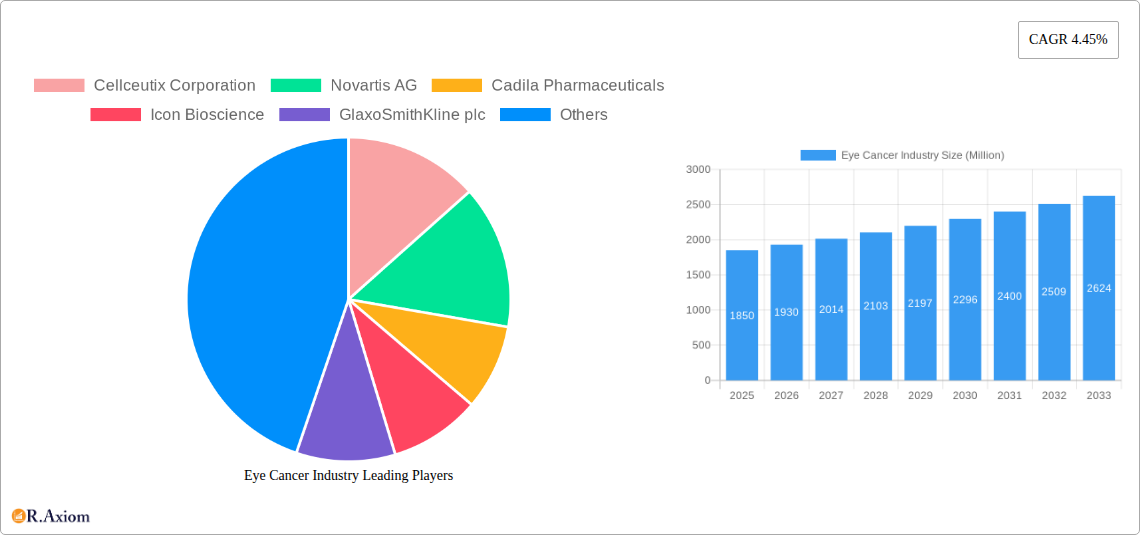
The global eye cancer market, specifically focusing on retinoblastoma, is projected to reach a substantial size, exhibiting a Compound Annual Growth Rate (CAGR) of 4.45% from 2025 to 2033. This growth is driven by several factors. Increased awareness and early diagnosis initiatives are leading to earlier detection and more effective treatment options, improving patient outcomes and driving market expansion. Advancements in surgical techniques, radiation therapy, and chemotherapy, including targeted therapies and immunotherapies, are also significantly contributing to this growth. The rising prevalence of retinoblastoma, particularly in developing regions with limited access to quality healthcare, presents both a challenge and an opportunity for market expansion. The market is segmented by retinoblastoma type (intraocular, extraocular, hereditary, non-hereditary), treatment type (surgery, radiation therapy, chemotherapy, etc.), and geography. North America currently holds a significant market share, attributable to advanced healthcare infrastructure and high healthcare expenditure. However, Asia Pacific is expected to witness substantial growth in the coming years due to its large population and rising healthcare awareness. The competitive landscape includes major pharmaceutical and biotechnology companies actively engaged in research and development, driving innovation and expanding treatment options.
The market's restraints include the high cost of treatment, particularly for advanced therapies like bone marrow transplantation. This often limits accessibility, especially in low- and middle-income countries. Furthermore, the potential for long-term side effects associated with some treatments necessitates careful patient selection and ongoing monitoring. Despite these challenges, the market's growth trajectory remains positive, largely fueled by ongoing research into innovative treatment strategies and an increasing focus on improving early detection rates. Companies are strategically focusing on developing targeted therapies to improve efficacy while reducing side effects, further driving market growth. The increasing adoption of minimally invasive surgical procedures also contributes to this positive outlook, making treatments more accessible and less invasive.
Eye Cancer Industry: A Comprehensive Market Report (2019-2033)
This comprehensive report provides a detailed analysis of the global eye cancer industry, covering market size, segmentation, key players, growth drivers, challenges, and future outlook. The study period spans from 2019 to 2033, with 2025 serving as the base and estimated year. The report offers actionable insights for industry stakeholders, investors, and researchers seeking to understand and capitalize on opportunities within this evolving market. The global eye cancer market is projected to reach xx Million by 2033, exhibiting a CAGR of xx% during the forecast period (2025-2033).
Eye Cancer Industry Market Concentration & Innovation
The eye cancer industry is characterized by a moderately concentrated market structure, with several multinational pharmaceutical companies holding significant market share. Key players such as Novartis AG, Johnson & Johnson, Pfizer Inc., and Merck & Co. dominate the market through their extensive product portfolios and global reach. However, smaller biotech companies like Cellceutix Corporation and RXi Pharmaceuticals are also contributing significantly to innovation. The market share of these leading players is estimated at xx Million in 2025. The high cost of research and development, coupled with stringent regulatory requirements, act as significant barriers to entry for new players.
Mergers and acquisitions (M&A) activity remains a significant driver of industry consolidation and innovation. Recent years have witnessed several high-value deals, exceeding xx Million in total, focused on acquiring promising pipeline assets and expanding therapeutic areas. For example, the acquisition of [Insert example of M&A if available, otherwise use "a smaller biotech company specializing in ophthalmic oncology" and estimate value at xx Million] in [Year] significantly boosted the acquirer's market position. Ongoing innovation focuses on targeted therapies, improved diagnostic tools, and personalized treatment approaches. The regulatory landscape plays a pivotal role in shaping innovation, with approvals requiring rigorous clinical trials and demonstrating efficacy and safety. Substitute treatments, such as alternative surgical techniques, are limited, further solidifying the market for specialized eye cancer therapies. End-user trends show an increasing demand for minimally invasive procedures and improved patient outcomes, driving innovation in areas like laser therapy and targeted drug delivery.
Eye Cancer Industry Industry Trends & Insights
The global eye cancer market is experiencing robust growth, driven by several key factors. Increasing prevalence of eye cancers, particularly retinoblastoma, is a major contributing factor. Advancements in diagnostic technologies, enabling early detection and improved treatment outcomes, are also boosting market growth. The rising geriatric population, coupled with increased awareness and improved access to healthcare, contribute significantly to market expansion. Technological disruptions, particularly in areas like targeted therapy, immunotherapy, and gene therapy, are revolutionizing treatment approaches, offering improved efficacy and reduced side effects. Consumer preferences are shifting towards less invasive procedures and personalized treatments that minimize long-term complications. The competitive landscape is marked by both intense rivalry among established players and the emergence of innovative biotech firms. This leads to ongoing product development and improved treatment options. The market is expected to witness a compound annual growth rate (CAGR) of xx% during the forecast period (2025-2033), reaching a market size of xx Million by 2033. Market penetration for new therapies is projected to increase to xx% by 2033.

Dominant Markets & Segments in Eye Cancer Industry
The North American region currently holds the largest market share in the eye cancer industry due to factors such as advanced healthcare infrastructure, higher diagnostic rates, and increased adoption of innovative therapies. Europe follows as the second largest market.
- By Type of Staging: Intraocular retinoblastoma accounts for a larger market share compared to extraocular retinoblastoma due to higher incidence rates.
- By Treatment Type: Surgery remains the dominant treatment modality, although chemotherapy, radiation therapy, and laser therapy are increasingly utilized depending on the stage and type of cancer. Bone marrow transplantation/stem cell transplant holds a smaller segment but shows promising future prospects.
- By Type of Retinoblastoma: Non-hereditary retinoblastoma constitutes a larger segment than hereditary retinoblastoma, reflecting the higher incidence of sporadic cases.
The dominance of North America is driven by several key factors:
- Advanced healthcare infrastructure: The region boasts world-class hospitals and research institutions equipped with advanced diagnostic and treatment technologies.
- High healthcare expenditure: Per capita healthcare spending is significantly higher in North America compared to other regions, leading to increased access to advanced therapies.
- Favorable regulatory environment: The streamlined regulatory processes facilitate timely approval of new drugs and technologies, driving market growth.
Other regions are expected to witness significant growth in the coming years, driven by rising awareness, improved healthcare access, and increased government investments in healthcare infrastructure.
Eye Cancer Industry Product Developments
Recent product innovations in the eye cancer industry have focused on targeted therapies that selectively target cancer cells, minimizing damage to healthy tissues. Advances in immunotherapy and gene therapy offer promising treatment options for patients with advanced-stage cancers. The development of novel diagnostic tools, including advanced imaging techniques, has improved early detection rates, leading to enhanced patient outcomes. These innovations are improving treatment efficacy and reducing treatment-related complications, thereby addressing unmet patient needs. The market fit of these new products is favorable, given the increasing demand for improved treatment options.
Report Scope & Segmentation Analysis
This report provides a comprehensive segmentation analysis of the eye cancer market across various parameters:
By Type of Staging: Intraocular Retinoblastoma (xx Million in 2025, projected to reach xx Million by 2033 with a CAGR of xx%), Extraocular Retinoblastoma (xx Million in 2025, projected to reach xx Million by 2033 with a CAGR of xx%). The market for Intraocular Retinoblastoma is more competitive due to the greater number of treatment options.
By Treatment Type: Surgery (xx Million in 2025), Radiation therapy (xx Million in 2025), Laser Therapy (xx Million in 2025), Cryotherapy (xx Million in 2025), Chemotherapy (xx Million in 2025), Bone Marrow Transplantation/Stem Cell Transplant (xx Million in 2025). Each segment exhibits varying growth projections reflecting the effectiveness and adoption rates of each treatment approach. Surgical techniques are currently the dominant treatment modality.
By Type of Retinoblastoma: Non-hereditary Retinoblastoma (xx Million in 2025), Hereditary Retinoblastoma (xx Million in 2025). The non-hereditary segment holds a larger share and is projected to experience faster growth.
Key Drivers of Eye Cancer Industry Growth
Several factors are driving growth in the eye cancer industry:
- Rising prevalence of eye cancers: The increasing incidence of retinoblastoma and other eye cancers is fueling demand for effective treatment options.
- Technological advancements: Innovations in targeted therapies, immunotherapy, and gene therapy are enhancing treatment efficacy and improving patient outcomes.
- Increased healthcare spending: Rising investments in healthcare infrastructure and increased healthcare access are enabling wider adoption of advanced therapies.
- Early detection initiatives: Programs aimed at early detection and screening are improving diagnostic rates, leading to earlier interventions and improved prognosis.
Challenges in the Eye Cancer Industry Sector
The eye cancer industry faces several challenges:
- High cost of treatment: Advanced therapies are often expensive, making them inaccessible to many patients.
- Regulatory hurdles: The rigorous approval process for new drugs and therapies can delay market entry.
- Limited treatment options for advanced-stage cancers: Treatment options for patients with advanced-stage eye cancers remain limited, creating unmet medical needs.
- Drug resistance: The development of drug resistance poses a significant challenge in managing and treating recurrent cancers.
Emerging Opportunities in Eye Cancer Industry
The eye cancer market presents various emerging opportunities:
- Personalized medicine: Tailoring treatment plans to individual patient characteristics can improve treatment outcomes.
- Development of novel targeted therapies: The discovery of new drug targets offers scope for developing more effective and safer therapies.
- Expansion into emerging markets: Untapped markets in developing countries present significant growth potential.
- Advancements in diagnostic technologies: The development of more sensitive and specific diagnostic tools can improve early detection rates.
Leading Players in the Eye Cancer Industry Market
- Cellceutix Corporation
- Novartis AG
- Cadila Pharmaceuticals
- Icon Bioscience
- GlaxoSmithKline plc
- Teva Pharmaceutical Industries Ltd
- Johnson & Johnson
- RXi Pharmaceuticals
- Merck & Co
- Baxter International Inc
- Bristol-Myers Squibb Company
- Pfizer Inc
Key Developments in Eye Cancer Industry Industry
- May 2022: The UK's National Health Service launched a new test to detect retinoblastoma in unborn babies, enabling early intervention and potentially saving eyesight. This significantly impacts early diagnosis and market expansion for related treatment modalities.
- September 2022: Researchers discovered the ESRRG molecule's role in retinoblastoma tumor survival, opening avenues for developing novel targeted therapies. This finding could lead to the development of new treatment options and shape future market growth.
Strategic Outlook for Eye Cancer Industry Market
The eye cancer industry is poised for substantial growth, fueled by advancements in treatment modalities, increasing prevalence of eye cancers, and heightened awareness. The focus on personalized medicine and development of novel therapies will continue to drive market expansion. Emerging markets present significant untapped potential, offering further growth opportunities for industry players. Investments in research and development, coupled with strategic collaborations and acquisitions, will shape the future competitive landscape. The market is expected to experience strong growth over the coming years, with significant opportunities for companies specializing in targeted therapies, early detection technologies, and advanced surgical techniques.
Eye Cancer Industry Segmentation
-
1. Treatment Type
- 1.1. Surgery
- 1.2. Radiation therapy
- 1.3. Laser Therapy
- 1.4. Cryotherapy
- 1.5. Chemotherapy
- 1.6. Bone Marrow Transplantation/Stem Cell Transplant
-
2. Type of Retinoblastoma
- 2.1. Non-hereditary Retinoblastoma
- 2.2. Hereditary Retinoblastoma
-
3. Type of Staging
- 3.1. Intraocular Retinoblastoma
- 3.2. Extraocular Retinoblastoma
Eye Cancer Industry Segmentation By Geography
-
1. North America
- 1.1. United States
- 1.2. Canada
- 1.3. Mexico
-
2. Europe
- 2.1. Germany
- 2.2. United Kingdom
- 2.3. France
- 2.4. Italy
- 2.5. Spain
- 2.6. Rest of Europe
-
3. Asia Pacific
- 3.1. China
- 3.2. Japan
- 3.3. India
- 3.4. Australia
- 3.5. South Korea
- 3.6. Rest of Asia Pacific
-
4. Middle East and Africa
- 4.1. GCC
- 4.2. South Africa
- 4.3. Rest of Middle East and Africa
-
5. South America
- 5.1. Brazil
- 5.2. Argentina
- 5.3. Rest of South America

Eye Cancer Industry REPORT HIGHLIGHTS
| Aspects | Details |
|---|---|
| Study Period | 2019-2033 |
| Base Year | 2024 |
| Estimated Year | 2025 |
| Forecast Period | 2025-2033 |
| Historical Period | 2019-2024 |
| Growth Rate | CAGR of 4.45% from 2019-2033 |
| Segmentation |
|
Table of Contents
- 1. Introduction
- 1.1. Research Scope
- 1.2. Market Segmentation
- 1.3. Research Methodology
- 1.4. Definitions and Assumptions
- 2. Executive Summary
- 2.1. Introduction
- 3. Market Dynamics
- 3.1. Introduction
- 3.2. Market Drivers
- 3.2.1. Remission and the Chance of Recurrence of Retinoblastoma; Increasing Public Awareness on Retinoblastoma
- 3.3. Market Restrains
- 3.3.1. Side Effects of Retinoblastoma Surgery and High Cost of Treatment in Developing Countries
- 3.4. Market Trends
- 3.4.1. Non-hereditary Retinoblastoma is Expected to hold a Significant Market Share Over the Forecast Period
- 4. Market Factor Analysis
- 4.1. Porters Five Forces
- 4.2. Supply/Value Chain
- 4.3. PESTEL analysis
- 4.4. Market Entropy
- 4.5. Patent/Trademark Analysis
- 5. Global Eye Cancer Industry Analysis, Insights and Forecast, 2019-2031
- 5.1. Market Analysis, Insights and Forecast - by Treatment Type
- 5.1.1. Surgery
- 5.1.2. Radiation therapy
- 5.1.3. Laser Therapy
- 5.1.4. Cryotherapy
- 5.1.5. Chemotherapy
- 5.1.6. Bone Marrow Transplantation/Stem Cell Transplant
- 5.2. Market Analysis, Insights and Forecast - by Type of Retinoblastoma
- 5.2.1. Non-hereditary Retinoblastoma
- 5.2.2. Hereditary Retinoblastoma
- 5.3. Market Analysis, Insights and Forecast - by Type of Staging
- 5.3.1. Intraocular Retinoblastoma
- 5.3.2. Extraocular Retinoblastoma
- 5.4. Market Analysis, Insights and Forecast - by Region
- 5.4.1. North America
- 5.4.2. Europe
- 5.4.3. Asia Pacific
- 5.4.4. Middle East and Africa
- 5.4.5. South America
- 5.1. Market Analysis, Insights and Forecast - by Treatment Type
- 6. North America Eye Cancer Industry Analysis, Insights and Forecast, 2019-2031
- 6.1. Market Analysis, Insights and Forecast - by Treatment Type
- 6.1.1. Surgery
- 6.1.2. Radiation therapy
- 6.1.3. Laser Therapy
- 6.1.4. Cryotherapy
- 6.1.5. Chemotherapy
- 6.1.6. Bone Marrow Transplantation/Stem Cell Transplant
- 6.2. Market Analysis, Insights and Forecast - by Type of Retinoblastoma
- 6.2.1. Non-hereditary Retinoblastoma
- 6.2.2. Hereditary Retinoblastoma
- 6.3. Market Analysis, Insights and Forecast - by Type of Staging
- 6.3.1. Intraocular Retinoblastoma
- 6.3.2. Extraocular Retinoblastoma
- 6.1. Market Analysis, Insights and Forecast - by Treatment Type
- 7. Europe Eye Cancer Industry Analysis, Insights and Forecast, 2019-2031
- 7.1. Market Analysis, Insights and Forecast - by Treatment Type
- 7.1.1. Surgery
- 7.1.2. Radiation therapy
- 7.1.3. Laser Therapy
- 7.1.4. Cryotherapy
- 7.1.5. Chemotherapy
- 7.1.6. Bone Marrow Transplantation/Stem Cell Transplant
- 7.2. Market Analysis, Insights and Forecast - by Type of Retinoblastoma
- 7.2.1. Non-hereditary Retinoblastoma
- 7.2.2. Hereditary Retinoblastoma
- 7.3. Market Analysis, Insights and Forecast - by Type of Staging
- 7.3.1. Intraocular Retinoblastoma
- 7.3.2. Extraocular Retinoblastoma
- 7.1. Market Analysis, Insights and Forecast - by Treatment Type
- 8. Asia Pacific Eye Cancer Industry Analysis, Insights and Forecast, 2019-2031
- 8.1. Market Analysis, Insights and Forecast - by Treatment Type
- 8.1.1. Surgery
- 8.1.2. Radiation therapy
- 8.1.3. Laser Therapy
- 8.1.4. Cryotherapy
- 8.1.5. Chemotherapy
- 8.1.6. Bone Marrow Transplantation/Stem Cell Transplant
- 8.2. Market Analysis, Insights and Forecast - by Type of Retinoblastoma
- 8.2.1. Non-hereditary Retinoblastoma
- 8.2.2. Hereditary Retinoblastoma
- 8.3. Market Analysis, Insights and Forecast - by Type of Staging
- 8.3.1. Intraocular Retinoblastoma
- 8.3.2. Extraocular Retinoblastoma
- 8.1. Market Analysis, Insights and Forecast - by Treatment Type
- 9. Middle East and Africa Eye Cancer Industry Analysis, Insights and Forecast, 2019-2031
- 9.1. Market Analysis, Insights and Forecast - by Treatment Type
- 9.1.1. Surgery
- 9.1.2. Radiation therapy
- 9.1.3. Laser Therapy
- 9.1.4. Cryotherapy
- 9.1.5. Chemotherapy
- 9.1.6. Bone Marrow Transplantation/Stem Cell Transplant
- 9.2. Market Analysis, Insights and Forecast - by Type of Retinoblastoma
- 9.2.1. Non-hereditary Retinoblastoma
- 9.2.2. Hereditary Retinoblastoma
- 9.3. Market Analysis, Insights and Forecast - by Type of Staging
- 9.3.1. Intraocular Retinoblastoma
- 9.3.2. Extraocular Retinoblastoma
- 9.1. Market Analysis, Insights and Forecast - by Treatment Type
- 10. South America Eye Cancer Industry Analysis, Insights and Forecast, 2019-2031
- 10.1. Market Analysis, Insights and Forecast - by Treatment Type
- 10.1.1. Surgery
- 10.1.2. Radiation therapy
- 10.1.3. Laser Therapy
- 10.1.4. Cryotherapy
- 10.1.5. Chemotherapy
- 10.1.6. Bone Marrow Transplantation/Stem Cell Transplant
- 10.2. Market Analysis, Insights and Forecast - by Type of Retinoblastoma
- 10.2.1. Non-hereditary Retinoblastoma
- 10.2.2. Hereditary Retinoblastoma
- 10.3. Market Analysis, Insights and Forecast - by Type of Staging
- 10.3.1. Intraocular Retinoblastoma
- 10.3.2. Extraocular Retinoblastoma
- 10.1. Market Analysis, Insights and Forecast - by Treatment Type
- 11. North America Eye Cancer Industry Analysis, Insights and Forecast, 2019-2031
- 11.1. Market Analysis, Insights and Forecast - By Country/Sub-region
- 11.1.1 United States
- 11.1.2 Canada
- 11.1.3 Mexico
- 12. Europe Eye Cancer Industry Analysis, Insights and Forecast, 2019-2031
- 12.1. Market Analysis, Insights and Forecast - By Country/Sub-region
- 12.1.1 Germany
- 12.1.2 United Kingdom
- 12.1.3 France
- 12.1.4 Italy
- 12.1.5 Spain
- 12.1.6 Rest of Europe
- 13. Asia Pacific Eye Cancer Industry Analysis, Insights and Forecast, 2019-2031
- 13.1. Market Analysis, Insights and Forecast - By Country/Sub-region
- 13.1.1 China
- 13.1.2 Japan
- 13.1.3 India
- 13.1.4 Australia
- 13.1.5 South Korea
- 13.1.6 Rest of Asia Pacific
- 14. Middle East and Africa Eye Cancer Industry Analysis, Insights and Forecast, 2019-2031
- 14.1. Market Analysis, Insights and Forecast - By Country/Sub-region
- 14.1.1 GCC
- 14.1.2 South Africa
- 14.1.3 Rest of Middle East and Africa
- 15. South America Eye Cancer Industry Analysis, Insights and Forecast, 2019-2031
- 15.1. Market Analysis, Insights and Forecast - By Country/Sub-region
- 15.1.1 Brazil
- 15.1.2 Argentina
- 15.1.3 Rest of South America
- 16. Competitive Analysis
- 16.1. Global Market Share Analysis 2024
- 16.2. Company Profiles
- 16.2.1 Cellceutix Corporation
- 16.2.1.1. Overview
- 16.2.1.2. Products
- 16.2.1.3. SWOT Analysis
- 16.2.1.4. Recent Developments
- 16.2.1.5. Financials (Based on Availability)
- 16.2.2 Novartis AG
- 16.2.2.1. Overview
- 16.2.2.2. Products
- 16.2.2.3. SWOT Analysis
- 16.2.2.4. Recent Developments
- 16.2.2.5. Financials (Based on Availability)
- 16.2.3 Cadila Pharmaceuticals
- 16.2.3.1. Overview
- 16.2.3.2. Products
- 16.2.3.3. SWOT Analysis
- 16.2.3.4. Recent Developments
- 16.2.3.5. Financials (Based on Availability)
- 16.2.4 Icon Bioscience
- 16.2.4.1. Overview
- 16.2.4.2. Products
- 16.2.4.3. SWOT Analysis
- 16.2.4.4. Recent Developments
- 16.2.4.5. Financials (Based on Availability)
- 16.2.5 GlaxoSmithKline plc
- 16.2.5.1. Overview
- 16.2.5.2. Products
- 16.2.5.3. SWOT Analysis
- 16.2.5.4. Recent Developments
- 16.2.5.5. Financials (Based on Availability)
- 16.2.6 Teva Pharmaceutical Industries Ltd
- 16.2.6.1. Overview
- 16.2.6.2. Products
- 16.2.6.3. SWOT Analysis
- 16.2.6.4. Recent Developments
- 16.2.6.5. Financials (Based on Availability)
- 16.2.7 Johnson & Johnson
- 16.2.7.1. Overview
- 16.2.7.2. Products
- 16.2.7.3. SWOT Analysis
- 16.2.7.4. Recent Developments
- 16.2.7.5. Financials (Based on Availability)
- 16.2.8 RXi Pharmaceuticals*List Not Exhaustive
- 16.2.8.1. Overview
- 16.2.8.2. Products
- 16.2.8.3. SWOT Analysis
- 16.2.8.4. Recent Developments
- 16.2.8.5. Financials (Based on Availability)
- 16.2.9 Merck & Co
- 16.2.9.1. Overview
- 16.2.9.2. Products
- 16.2.9.3. SWOT Analysis
- 16.2.9.4. Recent Developments
- 16.2.9.5. Financials (Based on Availability)
- 16.2.10 Baxter International Inc
- 16.2.10.1. Overview
- 16.2.10.2. Products
- 16.2.10.3. SWOT Analysis
- 16.2.10.4. Recent Developments
- 16.2.10.5. Financials (Based on Availability)
- 16.2.11 Bristol-Myers Squibb Company
- 16.2.11.1. Overview
- 16.2.11.2. Products
- 16.2.11.3. SWOT Analysis
- 16.2.11.4. Recent Developments
- 16.2.11.5. Financials (Based on Availability)
- 16.2.12 Pfizer Inc
- 16.2.12.1. Overview
- 16.2.12.2. Products
- 16.2.12.3. SWOT Analysis
- 16.2.12.4. Recent Developments
- 16.2.12.5. Financials (Based on Availability)
- 16.2.1 Cellceutix Corporation
List of Figures
- Figure 1: Global Eye Cancer Industry Revenue Breakdown (Million, %) by Region 2024 & 2032
- Figure 2: North America Eye Cancer Industry Revenue (Million), by Country 2024 & 2032
- Figure 3: North America Eye Cancer Industry Revenue Share (%), by Country 2024 & 2032
- Figure 4: Europe Eye Cancer Industry Revenue (Million), by Country 2024 & 2032
- Figure 5: Europe Eye Cancer Industry Revenue Share (%), by Country 2024 & 2032
- Figure 6: Asia Pacific Eye Cancer Industry Revenue (Million), by Country 2024 & 2032
- Figure 7: Asia Pacific Eye Cancer Industry Revenue Share (%), by Country 2024 & 2032
- Figure 8: Middle East and Africa Eye Cancer Industry Revenue (Million), by Country 2024 & 2032
- Figure 9: Middle East and Africa Eye Cancer Industry Revenue Share (%), by Country 2024 & 2032
- Figure 10: South America Eye Cancer Industry Revenue (Million), by Country 2024 & 2032
- Figure 11: South America Eye Cancer Industry Revenue Share (%), by Country 2024 & 2032
- Figure 12: North America Eye Cancer Industry Revenue (Million), by Treatment Type 2024 & 2032
- Figure 13: North America Eye Cancer Industry Revenue Share (%), by Treatment Type 2024 & 2032
- Figure 14: North America Eye Cancer Industry Revenue (Million), by Type of Retinoblastoma 2024 & 2032
- Figure 15: North America Eye Cancer Industry Revenue Share (%), by Type of Retinoblastoma 2024 & 2032
- Figure 16: North America Eye Cancer Industry Revenue (Million), by Type of Staging 2024 & 2032
- Figure 17: North America Eye Cancer Industry Revenue Share (%), by Type of Staging 2024 & 2032
- Figure 18: North America Eye Cancer Industry Revenue (Million), by Country 2024 & 2032
- Figure 19: North America Eye Cancer Industry Revenue Share (%), by Country 2024 & 2032
- Figure 20: Europe Eye Cancer Industry Revenue (Million), by Treatment Type 2024 & 2032
- Figure 21: Europe Eye Cancer Industry Revenue Share (%), by Treatment Type 2024 & 2032
- Figure 22: Europe Eye Cancer Industry Revenue (Million), by Type of Retinoblastoma 2024 & 2032
- Figure 23: Europe Eye Cancer Industry Revenue Share (%), by Type of Retinoblastoma 2024 & 2032
- Figure 24: Europe Eye Cancer Industry Revenue (Million), by Type of Staging 2024 & 2032
- Figure 25: Europe Eye Cancer Industry Revenue Share (%), by Type of Staging 2024 & 2032
- Figure 26: Europe Eye Cancer Industry Revenue (Million), by Country 2024 & 2032
- Figure 27: Europe Eye Cancer Industry Revenue Share (%), by Country 2024 & 2032
- Figure 28: Asia Pacific Eye Cancer Industry Revenue (Million), by Treatment Type 2024 & 2032
- Figure 29: Asia Pacific Eye Cancer Industry Revenue Share (%), by Treatment Type 2024 & 2032
- Figure 30: Asia Pacific Eye Cancer Industry Revenue (Million), by Type of Retinoblastoma 2024 & 2032
- Figure 31: Asia Pacific Eye Cancer Industry Revenue Share (%), by Type of Retinoblastoma 2024 & 2032
- Figure 32: Asia Pacific Eye Cancer Industry Revenue (Million), by Type of Staging 2024 & 2032
- Figure 33: Asia Pacific Eye Cancer Industry Revenue Share (%), by Type of Staging 2024 & 2032
- Figure 34: Asia Pacific Eye Cancer Industry Revenue (Million), by Country 2024 & 2032
- Figure 35: Asia Pacific Eye Cancer Industry Revenue Share (%), by Country 2024 & 2032
- Figure 36: Middle East and Africa Eye Cancer Industry Revenue (Million), by Treatment Type 2024 & 2032
- Figure 37: Middle East and Africa Eye Cancer Industry Revenue Share (%), by Treatment Type 2024 & 2032
- Figure 38: Middle East and Africa Eye Cancer Industry Revenue (Million), by Type of Retinoblastoma 2024 & 2032
- Figure 39: Middle East and Africa Eye Cancer Industry Revenue Share (%), by Type of Retinoblastoma 2024 & 2032
- Figure 40: Middle East and Africa Eye Cancer Industry Revenue (Million), by Type of Staging 2024 & 2032
- Figure 41: Middle East and Africa Eye Cancer Industry Revenue Share (%), by Type of Staging 2024 & 2032
- Figure 42: Middle East and Africa Eye Cancer Industry Revenue (Million), by Country 2024 & 2032
- Figure 43: Middle East and Africa Eye Cancer Industry Revenue Share (%), by Country 2024 & 2032
- Figure 44: South America Eye Cancer Industry Revenue (Million), by Treatment Type 2024 & 2032
- Figure 45: South America Eye Cancer Industry Revenue Share (%), by Treatment Type 2024 & 2032
- Figure 46: South America Eye Cancer Industry Revenue (Million), by Type of Retinoblastoma 2024 & 2032
- Figure 47: South America Eye Cancer Industry Revenue Share (%), by Type of Retinoblastoma 2024 & 2032
- Figure 48: South America Eye Cancer Industry Revenue (Million), by Type of Staging 2024 & 2032
- Figure 49: South America Eye Cancer Industry Revenue Share (%), by Type of Staging 2024 & 2032
- Figure 50: South America Eye Cancer Industry Revenue (Million), by Country 2024 & 2032
- Figure 51: South America Eye Cancer Industry Revenue Share (%), by Country 2024 & 2032
List of Tables
- Table 1: Global Eye Cancer Industry Revenue Million Forecast, by Region 2019 & 2032
- Table 2: Global Eye Cancer Industry Revenue Million Forecast, by Treatment Type 2019 & 2032
- Table 3: Global Eye Cancer Industry Revenue Million Forecast, by Type of Retinoblastoma 2019 & 2032
- Table 4: Global Eye Cancer Industry Revenue Million Forecast, by Type of Staging 2019 & 2032
- Table 5: Global Eye Cancer Industry Revenue Million Forecast, by Region 2019 & 2032
- Table 6: Global Eye Cancer Industry Revenue Million Forecast, by Country 2019 & 2032
- Table 7: United States Eye Cancer Industry Revenue (Million) Forecast, by Application 2019 & 2032
- Table 8: Canada Eye Cancer Industry Revenue (Million) Forecast, by Application 2019 & 2032
- Table 9: Mexico Eye Cancer Industry Revenue (Million) Forecast, by Application 2019 & 2032
- Table 10: Global Eye Cancer Industry Revenue Million Forecast, by Country 2019 & 2032
- Table 11: Germany Eye Cancer Industry Revenue (Million) Forecast, by Application 2019 & 2032
- Table 12: United Kingdom Eye Cancer Industry Revenue (Million) Forecast, by Application 2019 & 2032
- Table 13: France Eye Cancer Industry Revenue (Million) Forecast, by Application 2019 & 2032
- Table 14: Italy Eye Cancer Industry Revenue (Million) Forecast, by Application 2019 & 2032
- Table 15: Spain Eye Cancer Industry Revenue (Million) Forecast, by Application 2019 & 2032
- Table 16: Rest of Europe Eye Cancer Industry Revenue (Million) Forecast, by Application 2019 & 2032
- Table 17: Global Eye Cancer Industry Revenue Million Forecast, by Country 2019 & 2032
- Table 18: China Eye Cancer Industry Revenue (Million) Forecast, by Application 2019 & 2032
- Table 19: Japan Eye Cancer Industry Revenue (Million) Forecast, by Application 2019 & 2032
- Table 20: India Eye Cancer Industry Revenue (Million) Forecast, by Application 2019 & 2032
- Table 21: Australia Eye Cancer Industry Revenue (Million) Forecast, by Application 2019 & 2032
- Table 22: South Korea Eye Cancer Industry Revenue (Million) Forecast, by Application 2019 & 2032
- Table 23: Rest of Asia Pacific Eye Cancer Industry Revenue (Million) Forecast, by Application 2019 & 2032
- Table 24: Global Eye Cancer Industry Revenue Million Forecast, by Country 2019 & 2032
- Table 25: GCC Eye Cancer Industry Revenue (Million) Forecast, by Application 2019 & 2032
- Table 26: South Africa Eye Cancer Industry Revenue (Million) Forecast, by Application 2019 & 2032
- Table 27: Rest of Middle East and Africa Eye Cancer Industry Revenue (Million) Forecast, by Application 2019 & 2032
- Table 28: Global Eye Cancer Industry Revenue Million Forecast, by Country 2019 & 2032
- Table 29: Brazil Eye Cancer Industry Revenue (Million) Forecast, by Application 2019 & 2032
- Table 30: Argentina Eye Cancer Industry Revenue (Million) Forecast, by Application 2019 & 2032
- Table 31: Rest of South America Eye Cancer Industry Revenue (Million) Forecast, by Application 2019 & 2032
- Table 32: Global Eye Cancer Industry Revenue Million Forecast, by Treatment Type 2019 & 2032
- Table 33: Global Eye Cancer Industry Revenue Million Forecast, by Type of Retinoblastoma 2019 & 2032
- Table 34: Global Eye Cancer Industry Revenue Million Forecast, by Type of Staging 2019 & 2032
- Table 35: Global Eye Cancer Industry Revenue Million Forecast, by Country 2019 & 2032
- Table 36: United States Eye Cancer Industry Revenue (Million) Forecast, by Application 2019 & 2032
- Table 37: Canada Eye Cancer Industry Revenue (Million) Forecast, by Application 2019 & 2032
- Table 38: Mexico Eye Cancer Industry Revenue (Million) Forecast, by Application 2019 & 2032
- Table 39: Global Eye Cancer Industry Revenue Million Forecast, by Treatment Type 2019 & 2032
- Table 40: Global Eye Cancer Industry Revenue Million Forecast, by Type of Retinoblastoma 2019 & 2032
- Table 41: Global Eye Cancer Industry Revenue Million Forecast, by Type of Staging 2019 & 2032
- Table 42: Global Eye Cancer Industry Revenue Million Forecast, by Country 2019 & 2032
- Table 43: Germany Eye Cancer Industry Revenue (Million) Forecast, by Application 2019 & 2032
- Table 44: United Kingdom Eye Cancer Industry Revenue (Million) Forecast, by Application 2019 & 2032
- Table 45: France Eye Cancer Industry Revenue (Million) Forecast, by Application 2019 & 2032
- Table 46: Italy Eye Cancer Industry Revenue (Million) Forecast, by Application 2019 & 2032
- Table 47: Spain Eye Cancer Industry Revenue (Million) Forecast, by Application 2019 & 2032
- Table 48: Rest of Europe Eye Cancer Industry Revenue (Million) Forecast, by Application 2019 & 2032
- Table 49: Global Eye Cancer Industry Revenue Million Forecast, by Treatment Type 2019 & 2032
- Table 50: Global Eye Cancer Industry Revenue Million Forecast, by Type of Retinoblastoma 2019 & 2032
- Table 51: Global Eye Cancer Industry Revenue Million Forecast, by Type of Staging 2019 & 2032
- Table 52: Global Eye Cancer Industry Revenue Million Forecast, by Country 2019 & 2032
- Table 53: China Eye Cancer Industry Revenue (Million) Forecast, by Application 2019 & 2032
- Table 54: Japan Eye Cancer Industry Revenue (Million) Forecast, by Application 2019 & 2032
- Table 55: India Eye Cancer Industry Revenue (Million) Forecast, by Application 2019 & 2032
- Table 56: Australia Eye Cancer Industry Revenue (Million) Forecast, by Application 2019 & 2032
- Table 57: South Korea Eye Cancer Industry Revenue (Million) Forecast, by Application 2019 & 2032
- Table 58: Rest of Asia Pacific Eye Cancer Industry Revenue (Million) Forecast, by Application 2019 & 2032
- Table 59: Global Eye Cancer Industry Revenue Million Forecast, by Treatment Type 2019 & 2032
- Table 60: Global Eye Cancer Industry Revenue Million Forecast, by Type of Retinoblastoma 2019 & 2032
- Table 61: Global Eye Cancer Industry Revenue Million Forecast, by Type of Staging 2019 & 2032
- Table 62: Global Eye Cancer Industry Revenue Million Forecast, by Country 2019 & 2032
- Table 63: GCC Eye Cancer Industry Revenue (Million) Forecast, by Application 2019 & 2032
- Table 64: South Africa Eye Cancer Industry Revenue (Million) Forecast, by Application 2019 & 2032
- Table 65: Rest of Middle East and Africa Eye Cancer Industry Revenue (Million) Forecast, by Application 2019 & 2032
- Table 66: Global Eye Cancer Industry Revenue Million Forecast, by Treatment Type 2019 & 2032
- Table 67: Global Eye Cancer Industry Revenue Million Forecast, by Type of Retinoblastoma 2019 & 2032
- Table 68: Global Eye Cancer Industry Revenue Million Forecast, by Type of Staging 2019 & 2032
- Table 69: Global Eye Cancer Industry Revenue Million Forecast, by Country 2019 & 2032
- Table 70: Brazil Eye Cancer Industry Revenue (Million) Forecast, by Application 2019 & 2032
- Table 71: Argentina Eye Cancer Industry Revenue (Million) Forecast, by Application 2019 & 2032
- Table 72: Rest of South America Eye Cancer Industry Revenue (Million) Forecast, by Application 2019 & 2032
Frequently Asked Questions
1. What is the projected Compound Annual Growth Rate (CAGR) of the Eye Cancer Industry?
The projected CAGR is approximately 4.45%.
2. Which companies are prominent players in the Eye Cancer Industry?
Key companies in the market include Cellceutix Corporation, Novartis AG, Cadila Pharmaceuticals, Icon Bioscience, GlaxoSmithKline plc, Teva Pharmaceutical Industries Ltd, Johnson & Johnson, RXi Pharmaceuticals*List Not Exhaustive, Merck & Co, Baxter International Inc, Bristol-Myers Squibb Company, Pfizer Inc.
3. What are the main segments of the Eye Cancer Industry?
The market segments include Treatment Type, Type of Retinoblastoma, Type of Staging.
4. Can you provide details about the market size?
The market size is estimated to be USD 1.85 Million as of 2022.
5. What are some drivers contributing to market growth?
Remission and the Chance of Recurrence of Retinoblastoma; Increasing Public Awareness on Retinoblastoma.
6. What are the notable trends driving market growth?
Non-hereditary Retinoblastoma is Expected to hold a Significant Market Share Over the Forecast Period.
7. Are there any restraints impacting market growth?
Side Effects of Retinoblastoma Surgery and High Cost of Treatment in Developing Countries.
8. Can you provide examples of recent developments in the market?
September 2022: researchers at UT Southwestern and the University of Miami discovered a molecule, estrogen-related receptor gamma, or ESRRG that is hyperactive and promotes tumor cell survival in retinoblastoma. Blocking ESRRG, the team reported in Science Advances, kills retinoblastoma cells.
9. What pricing options are available for accessing the report?
Pricing options include single-user, multi-user, and enterprise licenses priced at USD 4750, USD 5250, and USD 8750 respectively.
10. Is the market size provided in terms of value or volume?
The market size is provided in terms of value, measured in Million.
11. Are there any specific market keywords associated with the report?
Yes, the market keyword associated with the report is "Eye Cancer Industry," which aids in identifying and referencing the specific market segment covered.
12. How do I determine which pricing option suits my needs best?
The pricing options vary based on user requirements and access needs. Individual users may opt for single-user licenses, while businesses requiring broader access may choose multi-user or enterprise licenses for cost-effective access to the report.
13. Are there any additional resources or data provided in the Eye Cancer Industry report?
While the report offers comprehensive insights, it's advisable to review the specific contents or supplementary materials provided to ascertain if additional resources or data are available.
14. How can I stay updated on further developments or reports in the Eye Cancer Industry?
To stay informed about further developments, trends, and reports in the Eye Cancer Industry, consider subscribing to industry newsletters, following relevant companies and organizations, or regularly checking reputable industry news sources and publications.
Methodology
Step 1 - Identification of Relevant Samples Size from Population Database


Step 2 - Approaches for Defining Global Market Size (Value, Volume* & Price*)

Note*: In applicable scenarios
Step 3 - Data Sources
Primary Research
- Web Analytics
- Survey Reports
- Research Institute
- Latest Research Reports
- Opinion Leaders
Secondary Research
- Annual Reports
- White Paper
- Latest Press Release
- Industry Association
- Paid Database
- Investor Presentations

Step 4 - Data Triangulation
Involves using different sources of information in order to increase the validity of a study
These sources are likely to be stakeholders in a program - participants, other researchers, program staff, other community members, and so on.
Then we put all data in single framework & apply various statistical tools to find out the dynamic on the market.
During the analysis stage, feedback from the stakeholder groups would be compared to determine areas of agreement as well as areas of divergence


