
Key Insights
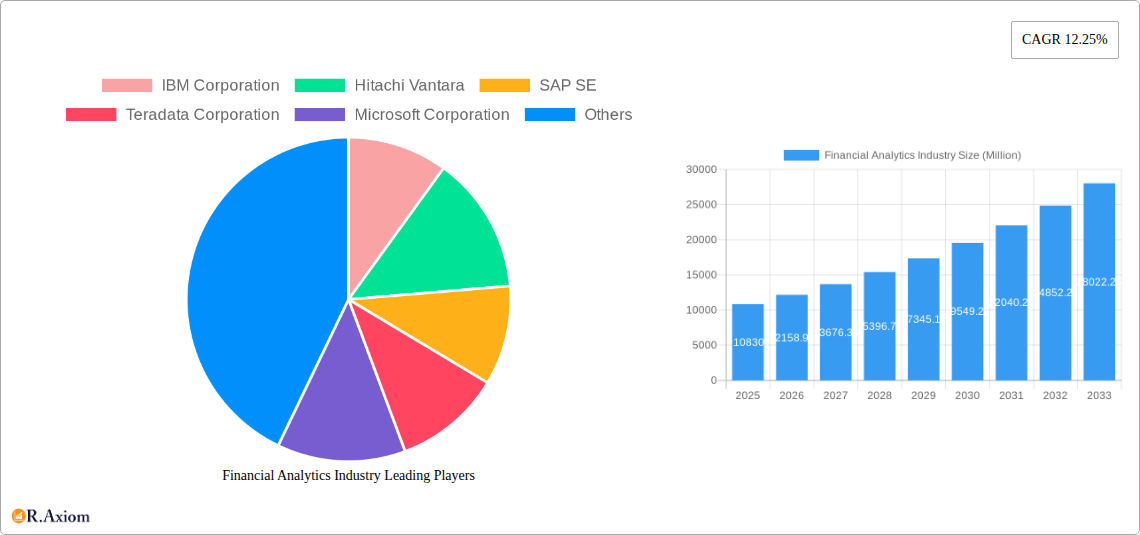
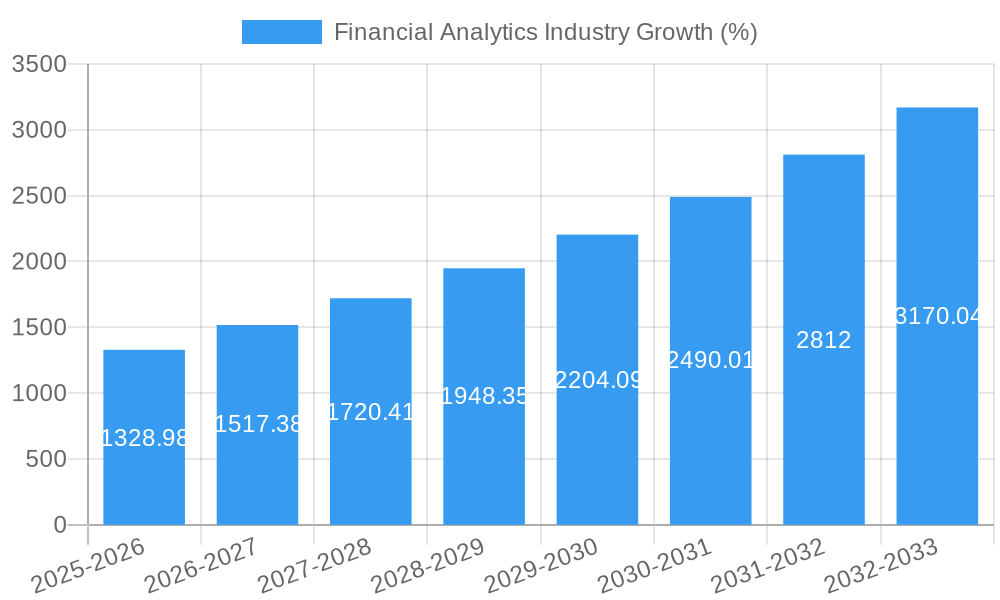
The global financial analytics market, valued at $10.83 billion in 2025, is projected to experience robust growth, driven by a compound annual growth rate (CAGR) of 12.25% from 2025 to 2033. This expansion is fueled by several key factors. Increasing regulatory scrutiny and the need for robust risk management are compelling financial institutions to adopt sophisticated analytics solutions for compliance and fraud detection. Furthermore, the burgeoning adoption of cloud-based solutions offers scalability and cost-effectiveness, accelerating market penetration. The rise of big data and advanced analytical techniques, such as artificial intelligence (AI) and machine learning (ML), enables more accurate predictions, improved decision-making, and enhanced customer experience, further boosting market demand. Growth is also spurred by the expanding use of financial analytics across various sectors, including BFSI, healthcare, and manufacturing, each leveraging these technologies to optimize operations, manage risks, and gain a competitive edge. Market segmentation reveals a significant share held by cloud-based deployments and solutions focused on database management and planning, reflecting the industry's digital transformation trajectory.
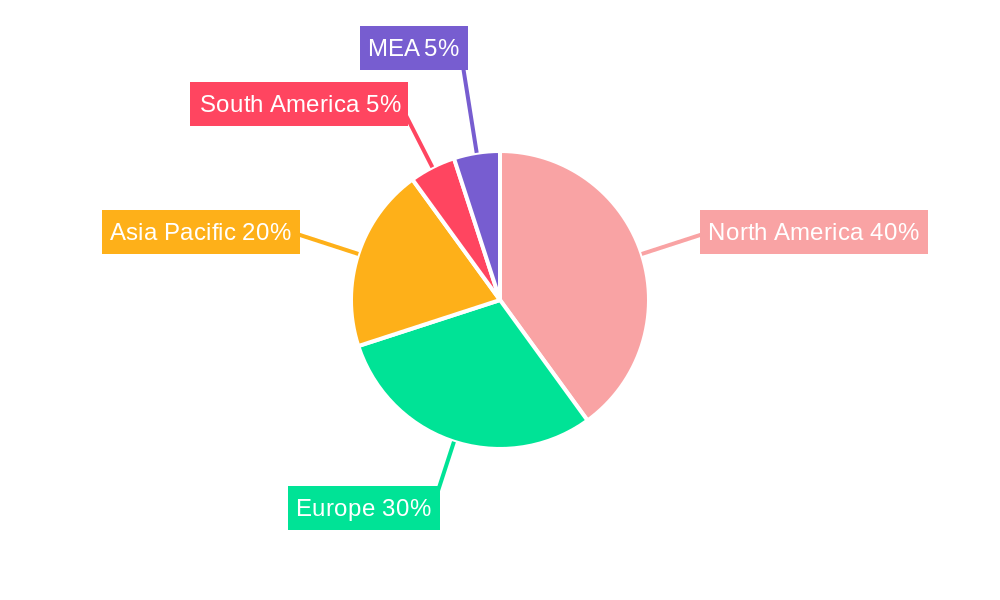
While the market enjoys significant growth potential, certain challenges persist. High implementation costs and the need for specialized expertise can hinder adoption, especially for smaller organizations. Data security and privacy concerns are also paramount, requiring robust security measures and compliance with evolving regulations. However, the long-term outlook remains positive, with the continuous development of advanced analytics tools and the increasing availability of skilled professionals countering these challenges. The market is expected to see further diversification, with niche solutions emerging to address specific needs across various industry verticals and geographic regions. North America and Europe are currently leading the market due to higher technology adoption rates and a well-established financial infrastructure. However, Asia-Pacific is poised for rapid growth, driven by increasing digitalization and economic expansion.
Financial Analytics Industry: Market Report 2019-2033
This comprehensive report provides a detailed analysis of the Financial Analytics industry, offering invaluable insights for stakeholders, investors, and industry professionals. The report covers the period from 2019 to 2033, with a base year of 2025 and a forecast period spanning 2025-2033. The historical period analyzed is 2019-2024. The global market size is projected to reach xx Million by 2033, exhibiting a robust Compound Annual Growth Rate (CAGR) of xx% during the forecast period.
Financial Analytics Industry Market Concentration & Innovation
The Financial Analytics market exhibits a moderately concentrated landscape, with key players like IBM Corporation, Hitachi Vantara, SAP SE, Teradata Corporation, Microsoft Corporation, SAS Institute, Oracle Corporation, and FICO holding significant market share. Market share data for 2024 indicates IBM Corporation at xx%, followed by Hitachi Vantara at xx%, and SAP SE at xx%. The remaining players contribute to the remaining market share.
Innovation is driven by advancements in artificial intelligence (AI), machine learning (ML), and big data analytics. Regulatory frameworks, such as GDPR and CCPA, are shaping data privacy and security practices. Cloud-based solutions are emerging as strong substitutes for on-premise systems. End-user trends favor real-time analytics and predictive modeling capabilities. Mergers and acquisitions (M&A) activities, with deal values exceeding xx Million in 2024, are further consolidating the market. Significant M&A activity includes:
- Acquisition of [Company A] by [Company B] for xx Million in Q[Quarter] 2024.
- Strategic partnership between [Company C] and [Company D] to develop a new analytics platform.
Financial Analytics Industry Industry Trends & Insights
The Financial Analytics market is experiencing significant growth, driven by increasing adoption of digital technologies, rising demand for data-driven decision-making across various sectors, and the proliferation of big data. The market's CAGR is estimated at xx% during the forecast period. Market penetration in key segments like BFSI has reached xx% in 2024. The increasing need for fraud detection, risk management, and regulatory compliance is a major factor driving the market growth. Technological disruptions like the widespread adoption of cloud computing and AI are reshaping the industry, fostering the development of sophisticated analytical tools. Consumer preferences are increasingly favoring user-friendly, intuitive interfaces and personalized insights. Competitive dynamics are marked by intense innovation, strategic partnerships, and acquisitions, shaping the evolving market landscape.
Dominant Markets & Segments in Financial Analytics Industry
The BFSI (Banking, Financial Services, and Insurance) sector remains the dominant end-user vertical, contributing xx% to the total market revenue in 2024. North America is projected to be the leading region in the coming years, followed by Europe and Asia-Pacific.
By Deployment Type:
- Cloud: Rapid growth is anticipated due to scalability, cost-effectiveness, and accessibility.
- On-premise: While declining, this segment still retains a significant presence, particularly in organizations with stringent security requirements.
By Solution Type:
- Database Management and Planning: Essential for organizing and managing vast amounts of financial data.
- Analysis and Reporting: Growing demand due to the need for actionable insights and real-time reporting.
- Other Types: This includes specialized solutions focusing on areas like fraud detection and risk management, contributing to substantial growth.
By End-user Vertical:
- BFSI: High adoption driven by regulatory compliance needs and the desire for improved customer experience.
- Healthcare: Increasing use in claims processing, risk assessment, and personalized medicine.
- Manufacturing: Applications in supply chain optimization, predictive maintenance, and inventory management.
- Government: Growing demand for efficient resource allocation and data-driven policy-making.
- IT and Telecom: Use in network optimization, customer churn prediction, and fraud detection.
Key drivers for dominance include robust economic growth, advanced technological infrastructure, and supportive regulatory policies.
Financial Analytics Industry Product Developments
Recent product innovations focus on incorporating AI and ML capabilities into existing solutions, enabling predictive analytics and automated insights. New applications are emerging in areas such as blockchain technology for enhanced security and transparency. Competitive advantages are derived from superior data visualization, integrated dashboards, and seamless cloud integration. These advancements address the market need for actionable and timely insights, ultimately improving operational efficiency and strategic decision-making.
Report Scope & Segmentation Analysis
This report segments the Financial Analytics market by deployment type (on-premise and cloud), solution type (database management and planning, analysis and reporting, and other types), and end-user vertical (BFSI, healthcare, manufacturing, government, IT and telecom, and other end-user verticals). Each segment is analyzed in detail, providing insights into market size, growth projections, and competitive dynamics. For example, the cloud segment is projected to show the highest growth rate in the forecast period, driven by its flexibility and cost-effectiveness. The BFSI sector is expected to remain the largest end-user segment, owing to its strong focus on data-driven decision-making.
Key Drivers of Financial Analytics Industry Growth
Technological advancements, particularly in AI, ML, and big data analytics, are key drivers of market growth. The increasing availability of data and the need for real-time insights further fuels demand. Growing regulatory compliance requirements across industries, coupled with the need for improved risk management and fraud detection, also contribute to the market's expansion. Furthermore, robust economic growth in key markets stimulates investment in advanced analytical solutions.
Challenges in the Financial Analytics Industry Sector
The industry faces challenges such as data security and privacy concerns, escalating data storage costs, and the complexity of integrating diverse data sources. The increasing regulatory landscape adds compliance burdens. Competition from established players and new entrants puts pressure on pricing and margins. Supply chain disruptions can also impact the availability of hardware and software components. These challenges can reduce market growth potential by estimated xx% by 2030 if not appropriately addressed.
Emerging Opportunities in Financial Analytics Industry
Emerging opportunities lie in the integration of financial analytics with blockchain technology, advancements in natural language processing (NLP) for enhanced data interpretation, and the expanding adoption of serverless computing. The growing demand for real-time analytics in diverse sectors presents lucrative opportunities, particularly in emerging markets. Furthermore, the focus on personalized financial insights is paving the way for niche solutions catering to specific customer needs.
Leading Players in the Financial Analytics Industry Market
- IBM Corporation
- Hitachi Vantara
- SAP SE
- Teradata Corporation
- Microsoft Corporation
- SAS Institute
- Oracle Corporation
- FICO
Key Developments in Financial Analytics Industry Industry
- July 2023: Dobin, an AI-powered FinTech solution, launched in Southeast Asia, marking a significant development in open finance and advanced data analytics. This highlights the growing adoption of AI-driven solutions and the potential for innovation in emerging markets.
Strategic Outlook for Financial Analytics Industry Market
The Financial Analytics market is poised for continued growth, driven by technological innovation, increasing data volumes, and the growing need for data-driven decision-making across various industries. The market’s future potential lies in leveraging emerging technologies like AI, ML, and blockchain, and expanding into new markets and applications. Companies that can adapt to evolving customer needs and regulatory landscapes will be well-positioned to capture significant market share in the coming years.
Financial Analytics Industry Segmentation
-
1. Deployment Type
- 1.1. On-premise
- 1.2. Cloud
-
2. Solution Type
- 2.1. Database Management and Planning
- 2.2. Analysis and Reporting
- 2.3. Other Type
-
3. End-user Vertical
- 3.1. BFSI
- 3.2. Healthcare
- 3.3. Manufacturing
- 3.4. Government
- 3.5. IT and Telecom
- 3.6. Other End-user Verticals
Financial Analytics Industry Segmentation By Geography
-
1. North America
- 1.1. United States
- 1.2. Canada
-
2. Europe
- 2.1. United Kingdom
- 2.2. Germany
- 2.3. France
- 2.4. Rest of Europe
-
3. Asia Pacific
- 3.1. China
- 3.2. Japan
- 3.3. Singapore
- 3.4. India
- 3.5. South Korea
- 3.6. Rest of Asia Pacific
-
4. Latin America
- 4.1. Mexico
- 4.2. Brazil
- 4.3. Rest of Latin America
-
5. Middle East and Africa
- 5.1. United Arab Emirates
- 5.2. South Africa
- 5.3. Rest of Middle East and Africa
Financial Analytics Industry REPORT HIGHLIGHTS
| Aspects | Details |
|---|---|
| Study Period | 2019-2033 |
| Base Year | 2024 |
| Estimated Year | 2025 |
| Forecast Period | 2025-2033 |
| Historical Period | 2019-2024 |
| Growth Rate | CAGR of 12.25% from 2019-2033 |
| Segmentation |
|
Table of Contents
- 1. Introduction
- 1.1. Research Scope
- 1.2. Market Segmentation
- 1.3. Research Methodology
- 1.4. Definitions and Assumptions
- 2. Executive Summary
- 2.1. Introduction
- 3. Market Dynamics
- 3.1. Introduction
- 3.2. Market Drivers
- 3.2.1. Advancement in BI and Business Analytics Tools; Growing Focus on Data Driven Financial Decisions in End Users
- 3.3. Market Restrains
- 3.3.1. Lack of Awareness Regarding Fraud Detection Solutions
- 3.4. Market Trends
- 3.4.1. Cloud Based Solutions are Expected to Gain Significant Traction
- 4. Market Factor Analysis
- 4.1. Porters Five Forces
- 4.2. Supply/Value Chain
- 4.3. PESTEL analysis
- 4.4. Market Entropy
- 4.5. Patent/Trademark Analysis
- 5. Global Financial Analytics Industry Analysis, Insights and Forecast, 2019-2031
- 5.1. Market Analysis, Insights and Forecast - by Deployment Type
- 5.1.1. On-premise
- 5.1.2. Cloud
- 5.2. Market Analysis, Insights and Forecast - by Solution Type
- 5.2.1. Database Management and Planning
- 5.2.2. Analysis and Reporting
- 5.2.3. Other Type
- 5.3. Market Analysis, Insights and Forecast - by End-user Vertical
- 5.3.1. BFSI
- 5.3.2. Healthcare
- 5.3.3. Manufacturing
- 5.3.4. Government
- 5.3.5. IT and Telecom
- 5.3.6. Other End-user Verticals
- 5.4. Market Analysis, Insights and Forecast - by Region
- 5.4.1. North America
- 5.4.2. Europe
- 5.4.3. Asia Pacific
- 5.4.4. Latin America
- 5.4.5. Middle East and Africa
- 5.1. Market Analysis, Insights and Forecast - by Deployment Type
- 6. North America Financial Analytics Industry Analysis, Insights and Forecast, 2019-2031
- 6.1. Market Analysis, Insights and Forecast - by Deployment Type
- 6.1.1. On-premise
- 6.1.2. Cloud
- 6.2. Market Analysis, Insights and Forecast - by Solution Type
- 6.2.1. Database Management and Planning
- 6.2.2. Analysis and Reporting
- 6.2.3. Other Type
- 6.3. Market Analysis, Insights and Forecast - by End-user Vertical
- 6.3.1. BFSI
- 6.3.2. Healthcare
- 6.3.3. Manufacturing
- 6.3.4. Government
- 6.3.5. IT and Telecom
- 6.3.6. Other End-user Verticals
- 6.1. Market Analysis, Insights and Forecast - by Deployment Type
- 7. Europe Financial Analytics Industry Analysis, Insights and Forecast, 2019-2031
- 7.1. Market Analysis, Insights and Forecast - by Deployment Type
- 7.1.1. On-premise
- 7.1.2. Cloud
- 7.2. Market Analysis, Insights and Forecast - by Solution Type
- 7.2.1. Database Management and Planning
- 7.2.2. Analysis and Reporting
- 7.2.3. Other Type
- 7.3. Market Analysis, Insights and Forecast - by End-user Vertical
- 7.3.1. BFSI
- 7.3.2. Healthcare
- 7.3.3. Manufacturing
- 7.3.4. Government
- 7.3.5. IT and Telecom
- 7.3.6. Other End-user Verticals
- 7.1. Market Analysis, Insights and Forecast - by Deployment Type
- 8. Asia Pacific Financial Analytics Industry Analysis, Insights and Forecast, 2019-2031
- 8.1. Market Analysis, Insights and Forecast - by Deployment Type
- 8.1.1. On-premise
- 8.1.2. Cloud
- 8.2. Market Analysis, Insights and Forecast - by Solution Type
- 8.2.1. Database Management and Planning
- 8.2.2. Analysis and Reporting
- 8.2.3. Other Type
- 8.3. Market Analysis, Insights and Forecast - by End-user Vertical
- 8.3.1. BFSI
- 8.3.2. Healthcare
- 8.3.3. Manufacturing
- 8.3.4. Government
- 8.3.5. IT and Telecom
- 8.3.6. Other End-user Verticals
- 8.1. Market Analysis, Insights and Forecast - by Deployment Type
- 9. Latin America Financial Analytics Industry Analysis, Insights and Forecast, 2019-2031
- 9.1. Market Analysis, Insights and Forecast - by Deployment Type
- 9.1.1. On-premise
- 9.1.2. Cloud
- 9.2. Market Analysis, Insights and Forecast - by Solution Type
- 9.2.1. Database Management and Planning
- 9.2.2. Analysis and Reporting
- 9.2.3. Other Type
- 9.3. Market Analysis, Insights and Forecast - by End-user Vertical
- 9.3.1. BFSI
- 9.3.2. Healthcare
- 9.3.3. Manufacturing
- 9.3.4. Government
- 9.3.5. IT and Telecom
- 9.3.6. Other End-user Verticals
- 9.1. Market Analysis, Insights and Forecast - by Deployment Type
- 10. Middle East and Africa Financial Analytics Industry Analysis, Insights and Forecast, 2019-2031
- 10.1. Market Analysis, Insights and Forecast - by Deployment Type
- 10.1.1. On-premise
- 10.1.2. Cloud
- 10.2. Market Analysis, Insights and Forecast - by Solution Type
- 10.2.1. Database Management and Planning
- 10.2.2. Analysis and Reporting
- 10.2.3. Other Type
- 10.3. Market Analysis, Insights and Forecast - by End-user Vertical
- 10.3.1. BFSI
- 10.3.2. Healthcare
- 10.3.3. Manufacturing
- 10.3.4. Government
- 10.3.5. IT and Telecom
- 10.3.6. Other End-user Verticals
- 10.1. Market Analysis, Insights and Forecast - by Deployment Type
- 11. North America Financial Analytics Industry Analysis, Insights and Forecast, 2019-2031
- 11.1. Market Analysis, Insights and Forecast - By Country/Sub-region
- 11.1.1 United States
- 11.1.2 Canada
- 11.1.3 Mexico
- 12. Europe Financial Analytics Industry Analysis, Insights and Forecast, 2019-2031
- 12.1. Market Analysis, Insights and Forecast - By Country/Sub-region
- 12.1.1 Germany
- 12.1.2 United Kingdom
- 12.1.3 France
- 12.1.4 Spain
- 12.1.5 Italy
- 12.1.6 Spain
- 12.1.7 Belgium
- 12.1.8 Netherland
- 12.1.9 Nordics
- 12.1.10 Rest of Europe
- 13. Asia Pacific Financial Analytics Industry Analysis, Insights and Forecast, 2019-2031
- 13.1. Market Analysis, Insights and Forecast - By Country/Sub-region
- 13.1.1 China
- 13.1.2 Japan
- 13.1.3 India
- 13.1.4 South Korea
- 13.1.5 Southeast Asia
- 13.1.6 Australia
- 13.1.7 Indonesia
- 13.1.8 Phillipes
- 13.1.9 Singapore
- 13.1.10 Thailandc
- 13.1.11 Rest of Asia Pacific
- 14. South America Financial Analytics Industry Analysis, Insights and Forecast, 2019-2031
- 14.1. Market Analysis, Insights and Forecast - By Country/Sub-region
- 14.1.1 Brazil
- 14.1.2 Argentina
- 14.1.3 Peru
- 14.1.4 Chile
- 14.1.5 Colombia
- 14.1.6 Ecuador
- 14.1.7 Venezuela
- 14.1.8 Rest of South America
- 15. North America Financial Analytics Industry Analysis, Insights and Forecast, 2019-2031
- 15.1. Market Analysis, Insights and Forecast - By Country/Sub-region
- 15.1.1 United States
- 15.1.2 Canada
- 15.1.3 Mexico
- 16. MEA Financial Analytics Industry Analysis, Insights and Forecast, 2019-2031
- 16.1. Market Analysis, Insights and Forecast - By Country/Sub-region
- 16.1.1 United Arab Emirates
- 16.1.2 Saudi Arabia
- 16.1.3 South Africa
- 16.1.4 Rest of Middle East and Africa
- 17. Competitive Analysis
- 17.1. Global Market Share Analysis 2024
- 17.2. Company Profiles
- 17.2.1 IBM Corporation
- 17.2.1.1. Overview
- 17.2.1.2. Products
- 17.2.1.3. SWOT Analysis
- 17.2.1.4. Recent Developments
- 17.2.1.5. Financials (Based on Availability)
- 17.2.2 Hitachi Vantara
- 17.2.2.1. Overview
- 17.2.2.2. Products
- 17.2.2.3. SWOT Analysis
- 17.2.2.4. Recent Developments
- 17.2.2.5. Financials (Based on Availability)
- 17.2.3 SAP SE
- 17.2.3.1. Overview
- 17.2.3.2. Products
- 17.2.3.3. SWOT Analysis
- 17.2.3.4. Recent Developments
- 17.2.3.5. Financials (Based on Availability)
- 17.2.4 Teradata Corporation
- 17.2.4.1. Overview
- 17.2.4.2. Products
- 17.2.4.3. SWOT Analysis
- 17.2.4.4. Recent Developments
- 17.2.4.5. Financials (Based on Availability)
- 17.2.5 Microsoft Corporation
- 17.2.5.1. Overview
- 17.2.5.2. Products
- 17.2.5.3. SWOT Analysis
- 17.2.5.4. Recent Developments
- 17.2.5.5. Financials (Based on Availability)
- 17.2.6 SAS Institute
- 17.2.6.1. Overview
- 17.2.6.2. Products
- 17.2.6.3. SWOT Analysis
- 17.2.6.4. Recent Developments
- 17.2.6.5. Financials (Based on Availability)
- 17.2.7 Oracle Corporation
- 17.2.7.1. Overview
- 17.2.7.2. Products
- 17.2.7.3. SWOT Analysis
- 17.2.7.4. Recent Developments
- 17.2.7.5. Financials (Based on Availability)
- 17.2.8 FICO
- 17.2.8.1. Overview
- 17.2.8.2. Products
- 17.2.8.3. SWOT Analysis
- 17.2.8.4. Recent Developments
- 17.2.8.5. Financials (Based on Availability)
- 17.2.1 IBM Corporation
List of Figures
- Figure 1: Global Financial Analytics Industry Revenue Breakdown (Million, %) by Region 2024 & 2032
- Figure 2: North America Financial Analytics Industry Revenue (Million), by Country 2024 & 2032
- Figure 3: North America Financial Analytics Industry Revenue Share (%), by Country 2024 & 2032
- Figure 4: Europe Financial Analytics Industry Revenue (Million), by Country 2024 & 2032
- Figure 5: Europe Financial Analytics Industry Revenue Share (%), by Country 2024 & 2032
- Figure 6: Asia Pacific Financial Analytics Industry Revenue (Million), by Country 2024 & 2032
- Figure 7: Asia Pacific Financial Analytics Industry Revenue Share (%), by Country 2024 & 2032
- Figure 8: South America Financial Analytics Industry Revenue (Million), by Country 2024 & 2032
- Figure 9: South America Financial Analytics Industry Revenue Share (%), by Country 2024 & 2032
- Figure 10: North America Financial Analytics Industry Revenue (Million), by Country 2024 & 2032
- Figure 11: North America Financial Analytics Industry Revenue Share (%), by Country 2024 & 2032
- Figure 12: MEA Financial Analytics Industry Revenue (Million), by Country 2024 & 2032
- Figure 13: MEA Financial Analytics Industry Revenue Share (%), by Country 2024 & 2032
- Figure 14: North America Financial Analytics Industry Revenue (Million), by Deployment Type 2024 & 2032
- Figure 15: North America Financial Analytics Industry Revenue Share (%), by Deployment Type 2024 & 2032
- Figure 16: North America Financial Analytics Industry Revenue (Million), by Solution Type 2024 & 2032
- Figure 17: North America Financial Analytics Industry Revenue Share (%), by Solution Type 2024 & 2032
- Figure 18: North America Financial Analytics Industry Revenue (Million), by End-user Vertical 2024 & 2032
- Figure 19: North America Financial Analytics Industry Revenue Share (%), by End-user Vertical 2024 & 2032
- Figure 20: North America Financial Analytics Industry Revenue (Million), by Country 2024 & 2032
- Figure 21: North America Financial Analytics Industry Revenue Share (%), by Country 2024 & 2032
- Figure 22: Europe Financial Analytics Industry Revenue (Million), by Deployment Type 2024 & 2032
- Figure 23: Europe Financial Analytics Industry Revenue Share (%), by Deployment Type 2024 & 2032
- Figure 24: Europe Financial Analytics Industry Revenue (Million), by Solution Type 2024 & 2032
- Figure 25: Europe Financial Analytics Industry Revenue Share (%), by Solution Type 2024 & 2032
- Figure 26: Europe Financial Analytics Industry Revenue (Million), by End-user Vertical 2024 & 2032
- Figure 27: Europe Financial Analytics Industry Revenue Share (%), by End-user Vertical 2024 & 2032
- Figure 28: Europe Financial Analytics Industry Revenue (Million), by Country 2024 & 2032
- Figure 29: Europe Financial Analytics Industry Revenue Share (%), by Country 2024 & 2032
- Figure 30: Asia Pacific Financial Analytics Industry Revenue (Million), by Deployment Type 2024 & 2032
- Figure 31: Asia Pacific Financial Analytics Industry Revenue Share (%), by Deployment Type 2024 & 2032
- Figure 32: Asia Pacific Financial Analytics Industry Revenue (Million), by Solution Type 2024 & 2032
- Figure 33: Asia Pacific Financial Analytics Industry Revenue Share (%), by Solution Type 2024 & 2032
- Figure 34: Asia Pacific Financial Analytics Industry Revenue (Million), by End-user Vertical 2024 & 2032
- Figure 35: Asia Pacific Financial Analytics Industry Revenue Share (%), by End-user Vertical 2024 & 2032
- Figure 36: Asia Pacific Financial Analytics Industry Revenue (Million), by Country 2024 & 2032
- Figure 37: Asia Pacific Financial Analytics Industry Revenue Share (%), by Country 2024 & 2032
- Figure 38: Latin America Financial Analytics Industry Revenue (Million), by Deployment Type 2024 & 2032
- Figure 39: Latin America Financial Analytics Industry Revenue Share (%), by Deployment Type 2024 & 2032
- Figure 40: Latin America Financial Analytics Industry Revenue (Million), by Solution Type 2024 & 2032
- Figure 41: Latin America Financial Analytics Industry Revenue Share (%), by Solution Type 2024 & 2032
- Figure 42: Latin America Financial Analytics Industry Revenue (Million), by End-user Vertical 2024 & 2032
- Figure 43: Latin America Financial Analytics Industry Revenue Share (%), by End-user Vertical 2024 & 2032
- Figure 44: Latin America Financial Analytics Industry Revenue (Million), by Country 2024 & 2032
- Figure 45: Latin America Financial Analytics Industry Revenue Share (%), by Country 2024 & 2032
- Figure 46: Middle East and Africa Financial Analytics Industry Revenue (Million), by Deployment Type 2024 & 2032
- Figure 47: Middle East and Africa Financial Analytics Industry Revenue Share (%), by Deployment Type 2024 & 2032
- Figure 48: Middle East and Africa Financial Analytics Industry Revenue (Million), by Solution Type 2024 & 2032
- Figure 49: Middle East and Africa Financial Analytics Industry Revenue Share (%), by Solution Type 2024 & 2032
- Figure 50: Middle East and Africa Financial Analytics Industry Revenue (Million), by End-user Vertical 2024 & 2032
- Figure 51: Middle East and Africa Financial Analytics Industry Revenue Share (%), by End-user Vertical 2024 & 2032
- Figure 52: Middle East and Africa Financial Analytics Industry Revenue (Million), by Country 2024 & 2032
- Figure 53: Middle East and Africa Financial Analytics Industry Revenue Share (%), by Country 2024 & 2032
List of Tables
- Table 1: Global Financial Analytics Industry Revenue Million Forecast, by Region 2019 & 2032
- Table 2: Global Financial Analytics Industry Revenue Million Forecast, by Deployment Type 2019 & 2032
- Table 3: Global Financial Analytics Industry Revenue Million Forecast, by Solution Type 2019 & 2032
- Table 4: Global Financial Analytics Industry Revenue Million Forecast, by End-user Vertical 2019 & 2032
- Table 5: Global Financial Analytics Industry Revenue Million Forecast, by Region 2019 & 2032
- Table 6: Global Financial Analytics Industry Revenue Million Forecast, by Country 2019 & 2032
- Table 7: United States Financial Analytics Industry Revenue (Million) Forecast, by Application 2019 & 2032
- Table 8: Canada Financial Analytics Industry Revenue (Million) Forecast, by Application 2019 & 2032
- Table 9: Mexico Financial Analytics Industry Revenue (Million) Forecast, by Application 2019 & 2032
- Table 10: Global Financial Analytics Industry Revenue Million Forecast, by Country 2019 & 2032
- Table 11: Germany Financial Analytics Industry Revenue (Million) Forecast, by Application 2019 & 2032
- Table 12: United Kingdom Financial Analytics Industry Revenue (Million) Forecast, by Application 2019 & 2032
- Table 13: France Financial Analytics Industry Revenue (Million) Forecast, by Application 2019 & 2032
- Table 14: Spain Financial Analytics Industry Revenue (Million) Forecast, by Application 2019 & 2032
- Table 15: Italy Financial Analytics Industry Revenue (Million) Forecast, by Application 2019 & 2032
- Table 16: Spain Financial Analytics Industry Revenue (Million) Forecast, by Application 2019 & 2032
- Table 17: Belgium Financial Analytics Industry Revenue (Million) Forecast, by Application 2019 & 2032
- Table 18: Netherland Financial Analytics Industry Revenue (Million) Forecast, by Application 2019 & 2032
- Table 19: Nordics Financial Analytics Industry Revenue (Million) Forecast, by Application 2019 & 2032
- Table 20: Rest of Europe Financial Analytics Industry Revenue (Million) Forecast, by Application 2019 & 2032
- Table 21: Global Financial Analytics Industry Revenue Million Forecast, by Country 2019 & 2032
- Table 22: China Financial Analytics Industry Revenue (Million) Forecast, by Application 2019 & 2032
- Table 23: Japan Financial Analytics Industry Revenue (Million) Forecast, by Application 2019 & 2032
- Table 24: India Financial Analytics Industry Revenue (Million) Forecast, by Application 2019 & 2032
- Table 25: South Korea Financial Analytics Industry Revenue (Million) Forecast, by Application 2019 & 2032
- Table 26: Southeast Asia Financial Analytics Industry Revenue (Million) Forecast, by Application 2019 & 2032
- Table 27: Australia Financial Analytics Industry Revenue (Million) Forecast, by Application 2019 & 2032
- Table 28: Indonesia Financial Analytics Industry Revenue (Million) Forecast, by Application 2019 & 2032
- Table 29: Phillipes Financial Analytics Industry Revenue (Million) Forecast, by Application 2019 & 2032
- Table 30: Singapore Financial Analytics Industry Revenue (Million) Forecast, by Application 2019 & 2032
- Table 31: Thailandc Financial Analytics Industry Revenue (Million) Forecast, by Application 2019 & 2032
- Table 32: Rest of Asia Pacific Financial Analytics Industry Revenue (Million) Forecast, by Application 2019 & 2032
- Table 33: Global Financial Analytics Industry Revenue Million Forecast, by Country 2019 & 2032
- Table 34: Brazil Financial Analytics Industry Revenue (Million) Forecast, by Application 2019 & 2032
- Table 35: Argentina Financial Analytics Industry Revenue (Million) Forecast, by Application 2019 & 2032
- Table 36: Peru Financial Analytics Industry Revenue (Million) Forecast, by Application 2019 & 2032
- Table 37: Chile Financial Analytics Industry Revenue (Million) Forecast, by Application 2019 & 2032
- Table 38: Colombia Financial Analytics Industry Revenue (Million) Forecast, by Application 2019 & 2032
- Table 39: Ecuador Financial Analytics Industry Revenue (Million) Forecast, by Application 2019 & 2032
- Table 40: Venezuela Financial Analytics Industry Revenue (Million) Forecast, by Application 2019 & 2032
- Table 41: Rest of South America Financial Analytics Industry Revenue (Million) Forecast, by Application 2019 & 2032
- Table 42: Global Financial Analytics Industry Revenue Million Forecast, by Country 2019 & 2032
- Table 43: United States Financial Analytics Industry Revenue (Million) Forecast, by Application 2019 & 2032
- Table 44: Canada Financial Analytics Industry Revenue (Million) Forecast, by Application 2019 & 2032
- Table 45: Mexico Financial Analytics Industry Revenue (Million) Forecast, by Application 2019 & 2032
- Table 46: Global Financial Analytics Industry Revenue Million Forecast, by Country 2019 & 2032
- Table 47: United Arab Emirates Financial Analytics Industry Revenue (Million) Forecast, by Application 2019 & 2032
- Table 48: Saudi Arabia Financial Analytics Industry Revenue (Million) Forecast, by Application 2019 & 2032
- Table 49: South Africa Financial Analytics Industry Revenue (Million) Forecast, by Application 2019 & 2032
- Table 50: Rest of Middle East and Africa Financial Analytics Industry Revenue (Million) Forecast, by Application 2019 & 2032
- Table 51: Global Financial Analytics Industry Revenue Million Forecast, by Deployment Type 2019 & 2032
- Table 52: Global Financial Analytics Industry Revenue Million Forecast, by Solution Type 2019 & 2032
- Table 53: Global Financial Analytics Industry Revenue Million Forecast, by End-user Vertical 2019 & 2032
- Table 54: Global Financial Analytics Industry Revenue Million Forecast, by Country 2019 & 2032
- Table 55: United States Financial Analytics Industry Revenue (Million) Forecast, by Application 2019 & 2032
- Table 56: Canada Financial Analytics Industry Revenue (Million) Forecast, by Application 2019 & 2032
- Table 57: Global Financial Analytics Industry Revenue Million Forecast, by Deployment Type 2019 & 2032
- Table 58: Global Financial Analytics Industry Revenue Million Forecast, by Solution Type 2019 & 2032
- Table 59: Global Financial Analytics Industry Revenue Million Forecast, by End-user Vertical 2019 & 2032
- Table 60: Global Financial Analytics Industry Revenue Million Forecast, by Country 2019 & 2032
- Table 61: United Kingdom Financial Analytics Industry Revenue (Million) Forecast, by Application 2019 & 2032
- Table 62: Germany Financial Analytics Industry Revenue (Million) Forecast, by Application 2019 & 2032
- Table 63: France Financial Analytics Industry Revenue (Million) Forecast, by Application 2019 & 2032
- Table 64: Rest of Europe Financial Analytics Industry Revenue (Million) Forecast, by Application 2019 & 2032
- Table 65: Global Financial Analytics Industry Revenue Million Forecast, by Deployment Type 2019 & 2032
- Table 66: Global Financial Analytics Industry Revenue Million Forecast, by Solution Type 2019 & 2032
- Table 67: Global Financial Analytics Industry Revenue Million Forecast, by End-user Vertical 2019 & 2032
- Table 68: Global Financial Analytics Industry Revenue Million Forecast, by Country 2019 & 2032
- Table 69: China Financial Analytics Industry Revenue (Million) Forecast, by Application 2019 & 2032
- Table 70: Japan Financial Analytics Industry Revenue (Million) Forecast, by Application 2019 & 2032
- Table 71: Singapore Financial Analytics Industry Revenue (Million) Forecast, by Application 2019 & 2032
- Table 72: India Financial Analytics Industry Revenue (Million) Forecast, by Application 2019 & 2032
- Table 73: South Korea Financial Analytics Industry Revenue (Million) Forecast, by Application 2019 & 2032
- Table 74: Rest of Asia Pacific Financial Analytics Industry Revenue (Million) Forecast, by Application 2019 & 2032
- Table 75: Global Financial Analytics Industry Revenue Million Forecast, by Deployment Type 2019 & 2032
- Table 76: Global Financial Analytics Industry Revenue Million Forecast, by Solution Type 2019 & 2032
- Table 77: Global Financial Analytics Industry Revenue Million Forecast, by End-user Vertical 2019 & 2032
- Table 78: Global Financial Analytics Industry Revenue Million Forecast, by Country 2019 & 2032
- Table 79: Mexico Financial Analytics Industry Revenue (Million) Forecast, by Application 2019 & 2032
- Table 80: Brazil Financial Analytics Industry Revenue (Million) Forecast, by Application 2019 & 2032
- Table 81: Rest of Latin America Financial Analytics Industry Revenue (Million) Forecast, by Application 2019 & 2032
- Table 82: Global Financial Analytics Industry Revenue Million Forecast, by Deployment Type 2019 & 2032
- Table 83: Global Financial Analytics Industry Revenue Million Forecast, by Solution Type 2019 & 2032
- Table 84: Global Financial Analytics Industry Revenue Million Forecast, by End-user Vertical 2019 & 2032
- Table 85: Global Financial Analytics Industry Revenue Million Forecast, by Country 2019 & 2032
- Table 86: United Arab Emirates Financial Analytics Industry Revenue (Million) Forecast, by Application 2019 & 2032
- Table 87: South Africa Financial Analytics Industry Revenue (Million) Forecast, by Application 2019 & 2032
- Table 88: Rest of Middle East and Africa Financial Analytics Industry Revenue (Million) Forecast, by Application 2019 & 2032
Frequently Asked Questions
1. What is the projected Compound Annual Growth Rate (CAGR) of the Financial Analytics Industry?
The projected CAGR is approximately 12.25%.
2. Which companies are prominent players in the Financial Analytics Industry?
Key companies in the market include IBM Corporation, Hitachi Vantara, SAP SE, Teradata Corporation, Microsoft Corporation, SAS Institute, Oracle Corporation, FICO.
3. What are the main segments of the Financial Analytics Industry?
The market segments include Deployment Type, Solution Type, End-user Vertical.
4. Can you provide details about the market size?
The market size is estimated to be USD 10.83 Million as of 2022.
5. What are some drivers contributing to market growth?
Advancement in BI and Business Analytics Tools; Growing Focus on Data Driven Financial Decisions in End Users.
6. What are the notable trends driving market growth?
Cloud Based Solutions are Expected to Gain Significant Traction.
7. Are there any restraints impacting market growth?
Lack of Awareness Regarding Fraud Detection Solutions.
8. Can you provide examples of recent developments in the market?
July 2023 - Dobin, an AI-powered FinTech solution, announced its launch. Dobin is the first Southeast Asian company to use open finance and advanced data analytics to give users a single view of their finances, create unique anonymized customer insights, and empower users to get value from their financial data.
9. What pricing options are available for accessing the report?
Pricing options include single-user, multi-user, and enterprise licenses priced at USD 4750, USD 5250, and USD 8750 respectively.
10. Is the market size provided in terms of value or volume?
The market size is provided in terms of value, measured in Million.
11. Are there any specific market keywords associated with the report?
Yes, the market keyword associated with the report is "Financial Analytics Industry," which aids in identifying and referencing the specific market segment covered.
12. How do I determine which pricing option suits my needs best?
The pricing options vary based on user requirements and access needs. Individual users may opt for single-user licenses, while businesses requiring broader access may choose multi-user or enterprise licenses for cost-effective access to the report.
13. Are there any additional resources or data provided in the Financial Analytics Industry report?
While the report offers comprehensive insights, it's advisable to review the specific contents or supplementary materials provided to ascertain if additional resources or data are available.
14. How can I stay updated on further developments or reports in the Financial Analytics Industry?
To stay informed about further developments, trends, and reports in the Financial Analytics Industry, consider subscribing to industry newsletters, following relevant companies and organizations, or regularly checking reputable industry news sources and publications.
Methodology
Step 1 - Identification of Relevant Samples Size from Population Database


Step 2 - Approaches for Defining Global Market Size (Value, Volume* & Price*)

Note*: In applicable scenarios
Step 3 - Data Sources
Primary Research
- Web Analytics
- Survey Reports
- Research Institute
- Latest Research Reports
- Opinion Leaders
Secondary Research
- Annual Reports
- White Paper
- Latest Press Release
- Industry Association
- Paid Database
- Investor Presentations

Step 4 - Data Triangulation
Involves using different sources of information in order to increase the validity of a study
These sources are likely to be stakeholders in a program - participants, other researchers, program staff, other community members, and so on.
Then we put all data in single framework & apply various statistical tools to find out the dynamic on the market.
During the analysis stage, feedback from the stakeholder groups would be compared to determine areas of agreement as well as areas of divergence


