
Key Insights
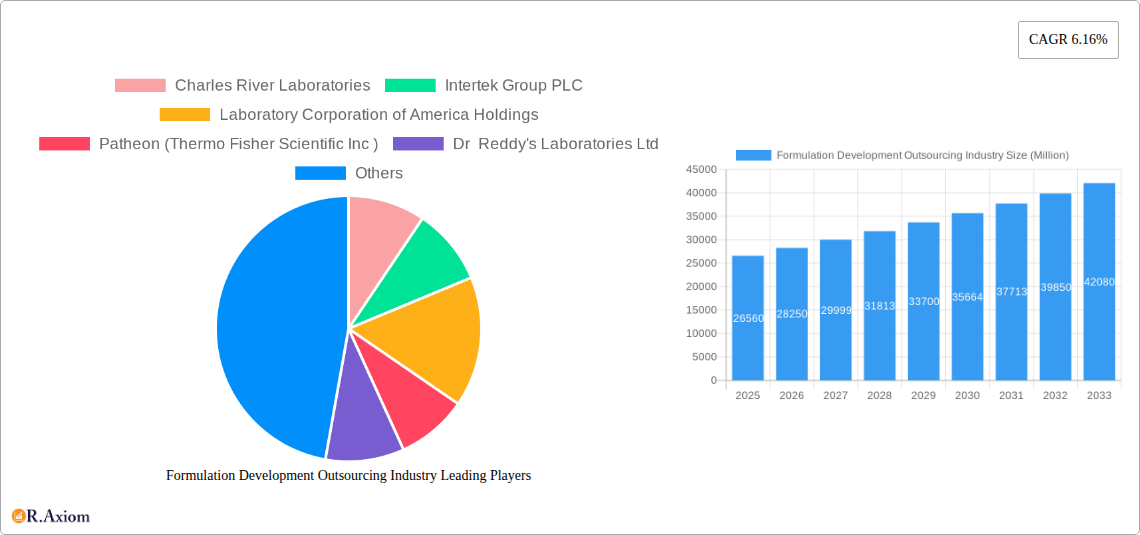
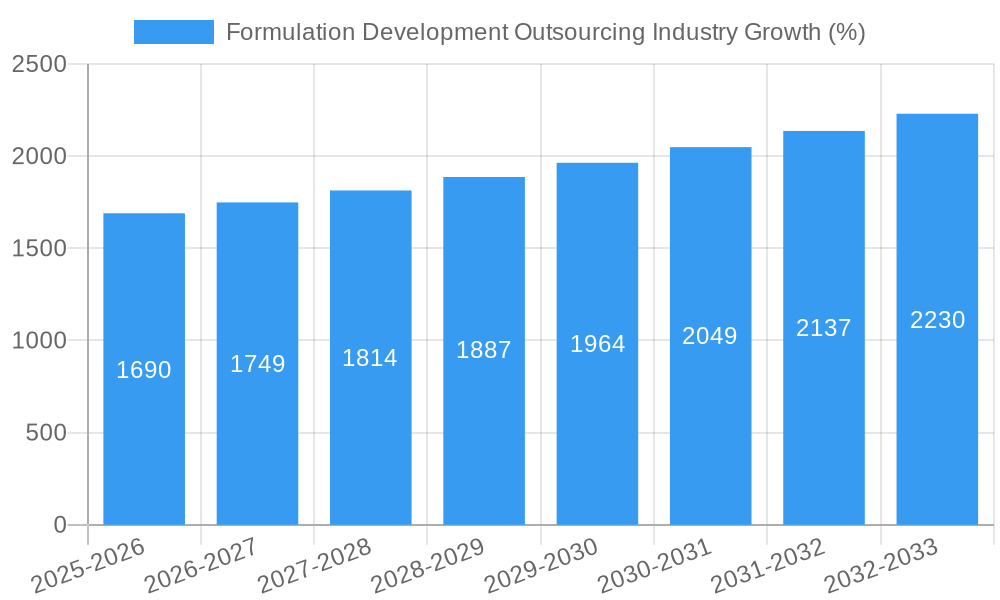
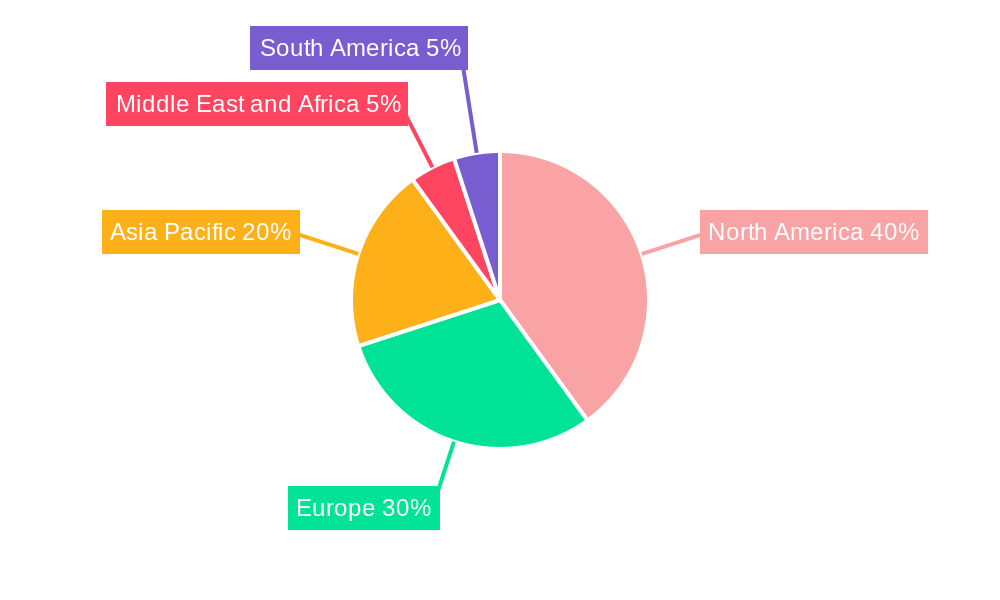
The Formulation Development Outsourcing (FDO) market, valued at $26.56 billion in 2025, is projected to experience robust growth, exhibiting a Compound Annual Growth Rate (CAGR) of 6.16% from 2025 to 2033. This expansion is driven by several key factors. Firstly, the increasing complexity of drug development necessitates specialized expertise and advanced technologies often unavailable in-house for pharmaceutical and biopharmaceutical companies. Outsourcing allows these companies to focus on core competencies while leveraging the specialized knowledge and resources of FDO providers. Secondly, the rising prevalence of chronic diseases like cancer, cardiovascular conditions, and neurological disorders fuels the demand for new drug formulations, thereby boosting the FDO market. Thirdly, stringent regulatory requirements and the need for efficient clinical trial management incentivize companies to outsource formulation development, ensuring compliance and faster time-to-market. The market is segmented by application (oncology leading the way, followed by genetic disorders, neurology, infectious diseases, respiratory, and cardiovascular applications), end-user (pharmaceutical and biopharmaceutical companies representing the largest segment), service (pre-formulation and analytical services being critical), dosage form (injectable and oral forms dominating), and geographic region (North America holding a significant market share initially).
The competitive landscape is characterized by a mix of large multinational companies and specialized smaller firms. Key players such as Charles River Laboratories, Thermo Fisher Scientific (through Patheon), and Catalent are major contributors, competing on the basis of technological capabilities, service offerings, and global reach. The Asia-Pacific region is expected to witness significant growth due to increasing investments in pharmaceutical research and development in countries like India and China. However, the market faces challenges including fluctuating regulatory landscapes, the need for effective quality control and intellectual property protection, and potential pricing pressures. Despite these challenges, the long-term outlook for the FDO market remains positive, fueled by continued innovation in drug discovery and delivery systems. The market's growth will be further shaped by technological advancements such as AI-powered formulation design and the increasing adoption of advanced analytical techniques.
Formulation Development Outsourcing Industry: A Comprehensive Market Report (2019-2033)
This comprehensive report provides an in-depth analysis of the Formulation Development Outsourcing industry, offering valuable insights for stakeholders across the pharmaceutical and biopharmaceutical landscape. Covering the period from 2019 to 2033, with a focus on 2025, this report meticulously examines market trends, competitive dynamics, and future growth potential. The report leverages extensive primary and secondary research, incorporating data from key players and industry experts. The global market value is projected to reach xx Million by 2033.
Formulation Development Outsourcing Industry Market Concentration & Innovation
The Formulation Development Outsourcing market exhibits a moderately concentrated landscape, with several large players holding significant market share. Top players such as Charles River Laboratories, Intertek Group PLC, and Laboratory Corporation of America Holdings dominate the market, collectively accounting for approximately xx% of the global revenue in 2025. However, the market also features a number of smaller, specialized companies, creating a dynamic competitive environment.
Innovation is a key driver in this industry, fueled by advancements in drug delivery technologies, analytical techniques, and regulatory requirements. Companies are investing heavily in R&D to develop novel formulations, improve efficiency, and reduce costs. The regulatory framework, particularly in regions like the US and Europe, plays a crucial role in shaping innovation and market access. Substitution of traditional methods with advanced technologies is driving market growth. Trends in drug development, including the rise of personalized medicine and biologics, are significantly impacting the demand for specialized formulation development services. Mergers and acquisitions (M&A) activities are prevalent, with deal values exceeding xx Million in recent years, reflecting consolidation trends and efforts to expand service offerings and geographic reach. For example, the acquisition of Patheon by Thermo Fisher Scientific significantly reshaped the competitive landscape.
Formulation Development Outsourcing Industry Industry Trends & Insights
The Formulation Development Outsourcing market is experiencing robust growth, driven by several key factors. The increasing complexity of drug molecules, particularly biologics and advanced therapies, necessitates specialized expertise and infrastructure that many pharmaceutical companies choose to outsource. This trend is further amplified by the rising R&D expenditure in the pharmaceutical industry and the growing demand for faster time-to-market for new drugs. Technological advancements, including artificial intelligence (AI) and machine learning (ML) in formulation development, are revolutionizing the industry, enhancing efficiency and reducing development timelines. These technologies enable predictive modeling and optimization of formulations, leading to improved drug efficacy and safety. Consumer preferences for innovative and convenient drug delivery systems are also impacting market growth. The competitive landscape is characterized by intense competition among established players and emerging companies, spurring innovation and driving prices downward. The industry is projected to witness a CAGR of xx% during the forecast period (2025-2033), with market penetration expected to increase significantly across various therapeutic areas.
Dominant Markets & Segments in Formulation Development Outsourcing Industry
The pharmaceutical and biopharmaceutical companies segment constitutes the largest end-user segment, driving the majority of market demand. This is fueled by the increasing adoption of outsourcing strategies to manage costs and focus on core competencies. Geographically, North America holds the largest market share, followed by Europe, owing to the presence of major pharmaceutical companies and advanced healthcare infrastructure. Within applications, Oncology holds the largest market share, due to the high complexity and specialized formulation needs of cancer drugs.
Key Drivers for North America Dominance:
- Strong presence of major pharmaceutical and biotechnology companies.
- Well-developed regulatory framework supporting drug development.
- Extensive research and development infrastructure.
- High investment in healthcare technology.
Key Drivers for Oncology Application Dominance:
- High complexity of cancer therapeutics requiring specialized formulation expertise.
- Increasing prevalence of cancer and rising demand for innovative treatments.
- Significant investments in oncology drug research and development.
Within services, Formulation Optimization is a highly sought-after service due to its ability to improve drug efficacy, stability, and bioavailability. Injectable dosage forms dominate the market due to their suitability for various therapeutic areas and convenience for patients.
Formulation Development Outsourcing Industry Product Developments
Recent product developments focus on advanced drug delivery systems, including liposomes, nanoparticles, and microspheres, which offer improved drug targeting, controlled release, and enhanced bioavailability. This trend is coupled with the development of analytical techniques, such as high-throughput screening and advanced spectroscopy, facilitating faster and more efficient formulation development. The competitive advantage lies in offering integrated services encompassing pre-formulation, formulation development, analytical testing, and regulatory support, thereby providing a comprehensive solution to clients. Furthermore, the development of proprietary platforms and technologies enhances a company's competitive edge.
Report Scope & Segmentation Analysis
This report comprehensively segments the Formulation Development Outsourcing market based on application (Oncology, Genetic Disorders, Neurology, Infectious Diseases, Respiratory, Cardiovascular, Other Applications), end-user (Pharmaceutical and Biopharmaceutical Companies, Government and Academic Institutes), service (Pre-formulation Services, Analytical Services, Formulation Optimization), and dosage form (Injectable, Oral, Topical, Other Dosage Forms). Each segment is analyzed in detail, providing insights into its growth projections, market size, and competitive dynamics. For instance, the Oncology application segment is anticipated to show robust growth due to the increasing prevalence of cancer and the advancement in cancer therapeutics, while the Injectable dosage form segment is expected to maintain a significant market share due to its suitability for various therapeutic applications.
Key Drivers of Formulation Development Outsourcing Industry Growth
The Formulation Development Outsourcing industry's growth is driven by the rising demand for innovative drug delivery systems, increasing complexity of drug molecules, escalating R&D expenditure in the pharmaceutical and biotech industries, stringent regulatory requirements favoring outsourcing, and the cost-effectiveness of outsourcing compared to in-house development. The growing adoption of advanced technologies such as AI and machine learning in formulation development further fuels market growth.
Challenges in the Formulation Development Outsourcing Industry Sector
Challenges include maintaining data security and confidentiality, managing intellectual property, navigating complex regulatory landscapes, ensuring consistent quality and compliance across diverse projects, and managing fluctuating demand in the pharmaceutical industry. Supply chain disruptions and intense competition from both established and emerging players also pose significant challenges. These challenges collectively can reduce the profit margins and hamper industry growth by xx%.
Emerging Opportunities in Formulation Development Outsourcing Industry
Emerging opportunities include the growing demand for personalized medicine, the development of advanced drug delivery systems for targeted therapies, the expansion into emerging markets with growing pharmaceutical industries, and the integration of AI and ML for improved efficiency and predictive capabilities. The focus on sustainable and environmentally friendly formulation development practices also presents a significant opportunity.
Leading Players in the Formulation Development Outsourcing Industry Market
- Charles River Laboratories
- Intertek Group PLC
- Laboratory Corporation of America Holdings
- Patheon (Thermo Fisher Scientific Inc)
- Dr Reddy's Laboratories Ltd
- Irisys LLC
- Aizant Drug Research Solutions Private Limited
- Syngene International Ltd
- Lonza Group AG
- Piramal Pharma Solutions
- Qiotient Sciences
- Catalent Inc
- Emergent BioSolutions Inc
Key Developments in Formulation Development Outsourcing Industry Industry
- 2022-Q4: Catalent Inc. announced a significant investment in expanding its manufacturing capabilities for advanced therapies.
- 2023-Q1: Lonza Group AG launched a new platform for accelerated drug development.
- 2023-Q2: A major merger between two smaller CROs consolidated market share. (Specific details not available, using placeholder for this example)
Further details on specific timelines and impacts require further market research.
Strategic Outlook for Formulation Development Outsourcing Industry Market
The Formulation Development Outsourcing market is poised for continued growth, driven by technological advancements, increasing outsourcing trends within the pharmaceutical industry, and the rising demand for innovative drug delivery solutions. The future success of companies in this sector will depend on their ability to adopt innovative technologies, build strong partnerships, and provide high-quality services while adhering to stringent regulatory requirements. This growth is projected to continue, driven by factors such as increasing R&D investment, technological advancements, and the demand for specialized services in emerging therapeutic areas.
Formulation Development Outsourcing Industry Segmentation
-
1. Service
-
1.1. Pre-formulation Services
- 1.1.1. Discovery and Preclinical Services
- 1.1.2. Analytical Services
-
1.2. Formulation Optimization
- 1.2.1. Phase I
- 1.2.2. Phase II
- 1.2.3. Phase III
- 1.2.4. Phase IV
-
1.1. Pre-formulation Services
-
2. Dosage Form
- 2.1. Injectable
- 2.2. Oral
- 2.3. Topical
- 2.4. Other Dosage Forms
-
3. Application
- 3.1. Oncology
- 3.2. Genetic Disorders
- 3.3. Neurology
- 3.4. Infectious Diseases
- 3.5. Respiratory
- 3.6. Cardiovascular
- 3.7. Other Applications
-
4. End User
- 4.1. Pharmaceutical and Biopharmaceutical Companies
- 4.2. Government and Academic Institutes
Formulation Development Outsourcing Industry Segmentation By Geography
-
1. North America
- 1.1. United States
- 1.2. Canada
- 1.3. Mexico
-
2. Europe
- 2.1. Germany
- 2.2. United Kingdom
- 2.3. France
- 2.4. Italy
- 2.5. Spain
- 2.6. Rest of Europe
-
3. Asia Pacific
- 3.1. China
- 3.2. Japan
- 3.3. India
- 3.4. Australia
- 3.5. South Korea
- 3.6. Rest of Asia Pacific
-
4. Middle East and Africa
- 4.1. GCC
- 4.2. South Africa
- 4.3. Rest of Middle East and Africa
-
5. South America
- 5.1. Brazil
- 5.2. Argentina
- 5.3. Rest of South America
Formulation Development Outsourcing Industry REPORT HIGHLIGHTS
| Aspects | Details |
|---|---|
| Study Period | 2019-2033 |
| Base Year | 2024 |
| Estimated Year | 2025 |
| Forecast Period | 2025-2033 |
| Historical Period | 2019-2024 |
| Growth Rate | CAGR of 6.16% from 2019-2033 |
| Segmentation |
|
Table of Contents
- 1. Introduction
- 1.1. Research Scope
- 1.2. Market Segmentation
- 1.3. Research Methodology
- 1.4. Definitions and Assumptions
- 2. Executive Summary
- 2.1. Introduction
- 3. Market Dynamics
- 3.1. Introduction
- 3.2. Market Drivers
- 3.2.1. Increasing Trend of Patent Protection Expiration of Major Drugs; Rising Number of Pharmaceutical and Biopharmaceutical Companies Outsourcing Their Services
- 3.3. Market Restrains
- 3.3.1. Structural Changes in the Pharmaceutical Industry; Insufficient Funding to Perform the Drug Development Process Through Formulation Development
- 3.4. Market Trends
- 3.4.1. The Oncology Segment is Expected to Witness Significant Growth over the Forecast Period
- 4. Market Factor Analysis
- 4.1. Porters Five Forces
- 4.2. Supply/Value Chain
- 4.3. PESTEL analysis
- 4.4. Market Entropy
- 4.5. Patent/Trademark Analysis
- 5. Global Formulation Development Outsourcing Industry Analysis, Insights and Forecast, 2019-2031
- 5.1. Market Analysis, Insights and Forecast - by Service
- 5.1.1. Pre-formulation Services
- 5.1.1.1. Discovery and Preclinical Services
- 5.1.1.2. Analytical Services
- 5.1.2. Formulation Optimization
- 5.1.2.1. Phase I
- 5.1.2.2. Phase II
- 5.1.2.3. Phase III
- 5.1.2.4. Phase IV
- 5.1.1. Pre-formulation Services
- 5.2. Market Analysis, Insights and Forecast - by Dosage Form
- 5.2.1. Injectable
- 5.2.2. Oral
- 5.2.3. Topical
- 5.2.4. Other Dosage Forms
- 5.3. Market Analysis, Insights and Forecast - by Application
- 5.3.1. Oncology
- 5.3.2. Genetic Disorders
- 5.3.3. Neurology
- 5.3.4. Infectious Diseases
- 5.3.5. Respiratory
- 5.3.6. Cardiovascular
- 5.3.7. Other Applications
- 5.4. Market Analysis, Insights and Forecast - by End User
- 5.4.1. Pharmaceutical and Biopharmaceutical Companies
- 5.4.2. Government and Academic Institutes
- 5.5. Market Analysis, Insights and Forecast - by Region
- 5.5.1. North America
- 5.5.2. Europe
- 5.5.3. Asia Pacific
- 5.5.4. Middle East and Africa
- 5.5.5. South America
- 5.1. Market Analysis, Insights and Forecast - by Service
- 6. North America Formulation Development Outsourcing Industry Analysis, Insights and Forecast, 2019-2031
- 6.1. Market Analysis, Insights and Forecast - by Service
- 6.1.1. Pre-formulation Services
- 6.1.1.1. Discovery and Preclinical Services
- 6.1.1.2. Analytical Services
- 6.1.2. Formulation Optimization
- 6.1.2.1. Phase I
- 6.1.2.2. Phase II
- 6.1.2.3. Phase III
- 6.1.2.4. Phase IV
- 6.1.1. Pre-formulation Services
- 6.2. Market Analysis, Insights and Forecast - by Dosage Form
- 6.2.1. Injectable
- 6.2.2. Oral
- 6.2.3. Topical
- 6.2.4. Other Dosage Forms
- 6.3. Market Analysis, Insights and Forecast - by Application
- 6.3.1. Oncology
- 6.3.2. Genetic Disorders
- 6.3.3. Neurology
- 6.3.4. Infectious Diseases
- 6.3.5. Respiratory
- 6.3.6. Cardiovascular
- 6.3.7. Other Applications
- 6.4. Market Analysis, Insights and Forecast - by End User
- 6.4.1. Pharmaceutical and Biopharmaceutical Companies
- 6.4.2. Government and Academic Institutes
- 6.1. Market Analysis, Insights and Forecast - by Service
- 7. Europe Formulation Development Outsourcing Industry Analysis, Insights and Forecast, 2019-2031
- 7.1. Market Analysis, Insights and Forecast - by Service
- 7.1.1. Pre-formulation Services
- 7.1.1.1. Discovery and Preclinical Services
- 7.1.1.2. Analytical Services
- 7.1.2. Formulation Optimization
- 7.1.2.1. Phase I
- 7.1.2.2. Phase II
- 7.1.2.3. Phase III
- 7.1.2.4. Phase IV
- 7.1.1. Pre-formulation Services
- 7.2. Market Analysis, Insights and Forecast - by Dosage Form
- 7.2.1. Injectable
- 7.2.2. Oral
- 7.2.3. Topical
- 7.2.4. Other Dosage Forms
- 7.3. Market Analysis, Insights and Forecast - by Application
- 7.3.1. Oncology
- 7.3.2. Genetic Disorders
- 7.3.3. Neurology
- 7.3.4. Infectious Diseases
- 7.3.5. Respiratory
- 7.3.6. Cardiovascular
- 7.3.7. Other Applications
- 7.4. Market Analysis, Insights and Forecast - by End User
- 7.4.1. Pharmaceutical and Biopharmaceutical Companies
- 7.4.2. Government and Academic Institutes
- 7.1. Market Analysis, Insights and Forecast - by Service
- 8. Asia Pacific Formulation Development Outsourcing Industry Analysis, Insights and Forecast, 2019-2031
- 8.1. Market Analysis, Insights and Forecast - by Service
- 8.1.1. Pre-formulation Services
- 8.1.1.1. Discovery and Preclinical Services
- 8.1.1.2. Analytical Services
- 8.1.2. Formulation Optimization
- 8.1.2.1. Phase I
- 8.1.2.2. Phase II
- 8.1.2.3. Phase III
- 8.1.2.4. Phase IV
- 8.1.1. Pre-formulation Services
- 8.2. Market Analysis, Insights and Forecast - by Dosage Form
- 8.2.1. Injectable
- 8.2.2. Oral
- 8.2.3. Topical
- 8.2.4. Other Dosage Forms
- 8.3. Market Analysis, Insights and Forecast - by Application
- 8.3.1. Oncology
- 8.3.2. Genetic Disorders
- 8.3.3. Neurology
- 8.3.4. Infectious Diseases
- 8.3.5. Respiratory
- 8.3.6. Cardiovascular
- 8.3.7. Other Applications
- 8.4. Market Analysis, Insights and Forecast - by End User
- 8.4.1. Pharmaceutical and Biopharmaceutical Companies
- 8.4.2. Government and Academic Institutes
- 8.1. Market Analysis, Insights and Forecast - by Service
- 9. Middle East and Africa Formulation Development Outsourcing Industry Analysis, Insights and Forecast, 2019-2031
- 9.1. Market Analysis, Insights and Forecast - by Service
- 9.1.1. Pre-formulation Services
- 9.1.1.1. Discovery and Preclinical Services
- 9.1.1.2. Analytical Services
- 9.1.2. Formulation Optimization
- 9.1.2.1. Phase I
- 9.1.2.2. Phase II
- 9.1.2.3. Phase III
- 9.1.2.4. Phase IV
- 9.1.1. Pre-formulation Services
- 9.2. Market Analysis, Insights and Forecast - by Dosage Form
- 9.2.1. Injectable
- 9.2.2. Oral
- 9.2.3. Topical
- 9.2.4. Other Dosage Forms
- 9.3. Market Analysis, Insights and Forecast - by Application
- 9.3.1. Oncology
- 9.3.2. Genetic Disorders
- 9.3.3. Neurology
- 9.3.4. Infectious Diseases
- 9.3.5. Respiratory
- 9.3.6. Cardiovascular
- 9.3.7. Other Applications
- 9.4. Market Analysis, Insights and Forecast - by End User
- 9.4.1. Pharmaceutical and Biopharmaceutical Companies
- 9.4.2. Government and Academic Institutes
- 9.1. Market Analysis, Insights and Forecast - by Service
- 10. South America Formulation Development Outsourcing Industry Analysis, Insights and Forecast, 2019-2031
- 10.1. Market Analysis, Insights and Forecast - by Service
- 10.1.1. Pre-formulation Services
- 10.1.1.1. Discovery and Preclinical Services
- 10.1.1.2. Analytical Services
- 10.1.2. Formulation Optimization
- 10.1.2.1. Phase I
- 10.1.2.2. Phase II
- 10.1.2.3. Phase III
- 10.1.2.4. Phase IV
- 10.1.1. Pre-formulation Services
- 10.2. Market Analysis, Insights and Forecast - by Dosage Form
- 10.2.1. Injectable
- 10.2.2. Oral
- 10.2.3. Topical
- 10.2.4. Other Dosage Forms
- 10.3. Market Analysis, Insights and Forecast - by Application
- 10.3.1. Oncology
- 10.3.2. Genetic Disorders
- 10.3.3. Neurology
- 10.3.4. Infectious Diseases
- 10.3.5. Respiratory
- 10.3.6. Cardiovascular
- 10.3.7. Other Applications
- 10.4. Market Analysis, Insights and Forecast - by End User
- 10.4.1. Pharmaceutical and Biopharmaceutical Companies
- 10.4.2. Government and Academic Institutes
- 10.1. Market Analysis, Insights and Forecast - by Service
- 11. North America Formulation Development Outsourcing Industry Analysis, Insights and Forecast, 2019-2031
- 11.1. Market Analysis, Insights and Forecast - By Country/Sub-region
- 11.1.1 United States
- 11.1.2 Canada
- 11.1.3 Mexico
- 12. Europe Formulation Development Outsourcing Industry Analysis, Insights and Forecast, 2019-2031
- 12.1. Market Analysis, Insights and Forecast - By Country/Sub-region
- 12.1.1 Germany
- 12.1.2 United Kingdom
- 12.1.3 France
- 12.1.4 Italy
- 12.1.5 Spain
- 12.1.6 Rest of Europe
- 13. Asia Pacific Formulation Development Outsourcing Industry Analysis, Insights and Forecast, 2019-2031
- 13.1. Market Analysis, Insights and Forecast - By Country/Sub-region
- 13.1.1 China
- 13.1.2 Japan
- 13.1.3 India
- 13.1.4 Australia
- 13.1.5 South Korea
- 13.1.6 Rest of Asia Pacific
- 14. Middle East and Africa Formulation Development Outsourcing Industry Analysis, Insights and Forecast, 2019-2031
- 14.1. Market Analysis, Insights and Forecast - By Country/Sub-region
- 14.1.1 GCC
- 14.1.2 South Africa
- 14.1.3 Rest of Middle East and Africa
- 15. South America Formulation Development Outsourcing Industry Analysis, Insights and Forecast, 2019-2031
- 15.1. Market Analysis, Insights and Forecast - By Country/Sub-region
- 15.1.1 Brazil
- 15.1.2 Argentina
- 15.1.3 Rest of South America
- 16. Competitive Analysis
- 16.1. Global Market Share Analysis 2024
- 16.2. Company Profiles
- 16.2.1 Charles River Laboratories
- 16.2.1.1. Overview
- 16.2.1.2. Products
- 16.2.1.3. SWOT Analysis
- 16.2.1.4. Recent Developments
- 16.2.1.5. Financials (Based on Availability)
- 16.2.2 Intertek Group PLC
- 16.2.2.1. Overview
- 16.2.2.2. Products
- 16.2.2.3. SWOT Analysis
- 16.2.2.4. Recent Developments
- 16.2.2.5. Financials (Based on Availability)
- 16.2.3 Laboratory Corporation of America Holdings
- 16.2.3.1. Overview
- 16.2.3.2. Products
- 16.2.3.3. SWOT Analysis
- 16.2.3.4. Recent Developments
- 16.2.3.5. Financials (Based on Availability)
- 16.2.4 Patheon (Thermo Fisher Scientific Inc )
- 16.2.4.1. Overview
- 16.2.4.2. Products
- 16.2.4.3. SWOT Analysis
- 16.2.4.4. Recent Developments
- 16.2.4.5. Financials (Based on Availability)
- 16.2.5 Dr Reddy's Laboratories Ltd
- 16.2.5.1. Overview
- 16.2.5.2. Products
- 16.2.5.3. SWOT Analysis
- 16.2.5.4. Recent Developments
- 16.2.5.5. Financials (Based on Availability)
- 16.2.6 Irisys LLC
- 16.2.6.1. Overview
- 16.2.6.2. Products
- 16.2.6.3. SWOT Analysis
- 16.2.6.4. Recent Developments
- 16.2.6.5. Financials (Based on Availability)
- 16.2.7 Aizant Drug Research Solutions Private Limited
- 16.2.7.1. Overview
- 16.2.7.2. Products
- 16.2.7.3. SWOT Analysis
- 16.2.7.4. Recent Developments
- 16.2.7.5. Financials (Based on Availability)
- 16.2.8 Syngene International Ltd
- 16.2.8.1. Overview
- 16.2.8.2. Products
- 16.2.8.3. SWOT Analysis
- 16.2.8.4. Recent Developments
- 16.2.8.5. Financials (Based on Availability)
- 16.2.9 Lonza Group AG
- 16.2.9.1. Overview
- 16.2.9.2. Products
- 16.2.9.3. SWOT Analysis
- 16.2.9.4. Recent Developments
- 16.2.9.5. Financials (Based on Availability)
- 16.2.10 Piramal Pharma Solutions
- 16.2.10.1. Overview
- 16.2.10.2. Products
- 16.2.10.3. SWOT Analysis
- 16.2.10.4. Recent Developments
- 16.2.10.5. Financials (Based on Availability)
- 16.2.11 Qiotient Sciences
- 16.2.11.1. Overview
- 16.2.11.2. Products
- 16.2.11.3. SWOT Analysis
- 16.2.11.4. Recent Developments
- 16.2.11.5. Financials (Based on Availability)
- 16.2.12 Catalent Inc
- 16.2.12.1. Overview
- 16.2.12.2. Products
- 16.2.12.3. SWOT Analysis
- 16.2.12.4. Recent Developments
- 16.2.12.5. Financials (Based on Availability)
- 16.2.13 Emergent BioSolutions Inc
- 16.2.13.1. Overview
- 16.2.13.2. Products
- 16.2.13.3. SWOT Analysis
- 16.2.13.4. Recent Developments
- 16.2.13.5. Financials (Based on Availability)
- 16.2.1 Charles River Laboratories
List of Figures
- Figure 1: Global Formulation Development Outsourcing Industry Revenue Breakdown (Million, %) by Region 2024 & 2032
- Figure 2: North America Formulation Development Outsourcing Industry Revenue (Million), by Country 2024 & 2032
- Figure 3: North America Formulation Development Outsourcing Industry Revenue Share (%), by Country 2024 & 2032
- Figure 4: Europe Formulation Development Outsourcing Industry Revenue (Million), by Country 2024 & 2032
- Figure 5: Europe Formulation Development Outsourcing Industry Revenue Share (%), by Country 2024 & 2032
- Figure 6: Asia Pacific Formulation Development Outsourcing Industry Revenue (Million), by Country 2024 & 2032
- Figure 7: Asia Pacific Formulation Development Outsourcing Industry Revenue Share (%), by Country 2024 & 2032
- Figure 8: Middle East and Africa Formulation Development Outsourcing Industry Revenue (Million), by Country 2024 & 2032
- Figure 9: Middle East and Africa Formulation Development Outsourcing Industry Revenue Share (%), by Country 2024 & 2032
- Figure 10: South America Formulation Development Outsourcing Industry Revenue (Million), by Country 2024 & 2032
- Figure 11: South America Formulation Development Outsourcing Industry Revenue Share (%), by Country 2024 & 2032
- Figure 12: North America Formulation Development Outsourcing Industry Revenue (Million), by Service 2024 & 2032
- Figure 13: North America Formulation Development Outsourcing Industry Revenue Share (%), by Service 2024 & 2032
- Figure 14: North America Formulation Development Outsourcing Industry Revenue (Million), by Dosage Form 2024 & 2032
- Figure 15: North America Formulation Development Outsourcing Industry Revenue Share (%), by Dosage Form 2024 & 2032
- Figure 16: North America Formulation Development Outsourcing Industry Revenue (Million), by Application 2024 & 2032
- Figure 17: North America Formulation Development Outsourcing Industry Revenue Share (%), by Application 2024 & 2032
- Figure 18: North America Formulation Development Outsourcing Industry Revenue (Million), by End User 2024 & 2032
- Figure 19: North America Formulation Development Outsourcing Industry Revenue Share (%), by End User 2024 & 2032
- Figure 20: North America Formulation Development Outsourcing Industry Revenue (Million), by Country 2024 & 2032
- Figure 21: North America Formulation Development Outsourcing Industry Revenue Share (%), by Country 2024 & 2032
- Figure 22: Europe Formulation Development Outsourcing Industry Revenue (Million), by Service 2024 & 2032
- Figure 23: Europe Formulation Development Outsourcing Industry Revenue Share (%), by Service 2024 & 2032
- Figure 24: Europe Formulation Development Outsourcing Industry Revenue (Million), by Dosage Form 2024 & 2032
- Figure 25: Europe Formulation Development Outsourcing Industry Revenue Share (%), by Dosage Form 2024 & 2032
- Figure 26: Europe Formulation Development Outsourcing Industry Revenue (Million), by Application 2024 & 2032
- Figure 27: Europe Formulation Development Outsourcing Industry Revenue Share (%), by Application 2024 & 2032
- Figure 28: Europe Formulation Development Outsourcing Industry Revenue (Million), by End User 2024 & 2032
- Figure 29: Europe Formulation Development Outsourcing Industry Revenue Share (%), by End User 2024 & 2032
- Figure 30: Europe Formulation Development Outsourcing Industry Revenue (Million), by Country 2024 & 2032
- Figure 31: Europe Formulation Development Outsourcing Industry Revenue Share (%), by Country 2024 & 2032
- Figure 32: Asia Pacific Formulation Development Outsourcing Industry Revenue (Million), by Service 2024 & 2032
- Figure 33: Asia Pacific Formulation Development Outsourcing Industry Revenue Share (%), by Service 2024 & 2032
- Figure 34: Asia Pacific Formulation Development Outsourcing Industry Revenue (Million), by Dosage Form 2024 & 2032
- Figure 35: Asia Pacific Formulation Development Outsourcing Industry Revenue Share (%), by Dosage Form 2024 & 2032
- Figure 36: Asia Pacific Formulation Development Outsourcing Industry Revenue (Million), by Application 2024 & 2032
- Figure 37: Asia Pacific Formulation Development Outsourcing Industry Revenue Share (%), by Application 2024 & 2032
- Figure 38: Asia Pacific Formulation Development Outsourcing Industry Revenue (Million), by End User 2024 & 2032
- Figure 39: Asia Pacific Formulation Development Outsourcing Industry Revenue Share (%), by End User 2024 & 2032
- Figure 40: Asia Pacific Formulation Development Outsourcing Industry Revenue (Million), by Country 2024 & 2032
- Figure 41: Asia Pacific Formulation Development Outsourcing Industry Revenue Share (%), by Country 2024 & 2032
- Figure 42: Middle East and Africa Formulation Development Outsourcing Industry Revenue (Million), by Service 2024 & 2032
- Figure 43: Middle East and Africa Formulation Development Outsourcing Industry Revenue Share (%), by Service 2024 & 2032
- Figure 44: Middle East and Africa Formulation Development Outsourcing Industry Revenue (Million), by Dosage Form 2024 & 2032
- Figure 45: Middle East and Africa Formulation Development Outsourcing Industry Revenue Share (%), by Dosage Form 2024 & 2032
- Figure 46: Middle East and Africa Formulation Development Outsourcing Industry Revenue (Million), by Application 2024 & 2032
- Figure 47: Middle East and Africa Formulation Development Outsourcing Industry Revenue Share (%), by Application 2024 & 2032
- Figure 48: Middle East and Africa Formulation Development Outsourcing Industry Revenue (Million), by End User 2024 & 2032
- Figure 49: Middle East and Africa Formulation Development Outsourcing Industry Revenue Share (%), by End User 2024 & 2032
- Figure 50: Middle East and Africa Formulation Development Outsourcing Industry Revenue (Million), by Country 2024 & 2032
- Figure 51: Middle East and Africa Formulation Development Outsourcing Industry Revenue Share (%), by Country 2024 & 2032
- Figure 52: South America Formulation Development Outsourcing Industry Revenue (Million), by Service 2024 & 2032
- Figure 53: South America Formulation Development Outsourcing Industry Revenue Share (%), by Service 2024 & 2032
- Figure 54: South America Formulation Development Outsourcing Industry Revenue (Million), by Dosage Form 2024 & 2032
- Figure 55: South America Formulation Development Outsourcing Industry Revenue Share (%), by Dosage Form 2024 & 2032
- Figure 56: South America Formulation Development Outsourcing Industry Revenue (Million), by Application 2024 & 2032
- Figure 57: South America Formulation Development Outsourcing Industry Revenue Share (%), by Application 2024 & 2032
- Figure 58: South America Formulation Development Outsourcing Industry Revenue (Million), by End User 2024 & 2032
- Figure 59: South America Formulation Development Outsourcing Industry Revenue Share (%), by End User 2024 & 2032
- Figure 60: South America Formulation Development Outsourcing Industry Revenue (Million), by Country 2024 & 2032
- Figure 61: South America Formulation Development Outsourcing Industry Revenue Share (%), by Country 2024 & 2032
List of Tables
- Table 1: Global Formulation Development Outsourcing Industry Revenue Million Forecast, by Region 2019 & 2032
- Table 2: Global Formulation Development Outsourcing Industry Revenue Million Forecast, by Service 2019 & 2032
- Table 3: Global Formulation Development Outsourcing Industry Revenue Million Forecast, by Dosage Form 2019 & 2032
- Table 4: Global Formulation Development Outsourcing Industry Revenue Million Forecast, by Application 2019 & 2032
- Table 5: Global Formulation Development Outsourcing Industry Revenue Million Forecast, by End User 2019 & 2032
- Table 6: Global Formulation Development Outsourcing Industry Revenue Million Forecast, by Region 2019 & 2032
- Table 7: Global Formulation Development Outsourcing Industry Revenue Million Forecast, by Country 2019 & 2032
- Table 8: United States Formulation Development Outsourcing Industry Revenue (Million) Forecast, by Application 2019 & 2032
- Table 9: Canada Formulation Development Outsourcing Industry Revenue (Million) Forecast, by Application 2019 & 2032
- Table 10: Mexico Formulation Development Outsourcing Industry Revenue (Million) Forecast, by Application 2019 & 2032
- Table 11: Global Formulation Development Outsourcing Industry Revenue Million Forecast, by Country 2019 & 2032
- Table 12: Germany Formulation Development Outsourcing Industry Revenue (Million) Forecast, by Application 2019 & 2032
- Table 13: United Kingdom Formulation Development Outsourcing Industry Revenue (Million) Forecast, by Application 2019 & 2032
- Table 14: France Formulation Development Outsourcing Industry Revenue (Million) Forecast, by Application 2019 & 2032
- Table 15: Italy Formulation Development Outsourcing Industry Revenue (Million) Forecast, by Application 2019 & 2032
- Table 16: Spain Formulation Development Outsourcing Industry Revenue (Million) Forecast, by Application 2019 & 2032
- Table 17: Rest of Europe Formulation Development Outsourcing Industry Revenue (Million) Forecast, by Application 2019 & 2032
- Table 18: Global Formulation Development Outsourcing Industry Revenue Million Forecast, by Country 2019 & 2032
- Table 19: China Formulation Development Outsourcing Industry Revenue (Million) Forecast, by Application 2019 & 2032
- Table 20: Japan Formulation Development Outsourcing Industry Revenue (Million) Forecast, by Application 2019 & 2032
- Table 21: India Formulation Development Outsourcing Industry Revenue (Million) Forecast, by Application 2019 & 2032
- Table 22: Australia Formulation Development Outsourcing Industry Revenue (Million) Forecast, by Application 2019 & 2032
- Table 23: South Korea Formulation Development Outsourcing Industry Revenue (Million) Forecast, by Application 2019 & 2032
- Table 24: Rest of Asia Pacific Formulation Development Outsourcing Industry Revenue (Million) Forecast, by Application 2019 & 2032
- Table 25: Global Formulation Development Outsourcing Industry Revenue Million Forecast, by Country 2019 & 2032
- Table 26: GCC Formulation Development Outsourcing Industry Revenue (Million) Forecast, by Application 2019 & 2032
- Table 27: South Africa Formulation Development Outsourcing Industry Revenue (Million) Forecast, by Application 2019 & 2032
- Table 28: Rest of Middle East and Africa Formulation Development Outsourcing Industry Revenue (Million) Forecast, by Application 2019 & 2032
- Table 29: Global Formulation Development Outsourcing Industry Revenue Million Forecast, by Country 2019 & 2032
- Table 30: Brazil Formulation Development Outsourcing Industry Revenue (Million) Forecast, by Application 2019 & 2032
- Table 31: Argentina Formulation Development Outsourcing Industry Revenue (Million) Forecast, by Application 2019 & 2032
- Table 32: Rest of South America Formulation Development Outsourcing Industry Revenue (Million) Forecast, by Application 2019 & 2032
- Table 33: Global Formulation Development Outsourcing Industry Revenue Million Forecast, by Service 2019 & 2032
- Table 34: Global Formulation Development Outsourcing Industry Revenue Million Forecast, by Dosage Form 2019 & 2032
- Table 35: Global Formulation Development Outsourcing Industry Revenue Million Forecast, by Application 2019 & 2032
- Table 36: Global Formulation Development Outsourcing Industry Revenue Million Forecast, by End User 2019 & 2032
- Table 37: Global Formulation Development Outsourcing Industry Revenue Million Forecast, by Country 2019 & 2032
- Table 38: United States Formulation Development Outsourcing Industry Revenue (Million) Forecast, by Application 2019 & 2032
- Table 39: Canada Formulation Development Outsourcing Industry Revenue (Million) Forecast, by Application 2019 & 2032
- Table 40: Mexico Formulation Development Outsourcing Industry Revenue (Million) Forecast, by Application 2019 & 2032
- Table 41: Global Formulation Development Outsourcing Industry Revenue Million Forecast, by Service 2019 & 2032
- Table 42: Global Formulation Development Outsourcing Industry Revenue Million Forecast, by Dosage Form 2019 & 2032
- Table 43: Global Formulation Development Outsourcing Industry Revenue Million Forecast, by Application 2019 & 2032
- Table 44: Global Formulation Development Outsourcing Industry Revenue Million Forecast, by End User 2019 & 2032
- Table 45: Global Formulation Development Outsourcing Industry Revenue Million Forecast, by Country 2019 & 2032
- Table 46: Germany Formulation Development Outsourcing Industry Revenue (Million) Forecast, by Application 2019 & 2032
- Table 47: United Kingdom Formulation Development Outsourcing Industry Revenue (Million) Forecast, by Application 2019 & 2032
- Table 48: France Formulation Development Outsourcing Industry Revenue (Million) Forecast, by Application 2019 & 2032
- Table 49: Italy Formulation Development Outsourcing Industry Revenue (Million) Forecast, by Application 2019 & 2032
- Table 50: Spain Formulation Development Outsourcing Industry Revenue (Million) Forecast, by Application 2019 & 2032
- Table 51: Rest of Europe Formulation Development Outsourcing Industry Revenue (Million) Forecast, by Application 2019 & 2032
- Table 52: Global Formulation Development Outsourcing Industry Revenue Million Forecast, by Service 2019 & 2032
- Table 53: Global Formulation Development Outsourcing Industry Revenue Million Forecast, by Dosage Form 2019 & 2032
- Table 54: Global Formulation Development Outsourcing Industry Revenue Million Forecast, by Application 2019 & 2032
- Table 55: Global Formulation Development Outsourcing Industry Revenue Million Forecast, by End User 2019 & 2032
- Table 56: Global Formulation Development Outsourcing Industry Revenue Million Forecast, by Country 2019 & 2032
- Table 57: China Formulation Development Outsourcing Industry Revenue (Million) Forecast, by Application 2019 & 2032
- Table 58: Japan Formulation Development Outsourcing Industry Revenue (Million) Forecast, by Application 2019 & 2032
- Table 59: India Formulation Development Outsourcing Industry Revenue (Million) Forecast, by Application 2019 & 2032
- Table 60: Australia Formulation Development Outsourcing Industry Revenue (Million) Forecast, by Application 2019 & 2032
- Table 61: South Korea Formulation Development Outsourcing Industry Revenue (Million) Forecast, by Application 2019 & 2032
- Table 62: Rest of Asia Pacific Formulation Development Outsourcing Industry Revenue (Million) Forecast, by Application 2019 & 2032
- Table 63: Global Formulation Development Outsourcing Industry Revenue Million Forecast, by Service 2019 & 2032
- Table 64: Global Formulation Development Outsourcing Industry Revenue Million Forecast, by Dosage Form 2019 & 2032
- Table 65: Global Formulation Development Outsourcing Industry Revenue Million Forecast, by Application 2019 & 2032
- Table 66: Global Formulation Development Outsourcing Industry Revenue Million Forecast, by End User 2019 & 2032
- Table 67: Global Formulation Development Outsourcing Industry Revenue Million Forecast, by Country 2019 & 2032
- Table 68: GCC Formulation Development Outsourcing Industry Revenue (Million) Forecast, by Application 2019 & 2032
- Table 69: South Africa Formulation Development Outsourcing Industry Revenue (Million) Forecast, by Application 2019 & 2032
- Table 70: Rest of Middle East and Africa Formulation Development Outsourcing Industry Revenue (Million) Forecast, by Application 2019 & 2032
- Table 71: Global Formulation Development Outsourcing Industry Revenue Million Forecast, by Service 2019 & 2032
- Table 72: Global Formulation Development Outsourcing Industry Revenue Million Forecast, by Dosage Form 2019 & 2032
- Table 73: Global Formulation Development Outsourcing Industry Revenue Million Forecast, by Application 2019 & 2032
- Table 74: Global Formulation Development Outsourcing Industry Revenue Million Forecast, by End User 2019 & 2032
- Table 75: Global Formulation Development Outsourcing Industry Revenue Million Forecast, by Country 2019 & 2032
- Table 76: Brazil Formulation Development Outsourcing Industry Revenue (Million) Forecast, by Application 2019 & 2032
- Table 77: Argentina Formulation Development Outsourcing Industry Revenue (Million) Forecast, by Application 2019 & 2032
- Table 78: Rest of South America Formulation Development Outsourcing Industry Revenue (Million) Forecast, by Application 2019 & 2032
Frequently Asked Questions
1. What is the projected Compound Annual Growth Rate (CAGR) of the Formulation Development Outsourcing Industry?
The projected CAGR is approximately 6.16%.
2. Which companies are prominent players in the Formulation Development Outsourcing Industry?
Key companies in the market include Charles River Laboratories, Intertek Group PLC, Laboratory Corporation of America Holdings, Patheon (Thermo Fisher Scientific Inc ), Dr Reddy's Laboratories Ltd, Irisys LLC, Aizant Drug Research Solutions Private Limited, Syngene International Ltd, Lonza Group AG, Piramal Pharma Solutions, Qiotient Sciences, Catalent Inc, Emergent BioSolutions Inc.
3. What are the main segments of the Formulation Development Outsourcing Industry?
The market segments include Service, Dosage Form, Application, End User.
4. Can you provide details about the market size?
The market size is estimated to be USD 26.56 Million as of 2022.
5. What are some drivers contributing to market growth?
Increasing Trend of Patent Protection Expiration of Major Drugs; Rising Number of Pharmaceutical and Biopharmaceutical Companies Outsourcing Their Services.
6. What are the notable trends driving market growth?
The Oncology Segment is Expected to Witness Significant Growth over the Forecast Period.
7. Are there any restraints impacting market growth?
Structural Changes in the Pharmaceutical Industry; Insufficient Funding to Perform the Drug Development Process Through Formulation Development.
8. Can you provide examples of recent developments in the market?
N/A
9. What pricing options are available for accessing the report?
Pricing options include single-user, multi-user, and enterprise licenses priced at USD 4750, USD 5250, and USD 8750 respectively.
10. Is the market size provided in terms of value or volume?
The market size is provided in terms of value, measured in Million.
11. Are there any specific market keywords associated with the report?
Yes, the market keyword associated with the report is "Formulation Development Outsourcing Industry," which aids in identifying and referencing the specific market segment covered.
12. How do I determine which pricing option suits my needs best?
The pricing options vary based on user requirements and access needs. Individual users may opt for single-user licenses, while businesses requiring broader access may choose multi-user or enterprise licenses for cost-effective access to the report.
13. Are there any additional resources or data provided in the Formulation Development Outsourcing Industry report?
While the report offers comprehensive insights, it's advisable to review the specific contents or supplementary materials provided to ascertain if additional resources or data are available.
14. How can I stay updated on further developments or reports in the Formulation Development Outsourcing Industry?
To stay informed about further developments, trends, and reports in the Formulation Development Outsourcing Industry, consider subscribing to industry newsletters, following relevant companies and organizations, or regularly checking reputable industry news sources and publications.
Methodology
Step 1 - Identification of Relevant Samples Size from Population Database


Step 2 - Approaches for Defining Global Market Size (Value, Volume* & Price*)

Note*: In applicable scenarios
Step 3 - Data Sources
Primary Research
- Web Analytics
- Survey Reports
- Research Institute
- Latest Research Reports
- Opinion Leaders
Secondary Research
- Annual Reports
- White Paper
- Latest Press Release
- Industry Association
- Paid Database
- Investor Presentations

Step 4 - Data Triangulation
Involves using different sources of information in order to increase the validity of a study
These sources are likely to be stakeholders in a program - participants, other researchers, program staff, other community members, and so on.
Then we put all data in single framework & apply various statistical tools to find out the dynamic on the market.
During the analysis stage, feedback from the stakeholder groups would be compared to determine areas of agreement as well as areas of divergence


