

Key Insights
The global glass bottles and containers market is projected for significant expansion, estimated at $65.23 billion in the base year 2025, with a projected Compound Annual Growth Rate (CAGR) of 3.4% from 2025 to 2033. Key growth drivers include the expanding food and beverage sector, with a rising demand for premium, sustainable packaging. The increasing popularity of alcoholic and non-alcoholic beverages, coupled with consumer preference for glass due to its perceived safety, recyclability, and aesthetic qualities, fuels this demand. Furthermore, the cosmetics and pharmaceutical industries are substantial contributors, leveraging glass for its superior barrier properties and product preservation capabilities. While North America and Europe currently lead market share, the Asia-Pacific region is anticipated to experience robust growth, driven by rising disposable incomes and evolving consumer trends.
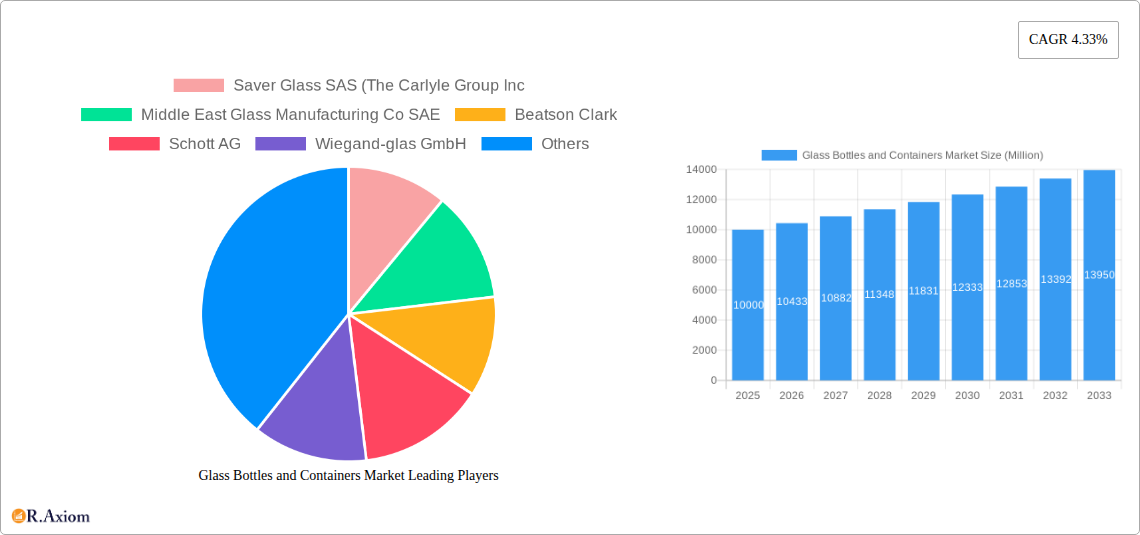
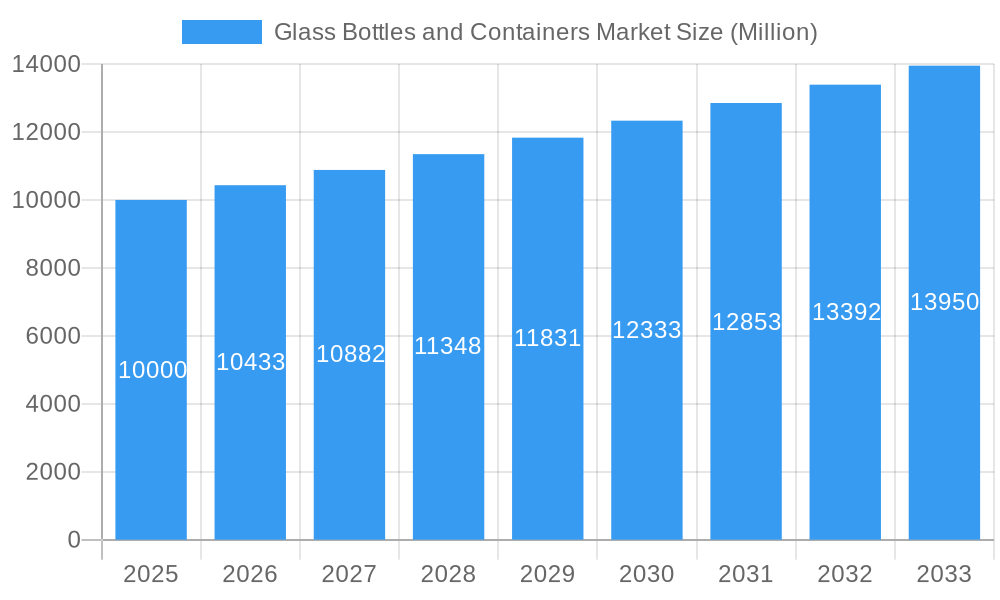
Glass Bottles and Containers Market Market Size (In Billion)
Market expansion faces constraints, including rising raw material and energy costs impacting manufacturing. Competition from alternative packaging materials such as plastic and metal also presents a challenge. However, the inherent sustainability, recyclability, and brand enhancement advantages of glass packaging are expected to counteract these restraints, ensuring sustained market growth. Segmentation by end-user reveals significant opportunities within beverages (alcoholic and non-alcoholic), food, cosmetics, and pharmaceuticals. Leading companies such as Saver Glass, O-I Glass, and Ardagh Group are pivotal in shaping the market through innovation and strategic initiatives. The forecast period indicates a consistent increase in market value, particularly in emerging economies, underscoring the long-term growth potential of the glass bottles and containers market.
Glass Bottles and Containers Market Company Market Share
Glass Bottles and Containers Market: A Comprehensive Market Report (2019-2033)
This detailed report provides a comprehensive analysis of the global Glass Bottles and Containers Market, offering invaluable insights for industry stakeholders, investors, and market strategists. The report covers the period from 2019 to 2033, with a focus on the base year 2025 and a forecast period of 2025-2033. The study meticulously examines market trends, segmentation, key players, and emerging opportunities, equipping readers with actionable intelligence to navigate this dynamic market.
Glass Bottles and Containers Market Market Concentration & Innovation
The global glass bottles and containers market exhibits a moderately concentrated landscape, with several major players holding significant market share. While precise market share figures for each company require in-depth analysis within the full report, O-I Glass, Ardagh Group, and Verallia are consistently ranked among the leading players. The market's concentration is influenced by factors including economies of scale in manufacturing, significant capital investment requirements, and established distribution networks. The market is characterized by ongoing innovation driven by consumer demand for sustainable packaging solutions, evolving regulatory frameworks promoting recyclability, and the emergence of lightweight and functional designs.
- Innovation Drivers: Lightweighting, improved recyclability, innovative closures, and enhanced design aesthetics are key drivers of innovation within this sector.
- Regulatory Frameworks: Stringent environmental regulations regarding recyclability and the reduction of carbon footprint are shaping product development and manufacturing processes.
- Product Substitutes: The primary substitutes for glass bottles and containers include plastic and aluminum containers. However, growing consumer awareness of environmental issues is leading to increased preference for glass.
- End-User Trends: The increasing demand for sustainable and eco-friendly packaging from the beverage and food industries is significantly boosting market growth.
- M&A Activities: The market has witnessed several mergers and acquisitions in recent years, with deal values ranging from tens to hundreds of Millions, driven by the desire to expand market reach, diversify product portfolios, and enhance technological capabilities. The exact figures vary widely and need further examination in the complete report.
Glass Bottles and Containers Market Industry Trends & Insights
The global glass bottles and containers market is experiencing robust growth, driven by several factors. The Compound Annual Growth Rate (CAGR) for the forecast period (2025-2033) is projected to be xx%, indicating significant market expansion. Key growth drivers include the rising demand from the food and beverage industry (particularly alcoholic and non-alcoholic beverages), increasing consumer preference for sustainable packaging, and the growth of the cosmetics and pharmaceutical sectors. Technological advancements, such as lightweighting techniques and improved recycling technologies, are further enhancing market growth. Consumer preferences are shifting towards premium and aesthetically appealing glass packaging, further driving market expansion. Competitive dynamics are intensifying, with manufacturers focusing on cost optimization, product diversification, and technological innovation to maintain market share. Market penetration of glass containers is expected to increase in developing economies with rising disposable incomes and changing lifestyles.
Dominant Markets & Segments in Glass Bottles and Containers Market
The dominant market segment within the glass bottles and containers industry is the beverage sector, specifically non-alcoholic beverages (carbonated soft drinks, water, and juices). The food sector represents another significant segment. Geographical dominance varies by segment; however, regions with robust food and beverage industries and a higher per capita consumption of packaged products generally exhibit higher demand.
- Key Drivers for Beverage Sector Dominance:
- High consumption of bottled beverages globally
- Preference for glass packaging for its perceived quality and inert nature
- Enhanced shelf life and preservation properties of glass.
- North America and Europe currently hold significant market shares owing to established infrastructure and consumer preference. However, developing economies in Asia and South America are experiencing rapid growth, driven by rising disposable incomes, urbanization, and changes in consumer preferences. Specific growth projections and market size for each region require a deep dive into the detailed report.
Glass Bottles and Containers Market Product Developments
Recent product innovations in the glass bottles and containers market focus on lightweighting to reduce transportation costs and carbon footprint, improved recyclability to address environmental concerns, and aesthetic enhancements to meet evolving consumer preferences. These developments are increasing the market attractiveness of glass packaging compared to competing materials, notably plastics. The use of recycled glass in manufacturing is also trending upwards, aligning with sustainability initiatives and reducing reliance on virgin raw materials. Technological advancements are leading to more cost-effective manufacturing processes, enabling glass packaging to remain competitively priced.
Report Scope & Segmentation Analysis
This report segments the glass bottles and containers market comprehensively by end-user vertical:
- Beverages: This segment is further divided into alcoholic (beer and cider, wine and spirits, other alcoholic beverages) and non-alcoholic (carbonated soft drinks, milk, water, and other non-alcoholic beverages) sub-segments. Each sub-segment is analyzed for growth projections and competitive dynamics.
- Food: This segment covers glass containers used for food preservation and packaging, offering growth projections and competitive landscape analyses.
- Cosmetics: The report assesses the market size, growth projections, and competitive landscape within the glass packaging used for cosmetics and beauty products.
- Pharmaceutical: The analysis of this segment includes market size, growth projections, and competitive dynamics of glass containers for pharmaceutical products.
- Other End-user Verticals: This segment encompasses other applications of glass containers, along with projections and market analysis.
Key Drivers of Glass Bottles and Containers Market Growth
The growth of the glass bottles and containers market is significantly propelled by several factors:
- Rising demand for sustainable packaging: Consumers and regulatory bodies are increasingly focused on reducing environmental impact, boosting the demand for recyclable glass containers.
- Growth in the food and beverage sector: The continued expansion of the global food and beverage industry drives the demand for various glass packaging solutions.
- Technological advancements: Innovations in manufacturing processes, including lightweighting and improved recycling technologies, enhance the efficiency and sustainability of glass packaging.
- Growing consumer preference for premium packaging: Consumers often associate glass with higher quality and prestige, positively influencing demand.
Challenges in the Glass Bottles and Containers Market Sector
The glass bottles and containers market faces several challenges:
- High production costs: Glass manufacturing requires significant energy input, increasing production costs and impacting profitability.
- Fragility of glass containers: The inherent fragility of glass results in higher transportation costs and losses during handling.
- Competition from alternative packaging materials: Plastic and other materials pose substantial competition to glass containers due to lower costs and lighter weights. The exact market share for each competitor varies and is quantified further in the full report.
- Fluctuations in raw material prices: Changes in the cost of raw materials such as silica sand, soda ash, and limestone can significantly impact the profitability of glass manufacturers.
Emerging Opportunities in Glass Bottles and Containers Market
Despite challenges, several opportunities are emerging:
- Growth in developing economies: Developing nations present substantial growth potential for glass packaging as economies expand and consumer demand increases.
- Innovation in design and functionality: Developing innovative designs, shapes, sizes, and closures increases appeal to consumers and creates new market segments.
- Increased focus on sustainability: The global emphasis on environmental protection drives innovation towards increased recyclability and the use of recycled glass in manufacturing.
Leading Players in the Glass Bottles and Containers Market Market
- Saver Glass SAS
- The Carlyle Group Inc
- Middle East Glass Manufacturing Co SAE
- Beatson Clark
- Schott AG
- Wiegand-glas GmbH
- Stoelzle Oberglas GmbH (CAG-holding GmbH)
- O-I Glass Inc
- PGP Glass Private Limited
- Vitro SAB de CV
- Verallia Packaging
- Berlin Packaging LLC
- Gaasch Packaging
- Vidrala SA
- Glassworks International Limited
- Ardagh Group S A
- BA VIDRO SA (BA Glass BV)
- SGD SA (SGD Pharma)
- Vetropack Holding Ltd
- VERESCENCE FRANCE
- Gerresheimer AG
Key Developments in Glass Bottles and Containers Market Industry
- August 2023: O-I Glass launched its "Cento per Cento Sicily" bottles, highlighting circular economy principles with 90% recycled, locally sourced Sicilian glass. The lightweight design (410 grams) optimizes energy efficiency.
- January 2023: O-I Glass announced the construction of three new furnaces (Brazil & Italy) using Oxy-combustion technology, aiming for a 400 kiloton annual production capacity increase by 2024 and an 18% reduction in CO2 emissions.
Strategic Outlook for Glass Bottles and Containers Market Market
The future of the glass bottles and containers market is promising. Continued growth is expected, driven by the increasing demand for sustainable and premium packaging, technological advancements, and expanding markets in developing economies. Companies focused on innovation, sustainability, and efficient manufacturing processes are best positioned for success. The market's resilience and ability to adapt to changing consumer preferences and environmental concerns will ensure long-term growth.
Glass Bottles and Containers Market Segmentation
-
1. End-user Vertical
-
1.1. Bevarages
-
1.1.1. Alcoholic
- 1.1.1.1. Beer and Cider
- 1.1.1.2. Wine and Spirits
- 1.1.1.3. Other Alcoholic Beverages
-
1.1.2. Non-alcoholic
- 1.1.2.1. Carbonated Soft Drinks
- 1.1.2.2. Milk
- 1.1.2.3. Water and Other Non-alcoholic Beverages
-
1.1.1. Alcoholic
- 1.2. Food
- 1.3. Cosmetics
- 1.4. Pharmaceutical
- 1.5. Other End-user Verticals
-
1.1. Bevarages
Glass Bottles and Containers Market Segmentation By Geography
-
1. North America
- 1.1. United States
- 1.2. Canada
-
2. Europe
- 2.1. United Kingdom
- 2.2. Germany
- 2.3. France
- 2.4. Italy
- 2.5. Spain
- 2.6. Poland
- 2.7. Russia
-
3. Asia
- 3.1. China
- 3.2. India
- 3.3. Japan
- 3.4. South Korea
- 3.5. Australia and New Zealand
-
4. Middle East and Africa
- 4.1. United Arab Emirates
- 4.2. Saudi Arabia
- 4.3. South Africa
-
5. Latin America
- 5.1. Brazil
- 5.2. Mexico
- 5.3. Argentina
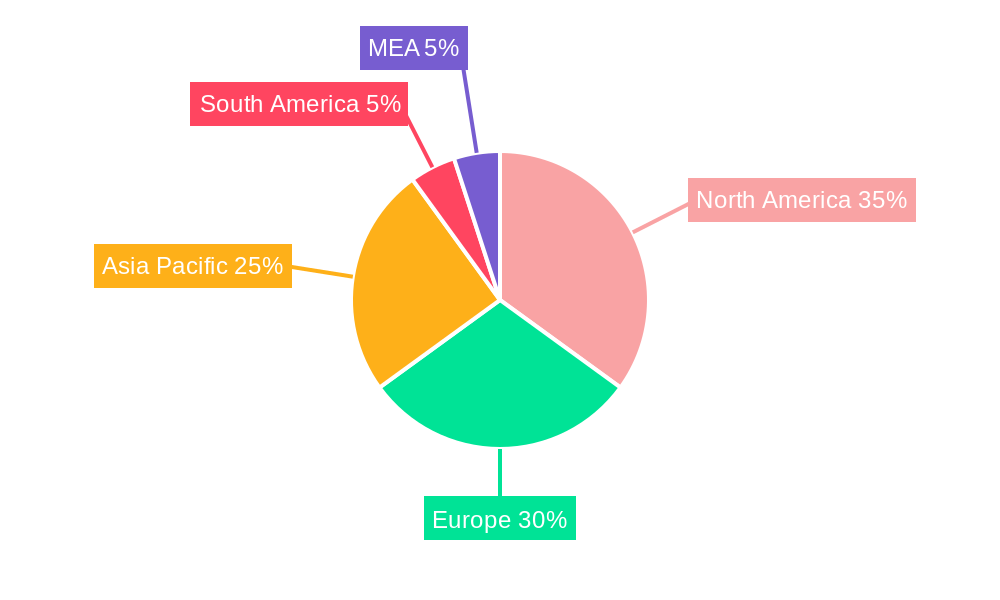
Glass Bottles and Containers Market Regional Market Share
Geographic Coverage of Glass Bottles and Containers Market
Glass Bottles and Containers Market REPORT HIGHLIGHTS
| Aspects | Details |
|---|---|
| Study Period | 2020-2034 |
| Base Year | 2025 |
| Estimated Year | 2026 |
| Forecast Period | 2026-2034 |
| Historical Period | 2020-2025 |
| Growth Rate | CAGR of 3.4% from 2020-2034 |
| Segmentation |
|
Table of Contents
- 1. Introduction
- 1.1. Research Scope
- 1.2. Market Segmentation
- 1.3. Research Objective
- 1.4. Definitions and Assumptions
- 2. Executive Summary
- 2.1. Market Snapshot
- 3. Market Dynamics
- 3.1. Market Drivers
- 3.2. Market Restrains
- 3.3. Market Trends
- 3.4. Market Opportunities
- 4. Market Factor Analysis
- 4.1. Porters Five Forces
- 4.1.1. Bargaining Power of Suppliers
- 4.1.2. Bargaining Power of Buyers
- 4.1.3. Threat of New Entrants
- 4.1.4. Threat of Substitutes
- 4.1.5. Competitive Rivalry
- 4.2. PESTEL analysis
- 4.3. BCG Analysis
- 4.3.1. Stars (High Growth, High Market Share)
- 4.3.2. Cash Cows (Low Growth, High Market Share)
- 4.3.3. Question Mark (High Growth, Low Market Share)
- 4.3.4. Dogs (Low Growth, Low Market Share)
- 4.4. Ansoff Matrix Analysis
- 4.5. Supply Chain Analysis
- 4.6. Regulatory Landscape
- 4.7. Current Market Potential and Opportunity Assessment (TAM–SAM–SOM Framework)
- 4.8. RAX Analyst Note
- 4.1. Porters Five Forces
- 5. Market Analysis, Insights and Forecast 2021-2033
- 5.1. Market Analysis, Insights and Forecast - by End-user Vertical
- 5.1.1. Bevarages
- 5.1.1.1. Alcoholic
- 5.1.1.1.1. Beer and Cider
- 5.1.1.1.2. Wine and Spirits
- 5.1.1.1.3. Other Alcoholic Beverages
- 5.1.1.2. Non-alcoholic
- 5.1.1.2.1. Carbonated Soft Drinks
- 5.1.1.2.2. Milk
- 5.1.1.2.3. Water and Other Non-alcoholic Beverages
- 5.1.1.1. Alcoholic
- 5.1.2. Food
- 5.1.3. Cosmetics
- 5.1.4. Pharmaceutical
- 5.1.5. Other End-user Verticals
- 5.1.1. Bevarages
- 5.2. Market Analysis, Insights and Forecast - by Region
- 5.2.1. North America
- 5.2.2. Europe
- 5.2.3. Asia
- 5.2.4. Middle East and Africa
- 5.2.5. Latin America
- 5.1. Market Analysis, Insights and Forecast - by End-user Vertical
- 6. Global Glass Bottles and Containers Market Analysis, Insights and Forecast, 2021-2033
- 6.1. Market Analysis, Insights and Forecast - by End-user Vertical
- 6.1.1. Bevarages
- 6.1.1.1. Alcoholic
- 6.1.1.1.1. Beer and Cider
- 6.1.1.1.2. Wine and Spirits
- 6.1.1.1.3. Other Alcoholic Beverages
- 6.1.1.2. Non-alcoholic
- 6.1.1.2.1. Carbonated Soft Drinks
- 6.1.1.2.2. Milk
- 6.1.1.2.3. Water and Other Non-alcoholic Beverages
- 6.1.1.1. Alcoholic
- 6.1.2. Food
- 6.1.3. Cosmetics
- 6.1.4. Pharmaceutical
- 6.1.5. Other End-user Verticals
- 6.1.1. Bevarages
- 6.1. Market Analysis, Insights and Forecast - by End-user Vertical
- 7. North America Glass Bottles and Containers Market Analysis, Insights and Forecast, 2020-2032
- 7.1. Market Analysis, Insights and Forecast - by End-user Vertical
- 7.1.1. Bevarages
- 7.1.1.1. Alcoholic
- 7.1.1.1.1. Beer and Cider
- 7.1.1.1.2. Wine and Spirits
- 7.1.1.1.3. Other Alcoholic Beverages
- 7.1.1.2. Non-alcoholic
- 7.1.1.2.1. Carbonated Soft Drinks
- 7.1.1.2.2. Milk
- 7.1.1.2.3. Water and Other Non-alcoholic Beverages
- 7.1.1.1. Alcoholic
- 7.1.2. Food
- 7.1.3. Cosmetics
- 7.1.4. Pharmaceutical
- 7.1.5. Other End-user Verticals
- 7.1.1. Bevarages
- 7.1. Market Analysis, Insights and Forecast - by End-user Vertical
- 8. Europe Glass Bottles and Containers Market Analysis, Insights and Forecast, 2020-2032
- 8.1. Market Analysis, Insights and Forecast - by End-user Vertical
- 8.1.1. Bevarages
- 8.1.1.1. Alcoholic
- 8.1.1.1.1. Beer and Cider
- 8.1.1.1.2. Wine and Spirits
- 8.1.1.1.3. Other Alcoholic Beverages
- 8.1.1.2. Non-alcoholic
- 8.1.1.2.1. Carbonated Soft Drinks
- 8.1.1.2.2. Milk
- 8.1.1.2.3. Water and Other Non-alcoholic Beverages
- 8.1.1.1. Alcoholic
- 8.1.2. Food
- 8.1.3. Cosmetics
- 8.1.4. Pharmaceutical
- 8.1.5. Other End-user Verticals
- 8.1.1. Bevarages
- 8.1. Market Analysis, Insights and Forecast - by End-user Vertical
- 9. Asia Glass Bottles and Containers Market Analysis, Insights and Forecast, 2020-2032
- 9.1. Market Analysis, Insights and Forecast - by End-user Vertical
- 9.1.1. Bevarages
- 9.1.1.1. Alcoholic
- 9.1.1.1.1. Beer and Cider
- 9.1.1.1.2. Wine and Spirits
- 9.1.1.1.3. Other Alcoholic Beverages
- 9.1.1.2. Non-alcoholic
- 9.1.1.2.1. Carbonated Soft Drinks
- 9.1.1.2.2. Milk
- 9.1.1.2.3. Water and Other Non-alcoholic Beverages
- 9.1.1.1. Alcoholic
- 9.1.2. Food
- 9.1.3. Cosmetics
- 9.1.4. Pharmaceutical
- 9.1.5. Other End-user Verticals
- 9.1.1. Bevarages
- 9.1. Market Analysis, Insights and Forecast - by End-user Vertical
- 10. Middle East and Africa Glass Bottles and Containers Market Analysis, Insights and Forecast, 2020-2032
- 10.1. Market Analysis, Insights and Forecast - by End-user Vertical
- 10.1.1. Bevarages
- 10.1.1.1. Alcoholic
- 10.1.1.1.1. Beer and Cider
- 10.1.1.1.2. Wine and Spirits
- 10.1.1.1.3. Other Alcoholic Beverages
- 10.1.1.2. Non-alcoholic
- 10.1.1.2.1. Carbonated Soft Drinks
- 10.1.1.2.2. Milk
- 10.1.1.2.3. Water and Other Non-alcoholic Beverages
- 10.1.1.1. Alcoholic
- 10.1.2. Food
- 10.1.3. Cosmetics
- 10.1.4. Pharmaceutical
- 10.1.5. Other End-user Verticals
- 10.1.1. Bevarages
- 10.1. Market Analysis, Insights and Forecast - by End-user Vertical
- 11. Latin America Glass Bottles and Containers Market Analysis, Insights and Forecast, 2020-2032
- 11.1. Market Analysis, Insights and Forecast - by End-user Vertical
- 11.1.1. Bevarages
- 11.1.1.1. Alcoholic
- 11.1.1.1.1. Beer and Cider
- 11.1.1.1.2. Wine and Spirits
- 11.1.1.1.3. Other Alcoholic Beverages
- 11.1.1.2. Non-alcoholic
- 11.1.1.2.1. Carbonated Soft Drinks
- 11.1.1.2.2. Milk
- 11.1.1.2.3. Water and Other Non-alcoholic Beverages
- 11.1.1.1. Alcoholic
- 11.1.2. Food
- 11.1.3. Cosmetics
- 11.1.4. Pharmaceutical
- 11.1.5. Other End-user Verticals
- 11.1.1. Bevarages
- 11.1. Market Analysis, Insights and Forecast - by End-user Vertical
- 12. Competitive Analysis
- 12.1. Company Profiles
- 12.1.1 Saver Glass SAS (The Carlyle Group Inc
- 12.1.1.1. Company Overview
- 12.1.1.2. Products
- 12.1.1.3. Company Financials
- 12.1.1.4. SWOT Analysis
- 12.1.2 Middle East Glass Manufacturing Co SAE
- 12.1.2.1. Company Overview
- 12.1.2.2. Products
- 12.1.2.3. Company Financials
- 12.1.2.4. SWOT Analysis
- 12.1.3 Beatson Clark
- 12.1.3.1. Company Overview
- 12.1.3.2. Products
- 12.1.3.3. Company Financials
- 12.1.3.4. SWOT Analysis
- 12.1.4 Schott AG
- 12.1.4.1. Company Overview
- 12.1.4.2. Products
- 12.1.4.3. Company Financials
- 12.1.4.4. SWOT Analysis
- 12.1.5 Wiegand-glas GmbH
- 12.1.5.1. Company Overview
- 12.1.5.2. Products
- 12.1.5.3. Company Financials
- 12.1.5.4. SWOT Analysis
- 12.1.6 Stoelzle Oberglas GmbH (CAG-holding GmbH)
- 12.1.6.1. Company Overview
- 12.1.6.2. Products
- 12.1.6.3. Company Financials
- 12.1.6.4. SWOT Analysis
- 12.1.7 O-I Glass Inc
- 12.1.7.1. Company Overview
- 12.1.7.2. Products
- 12.1.7.3. Company Financials
- 12.1.7.4. SWOT Analysis
- 12.1.8 PGP Glass Private Limited
- 12.1.8.1. Company Overview
- 12.1.8.2. Products
- 12.1.8.3. Company Financials
- 12.1.8.4. SWOT Analysis
- 12.1.9 Vitro SAB de CV
- 12.1.9.1. Company Overview
- 12.1.9.2. Products
- 12.1.9.3. Company Financials
- 12.1.9.4. SWOT Analysis
- 12.1.10 Verallia Packaging
- 12.1.10.1. Company Overview
- 12.1.10.2. Products
- 12.1.10.3. Company Financials
- 12.1.10.4. SWOT Analysis
- 12.1.11 Berlin Packaging LLC
- 12.1.11.1. Company Overview
- 12.1.11.2. Products
- 12.1.11.3. Company Financials
- 12.1.11.4. SWOT Analysis
- 12.1.12 Gaasch Packaging
- 12.1.12.1. Company Overview
- 12.1.12.2. Products
- 12.1.12.3. Company Financials
- 12.1.12.4. SWOT Analysis
- 12.1.13 Vidrala SA
- 12.1.13.1. Company Overview
- 12.1.13.2. Products
- 12.1.13.3. Company Financials
- 12.1.13.4. SWOT Analysis
- 12.1.14 Glassworks International Limited
- 12.1.14.1. Company Overview
- 12.1.14.2. Products
- 12.1.14.3. Company Financials
- 12.1.14.4. SWOT Analysis
- 12.1.15 Ardagh Group S A
- 12.1.15.1. Company Overview
- 12.1.15.2. Products
- 12.1.15.3. Company Financials
- 12.1.15.4. SWOT Analysis
- 12.1.16 BA VIDRO SA (BA Glass BV)
- 12.1.16.1. Company Overview
- 12.1.16.2. Products
- 12.1.16.3. Company Financials
- 12.1.16.4. SWOT Analysis
- 12.1.17 SGD SA (SGD Pharma)
- 12.1.17.1. Company Overview
- 12.1.17.2. Products
- 12.1.17.3. Company Financials
- 12.1.17.4. SWOT Analysis
- 12.1.18 Vetropack Holding Ltd
- 12.1.18.1. Company Overview
- 12.1.18.2. Products
- 12.1.18.3. Company Financials
- 12.1.18.4. SWOT Analysis
- 12.1.19 VERESCENCE FRANCE
- 12.1.19.1. Company Overview
- 12.1.19.2. Products
- 12.1.19.3. Company Financials
- 12.1.19.4. SWOT Analysis
- 12.1.20 Gerresheimer AG
- 12.1.20.1. Company Overview
- 12.1.20.2. Products
- 12.1.20.3. Company Financials
- 12.1.20.4. SWOT Analysis
- 12.1.1 Saver Glass SAS (The Carlyle Group Inc
- 12.2. Market Entropy
- 12.2.1 Company's Key Areas Served
- 12.2.2 Recent Developments
- 12.3. Company Market Share Analysis 2025
- 12.3.1 Top 5 Companies Market Share Analysis
- 12.3.2 Top 3 Companies Market Share Analysis
- 12.4. List of Potential Customers
- 13. Research Methodology
List of Figures
- Figure 1: Global Glass Bottles and Containers Market Revenue Breakdown (billion, %) by Region 2025 & 2033
- Figure 2: Global Glass Bottles and Containers Market Volume Breakdown (Trillion, %) by Region 2025 & 2033
- Figure 3: North America Glass Bottles and Containers Market Revenue (billion), by End-user Vertical 2025 & 2033
- Figure 4: North America Glass Bottles and Containers Market Volume (Trillion), by End-user Vertical 2025 & 2033
- Figure 5: North America Glass Bottles and Containers Market Revenue Share (%), by End-user Vertical 2025 & 2033
- Figure 6: North America Glass Bottles and Containers Market Volume Share (%), by End-user Vertical 2025 & 2033
- Figure 7: North America Glass Bottles and Containers Market Revenue (billion), by Country 2025 & 2033
- Figure 8: North America Glass Bottles and Containers Market Volume (Trillion), by Country 2025 & 2033
- Figure 9: North America Glass Bottles and Containers Market Revenue Share (%), by Country 2025 & 2033
- Figure 10: North America Glass Bottles and Containers Market Volume Share (%), by Country 2025 & 2033
- Figure 11: Europe Glass Bottles and Containers Market Revenue (billion), by End-user Vertical 2025 & 2033
- Figure 12: Europe Glass Bottles and Containers Market Volume (Trillion), by End-user Vertical 2025 & 2033
- Figure 13: Europe Glass Bottles and Containers Market Revenue Share (%), by End-user Vertical 2025 & 2033
- Figure 14: Europe Glass Bottles and Containers Market Volume Share (%), by End-user Vertical 2025 & 2033
- Figure 15: Europe Glass Bottles and Containers Market Revenue (billion), by Country 2025 & 2033
- Figure 16: Europe Glass Bottles and Containers Market Volume (Trillion), by Country 2025 & 2033
- Figure 17: Europe Glass Bottles and Containers Market Revenue Share (%), by Country 2025 & 2033
- Figure 18: Europe Glass Bottles and Containers Market Volume Share (%), by Country 2025 & 2033
- Figure 19: Asia Glass Bottles and Containers Market Revenue (billion), by End-user Vertical 2025 & 2033
- Figure 20: Asia Glass Bottles and Containers Market Volume (Trillion), by End-user Vertical 2025 & 2033
- Figure 21: Asia Glass Bottles and Containers Market Revenue Share (%), by End-user Vertical 2025 & 2033
- Figure 22: Asia Glass Bottles and Containers Market Volume Share (%), by End-user Vertical 2025 & 2033
- Figure 23: Asia Glass Bottles and Containers Market Revenue (billion), by Country 2025 & 2033
- Figure 24: Asia Glass Bottles and Containers Market Volume (Trillion), by Country 2025 & 2033
- Figure 25: Asia Glass Bottles and Containers Market Revenue Share (%), by Country 2025 & 2033
- Figure 26: Asia Glass Bottles and Containers Market Volume Share (%), by Country 2025 & 2033
- Figure 27: Middle East and Africa Glass Bottles and Containers Market Revenue (billion), by End-user Vertical 2025 & 2033
- Figure 28: Middle East and Africa Glass Bottles and Containers Market Volume (Trillion), by End-user Vertical 2025 & 2033
- Figure 29: Middle East and Africa Glass Bottles and Containers Market Revenue Share (%), by End-user Vertical 2025 & 2033
- Figure 30: Middle East and Africa Glass Bottles and Containers Market Volume Share (%), by End-user Vertical 2025 & 2033
- Figure 31: Middle East and Africa Glass Bottles and Containers Market Revenue (billion), by Country 2025 & 2033
- Figure 32: Middle East and Africa Glass Bottles and Containers Market Volume (Trillion), by Country 2025 & 2033
- Figure 33: Middle East and Africa Glass Bottles and Containers Market Revenue Share (%), by Country 2025 & 2033
- Figure 34: Middle East and Africa Glass Bottles and Containers Market Volume Share (%), by Country 2025 & 2033
- Figure 35: Latin America Glass Bottles and Containers Market Revenue (billion), by End-user Vertical 2025 & 2033
- Figure 36: Latin America Glass Bottles and Containers Market Volume (Trillion), by End-user Vertical 2025 & 2033
- Figure 37: Latin America Glass Bottles and Containers Market Revenue Share (%), by End-user Vertical 2025 & 2033
- Figure 38: Latin America Glass Bottles and Containers Market Volume Share (%), by End-user Vertical 2025 & 2033
- Figure 39: Latin America Glass Bottles and Containers Market Revenue (billion), by Country 2025 & 2033
- Figure 40: Latin America Glass Bottles and Containers Market Volume (Trillion), by Country 2025 & 2033
- Figure 41: Latin America Glass Bottles and Containers Market Revenue Share (%), by Country 2025 & 2033
- Figure 42: Latin America Glass Bottles and Containers Market Volume Share (%), by Country 2025 & 2033
List of Tables
- Table 1: Global Glass Bottles and Containers Market Revenue billion Forecast, by End-user Vertical 2020 & 2033
- Table 2: Global Glass Bottles and Containers Market Volume Trillion Forecast, by End-user Vertical 2020 & 2033
- Table 3: Global Glass Bottles and Containers Market Revenue billion Forecast, by Region 2020 & 2033
- Table 4: Global Glass Bottles and Containers Market Volume Trillion Forecast, by Region 2020 & 2033
- Table 5: Global Glass Bottles and Containers Market Revenue billion Forecast, by End-user Vertical 2020 & 2033
- Table 6: Global Glass Bottles and Containers Market Volume Trillion Forecast, by End-user Vertical 2020 & 2033
- Table 7: Global Glass Bottles and Containers Market Revenue billion Forecast, by Country 2020 & 2033
- Table 8: Global Glass Bottles and Containers Market Volume Trillion Forecast, by Country 2020 & 2033
- Table 9: United States Glass Bottles and Containers Market Revenue (billion) Forecast, by Application 2020 & 2033
- Table 10: United States Glass Bottles and Containers Market Volume (Trillion) Forecast, by Application 2020 & 2033
- Table 11: Canada Glass Bottles and Containers Market Revenue (billion) Forecast, by Application 2020 & 2033
- Table 12: Canada Glass Bottles and Containers Market Volume (Trillion) Forecast, by Application 2020 & 2033
- Table 13: Global Glass Bottles and Containers Market Revenue billion Forecast, by End-user Vertical 2020 & 2033
- Table 14: Global Glass Bottles and Containers Market Volume Trillion Forecast, by End-user Vertical 2020 & 2033
- Table 15: Global Glass Bottles and Containers Market Revenue billion Forecast, by Country 2020 & 2033
- Table 16: Global Glass Bottles and Containers Market Volume Trillion Forecast, by Country 2020 & 2033
- Table 17: United Kingdom Glass Bottles and Containers Market Revenue (billion) Forecast, by Application 2020 & 2033
- Table 18: United Kingdom Glass Bottles and Containers Market Volume (Trillion) Forecast, by Application 2020 & 2033
- Table 19: Germany Glass Bottles and Containers Market Revenue (billion) Forecast, by Application 2020 & 2033
- Table 20: Germany Glass Bottles and Containers Market Volume (Trillion) Forecast, by Application 2020 & 2033
- Table 21: France Glass Bottles and Containers Market Revenue (billion) Forecast, by Application 2020 & 2033
- Table 22: France Glass Bottles and Containers Market Volume (Trillion) Forecast, by Application 2020 & 2033
- Table 23: Italy Glass Bottles and Containers Market Revenue (billion) Forecast, by Application 2020 & 2033
- Table 24: Italy Glass Bottles and Containers Market Volume (Trillion) Forecast, by Application 2020 & 2033
- Table 25: Spain Glass Bottles and Containers Market Revenue (billion) Forecast, by Application 2020 & 2033
- Table 26: Spain Glass Bottles and Containers Market Volume (Trillion) Forecast, by Application 2020 & 2033
- Table 27: Poland Glass Bottles and Containers Market Revenue (billion) Forecast, by Application 2020 & 2033
- Table 28: Poland Glass Bottles and Containers Market Volume (Trillion) Forecast, by Application 2020 & 2033
- Table 29: Russia Glass Bottles and Containers Market Revenue (billion) Forecast, by Application 2020 & 2033
- Table 30: Russia Glass Bottles and Containers Market Volume (Trillion) Forecast, by Application 2020 & 2033
- Table 31: Global Glass Bottles and Containers Market Revenue billion Forecast, by End-user Vertical 2020 & 2033
- Table 32: Global Glass Bottles and Containers Market Volume Trillion Forecast, by End-user Vertical 2020 & 2033
- Table 33: Global Glass Bottles and Containers Market Revenue billion Forecast, by Country 2020 & 2033
- Table 34: Global Glass Bottles and Containers Market Volume Trillion Forecast, by Country 2020 & 2033
- Table 35: China Glass Bottles and Containers Market Revenue (billion) Forecast, by Application 2020 & 2033
- Table 36: China Glass Bottles and Containers Market Volume (Trillion) Forecast, by Application 2020 & 2033
- Table 37: India Glass Bottles and Containers Market Revenue (billion) Forecast, by Application 2020 & 2033
- Table 38: India Glass Bottles and Containers Market Volume (Trillion) Forecast, by Application 2020 & 2033
- Table 39: Japan Glass Bottles and Containers Market Revenue (billion) Forecast, by Application 2020 & 2033
- Table 40: Japan Glass Bottles and Containers Market Volume (Trillion) Forecast, by Application 2020 & 2033
- Table 41: South Korea Glass Bottles and Containers Market Revenue (billion) Forecast, by Application 2020 & 2033
- Table 42: South Korea Glass Bottles and Containers Market Volume (Trillion) Forecast, by Application 2020 & 2033
- Table 43: Australia and New Zealand Glass Bottles and Containers Market Revenue (billion) Forecast, by Application 2020 & 2033
- Table 44: Australia and New Zealand Glass Bottles and Containers Market Volume (Trillion) Forecast, by Application 2020 & 2033
- Table 45: Global Glass Bottles and Containers Market Revenue billion Forecast, by End-user Vertical 2020 & 2033
- Table 46: Global Glass Bottles and Containers Market Volume Trillion Forecast, by End-user Vertical 2020 & 2033
- Table 47: Global Glass Bottles and Containers Market Revenue billion Forecast, by Country 2020 & 2033
- Table 48: Global Glass Bottles and Containers Market Volume Trillion Forecast, by Country 2020 & 2033
- Table 49: United Arab Emirates Glass Bottles and Containers Market Revenue (billion) Forecast, by Application 2020 & 2033
- Table 50: United Arab Emirates Glass Bottles and Containers Market Volume (Trillion) Forecast, by Application 2020 & 2033
- Table 51: Saudi Arabia Glass Bottles and Containers Market Revenue (billion) Forecast, by Application 2020 & 2033
- Table 52: Saudi Arabia Glass Bottles and Containers Market Volume (Trillion) Forecast, by Application 2020 & 2033
- Table 53: South Africa Glass Bottles and Containers Market Revenue (billion) Forecast, by Application 2020 & 2033
- Table 54: South Africa Glass Bottles and Containers Market Volume (Trillion) Forecast, by Application 2020 & 2033
- Table 55: Global Glass Bottles and Containers Market Revenue billion Forecast, by End-user Vertical 2020 & 2033
- Table 56: Global Glass Bottles and Containers Market Volume Trillion Forecast, by End-user Vertical 2020 & 2033
- Table 57: Global Glass Bottles and Containers Market Revenue billion Forecast, by Country 2020 & 2033
- Table 58: Global Glass Bottles and Containers Market Volume Trillion Forecast, by Country 2020 & 2033
- Table 59: Brazil Glass Bottles and Containers Market Revenue (billion) Forecast, by Application 2020 & 2033
- Table 60: Brazil Glass Bottles and Containers Market Volume (Trillion) Forecast, by Application 2020 & 2033
- Table 61: Mexico Glass Bottles and Containers Market Revenue (billion) Forecast, by Application 2020 & 2033
- Table 62: Mexico Glass Bottles and Containers Market Volume (Trillion) Forecast, by Application 2020 & 2033
- Table 63: Argentina Glass Bottles and Containers Market Revenue (billion) Forecast, by Application 2020 & 2033
- Table 64: Argentina Glass Bottles and Containers Market Volume (Trillion) Forecast, by Application 2020 & 2033
Frequently Asked Questions
1. What is the projected Compound Annual Growth Rate (CAGR) of the Glass Bottles and Containers Market?
The projected CAGR is approximately 3.4%.
2. Which companies are prominent players in the Glass Bottles and Containers Market?
Key companies in the market include Saver Glass SAS (The Carlyle Group Inc, Middle East Glass Manufacturing Co SAE, Beatson Clark, Schott AG, Wiegand-glas GmbH, Stoelzle Oberglas GmbH (CAG-holding GmbH), O-I Glass Inc, PGP Glass Private Limited, Vitro SAB de CV, Verallia Packaging, Berlin Packaging LLC, Gaasch Packaging, Vidrala SA, Glassworks International Limited, Ardagh Group S A, BA VIDRO SA (BA Glass BV), SGD SA (SGD Pharma), Vetropack Holding Ltd, VERESCENCE FRANCE, Gerresheimer AG.
3. What are the main segments of the Glass Bottles and Containers Market?
The market segments include End-user Vertical.
4. Can you provide details about the market size?
The market size is estimated to be USD 65.23 billion as of 2022.
5. What are some drivers contributing to market growth?
Growing Demand from Food and Beverage Industry; Sustainability and Recyclability Initiatives Moving Packagers and Consumer Brands to Glass Packaging.
6. What are the notable trends driving market growth?
Wine and Spirits to Lead the Non-alcoholic Beverages Segment.
7. Are there any restraints impacting market growth?
High Carbon Footprint due to Glass Manufacturing; Operation and Logistical Concerns.
8. Can you provide examples of recent developments in the market?
August 2023: O-I Glass, a prominent manufacturer of glass packaging for the food and beverage industry, introduced its innovative "Cento per Cento Sicily" bottles. These bottles showcase a distinct circular economy concept through a custom bottom logo. The entire production of these bottles takes place at O-I's facility in Marsala, Italy. Crafted from a minimum of 90% recycled glass, locally sourced from Sicily, these containers are not only eco-friendly but also remarkably lightweight, weighing a mere 410 grams. This design ensures optimal energy efficiency during the manufacturing process.
9. What pricing options are available for accessing the report?
Pricing options include single-user, multi-user, and enterprise licenses priced at USD 4750, USD 5250, and USD 8750 respectively.
10. Is the market size provided in terms of value or volume?
The market size is provided in terms of value, measured in billion and volume, measured in Trillion.
11. Are there any specific market keywords associated with the report?
Yes, the market keyword associated with the report is "Glass Bottles and Containers Market," which aids in identifying and referencing the specific market segment covered.
12. How do I determine which pricing option suits my needs best?
The pricing options vary based on user requirements and access needs. Individual users may opt for single-user licenses, while businesses requiring broader access may choose multi-user or enterprise licenses for cost-effective access to the report.
13. Are there any additional resources or data provided in the Glass Bottles and Containers Market report?
While the report offers comprehensive insights, it's advisable to review the specific contents or supplementary materials provided to ascertain if additional resources or data are available.
14. How can I stay updated on further developments or reports in the Glass Bottles and Containers Market?
To stay informed about further developments, trends, and reports in the Glass Bottles and Containers Market, consider subscribing to industry newsletters, following relevant companies and organizations, or regularly checking reputable industry news sources and publications.
Methodology
Step 1 - Identification of Relevant Samples Size from Population Database


Step 2 - Approaches for Defining Global Market Size (Value, Volume* & Price*)

Note*: In applicable scenarios
Step 3 - Data Sources
Primary Research
- Web Analytics
- Survey Reports
- Research Institute
- Latest Research Reports
- Opinion Leaders
Secondary Research
- Annual Reports
- White Paper
- Latest Press Release
- Industry Association
- Paid Database
- Investor Presentations

Step 4 - Data Triangulation
Involves using different sources of information in order to increase the validity of a study
These sources are likely to be stakeholders in a program - participants, other researchers, program staff, other community members, and so on.
Then we put all data in single framework & apply various statistical tools to find out the dynamic on the market.
During the analysis stage, feedback from the stakeholder groups would be compared to determine areas of agreement as well as areas of divergence