
Key Insights
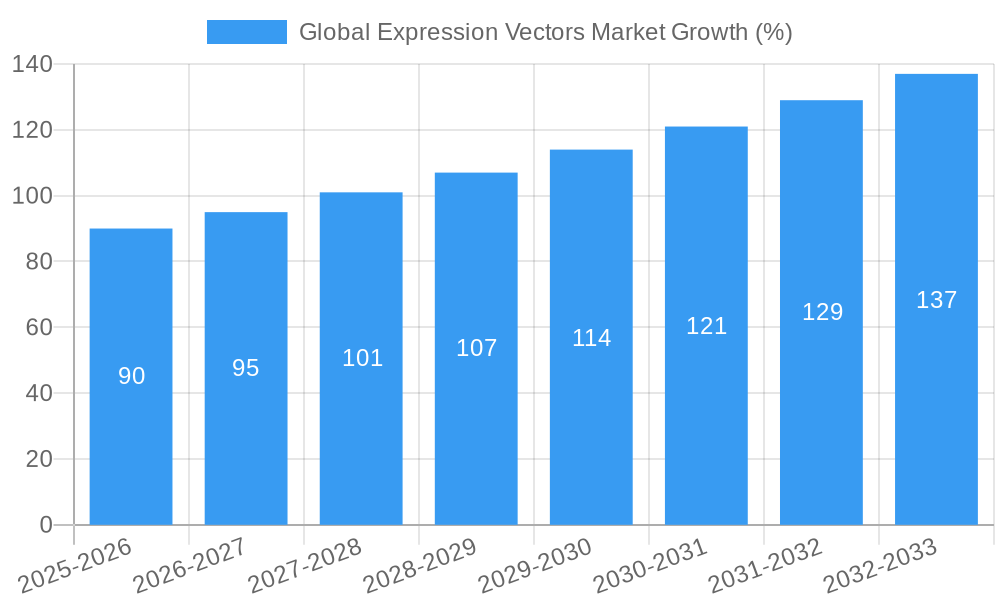
The global expression vectors market is experiencing robust growth, driven by the escalating demand for advanced therapeutic and research applications. The market's Compound Annual Growth Rate (CAGR) of 5.60% from 2019 to 2024 suggests a significant expansion, projected to continue throughout the forecast period (2025-2033). This growth is fueled by several key factors, including the rising prevalence of chronic diseases necessitating innovative therapeutic solutions, increased investment in research and development within the pharmaceutical and biotechnology sectors, and the growing adoption of advanced gene editing techniques. The market is segmented by host type (bacterial, mammalian, insect, yeast, and others), application (therapeutic, research, and industrial), and end-user (pharmaceutical and biotechnology companies, CROs/CMOs, and academic research institutes). Mammalian expression vectors currently hold a significant market share due to their ability to produce complex proteins for therapeutic applications, but the bacterial expression vector segment is expected to witness substantial growth due to its cost-effectiveness and ease of use. The North American region is expected to dominate the market, owing to strong research infrastructure, substantial funding, and the presence of key players. However, the Asia-Pacific region is projected to experience the fastest growth rate, driven by rising healthcare expenditure and increasing government initiatives to promote the biotechnology sector. The market faces certain restraints, including the high cost of developing and manufacturing advanced expression vectors and stringent regulatory approvals. However, the ongoing technological advancements and the emergence of novel applications are anticipated to offset these challenges and fuel further market expansion. Major players like Takara Holdings, Promega, Merck KGaA, GenScript, and Thermo Fisher Scientific are key contributors to market growth through their innovative product offerings and strategic partnerships.
The continued expansion of the expression vectors market is largely dependent on the success of ongoing research in gene therapy and personalized medicine. Technological advancements such as CRISPR-Cas9 gene editing and the development of more efficient and safer viral and non-viral delivery systems are crucial factors influencing future market growth. The increasing collaborations between pharmaceutical companies, research institutions, and CROs/CMOs are fostering innovation and accelerating the development and commercialization of new expression vector technologies. The future of the market hinges on continued investment in research and development, the streamlining of regulatory pathways, and the successful translation of preclinical research into commercially viable therapeutics and diagnostic tools. Furthermore, the market is expected to witness the emergence of novel expression vectors with enhanced efficiency, safety, and scalability, leading to increased adoption across diverse applications. The focus on personalized medicine and targeted therapies is also expected to contribute significantly to market growth in the coming years.
Global Expression Vectors Market: A Comprehensive Report (2019-2033)
This in-depth report provides a comprehensive analysis of the global expression vectors market, offering invaluable insights for stakeholders across the pharmaceutical, biotechnology, and research sectors. The study covers the period from 2019 to 2033, with 2025 serving as the base and estimated year. The report segments the market by host type, application, and end-user, detailing market size, growth projections, competitive dynamics, and key trends. This detailed analysis includes crucial information on market concentration, innovation, dominant segments, product developments, and challenges, equipping readers with actionable intelligence for strategic decision-making.
Global Expression Vectors Market Market Concentration & Innovation
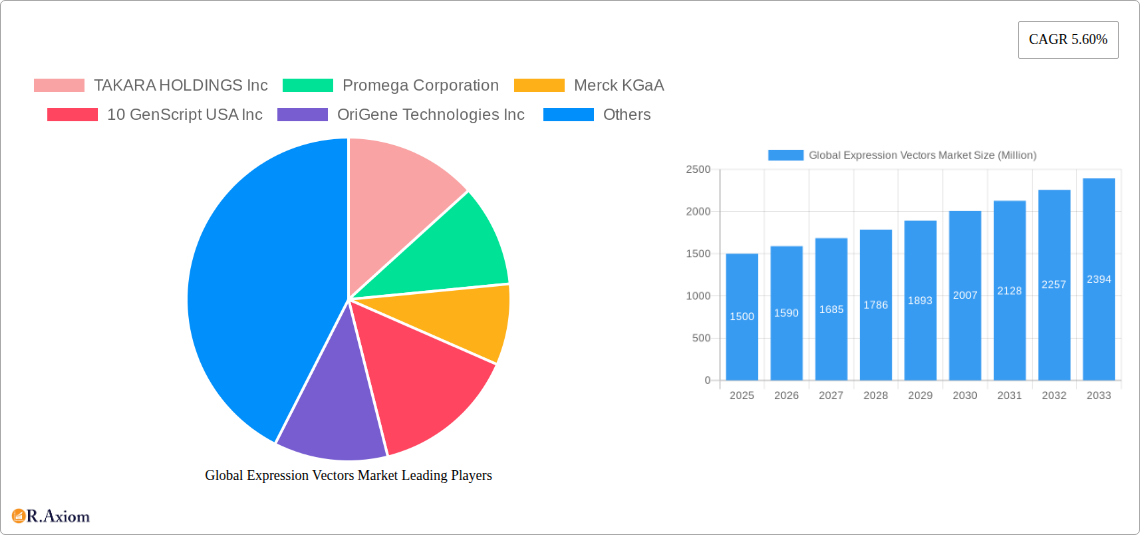
The global expression vectors market exhibits a moderately concentrated landscape, with several key players holding significant market share. The top ten companies—TAKARA HOLDINGS Inc, Promega Corporation, Merck KGaA, 10 GenScript USA Inc, OriGene Technologies Inc, Thermo Fisher Scientific Inc, New England Biolabs, Sigma-Aldrich Corporation, System Biosciences LLC, and Bio-Rad Laboratories—account for approximately xx% of the total market revenue in 2025. Market share fluctuations are influenced by factors such as R&D investment, product innovation, and strategic partnerships. Innovation within the sector is driven by the demand for advanced expression systems, high-throughput screening technologies, and customized vectors tailored to specific applications. Stringent regulatory frameworks governing the development and commercialization of expression vectors, particularly in therapeutic applications, influence market dynamics. Product substitutes, such as cell-free protein synthesis systems, offer alternative approaches but haven't yet significantly impacted the dominance of expression vectors. End-user trends, particularly the growing demand for personalized medicine and advanced therapies, fuel market growth. Mergers and acquisitions (M&A) activity has been moderate, with recent deals, such as Catalent's acquisition of Delphi Genetics in 2021, focusing on strengthening manufacturing capabilities. The total value of M&A deals in the period 2019-2024 is estimated at xx Million.
Global Expression Vectors Market Industry Trends & Insights
The global expression vectors market is experiencing robust growth, driven by the increasing adoption of advanced biotechnology techniques in various sectors. The market is projected to witness a Compound Annual Growth Rate (CAGR) of xx% during the forecast period (2025-2033). This growth is fueled by the rising prevalence of chronic diseases, increasing demand for biologics, and escalating investments in research and development across the pharmaceutical and biotechnology sectors. Technological advancements, such as CRISPR-Cas9 gene editing and next-generation sequencing, are further bolstering market expansion. Consumer preferences are shifting towards more efficient, cost-effective, and customizable expression vectors. Intense competition among established players and emerging companies drives innovation and fosters market expansion. Market penetration of advanced expression systems, such as those utilizing mammalian cells, is steadily increasing, driven by the demand for superior protein production yields and post-translational modifications. The market share of bacterial expression vectors, while still substantial, is anticipated to decline slightly over the forecast period.
Dominant Markets & Segments in Global Expression Vectors Market
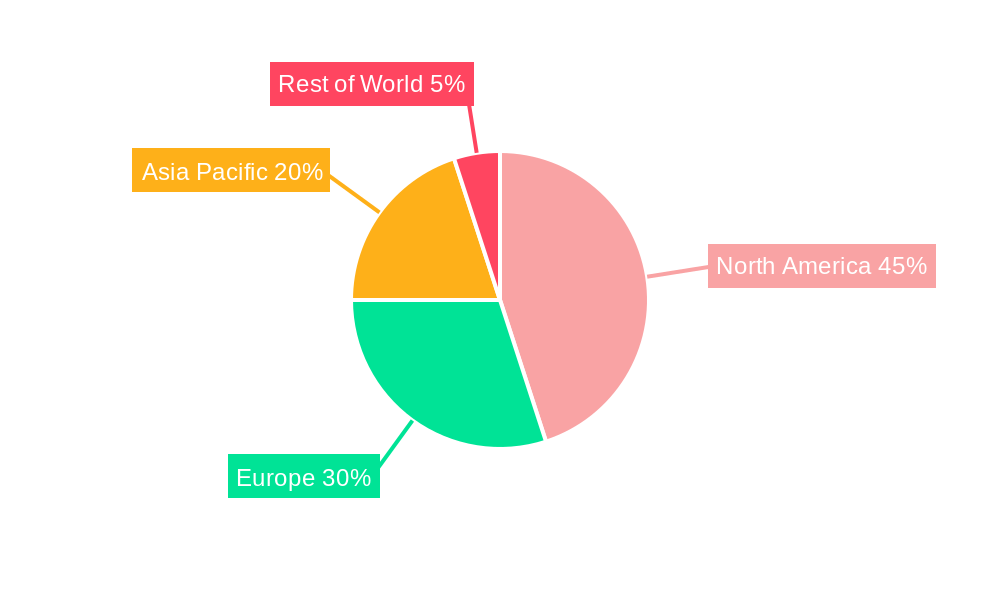
Dominant Region: North America holds the largest market share, primarily due to the presence of major players, robust research infrastructure, and substantial funding for biotechnology research. Europe follows as the second-largest market.
Dominant Segment (By Host Type): Mammalian expression vectors dominate the market due to their ability to produce proteins with accurate post-translational modifications, making them particularly suitable for therapeutic applications.
Dominant Segment (By Application): Therapeutic applications constitute the largest segment, driven by the growing demand for biologics, advanced therapies, and personalized medicine.
Dominant Segment (By End-User): Pharmaceutical and biotechnology companies dominate the end-user segment, accounting for the majority of expression vector utilization.
Key Drivers:
- North America: Strong government funding for research, presence of major pharmaceutical and biotech companies, and advanced research infrastructure.
- Europe: Growing biotechnology sector, increasing research and development investments, and supportive regulatory environment.
- Asia-Pacific: Rapid economic growth, rising healthcare expenditure, and increasing adoption of advanced technologies.
Global Expression Vectors Market Product Developments
Recent product developments have focused on enhancing the efficiency, scalability, and versatility of expression vectors. Innovations include the development of novel promoters, optimized codon usage, and the integration of advanced selection markers. These advancements aim to improve protein yields, reduce production costs, and expand the range of applications for expression vectors. The market is witnessing a growing demand for custom-designed expression vectors tailored to specific protein production needs. This trend is driven by the increasing complexity of therapeutic proteins and the need for precise control over protein expression levels and post-translational modifications. This adaptability and customization cater to various research, pharmaceutical, and industrial applications, further driving market growth.
Report Scope & Segmentation Analysis
The report comprehensively segments the global expression vectors market across several key parameters:
By Host Type: Bacterial Expression Vectors, Mammalian Expression Vectors, Insect Expression Vectors, Yeast Expression Vectors, Other Expression Vectors. Each segment's growth trajectory and market size are analyzed, considering factors such as production efficiency and cost-effectiveness.
By Application: Therapeutic Applications, Research Applications, Industrial Applications. The report details the market size and growth projections for each application segment based on factors such as the increasing demand for biologics in therapeutics, expansion of research activities, and industrial applications of protein production.
By End-User: Pharmaceutical and Biotechnology Companies, Contract Research Organizations (CROs) and Contract Manufacturing Organizations (CMOs), Academic Research Institutes. The varying demands and market size for each end-user segment are assessed, focusing on the growth of CROs and CMOs and the significant role of pharmaceutical companies.
Key Drivers of Global Expression Vectors Market Growth
Several factors drive the expansion of the global expression vectors market. Firstly, the increasing prevalence of chronic diseases necessitates the development of novel biologics, boosting demand for efficient expression systems. Secondly, advancements in gene editing technologies, such as CRISPR-Cas9, are expanding the potential applications of expression vectors in gene therapy and personalized medicine. Thirdly, continuous research and development efforts to enhance the efficiency, safety, and cost-effectiveness of expression systems fuel market growth. Finally, supportive government policies and increasing investments in biotechnology research globally are significant contributors.
Challenges in the Global Expression Vectors Market Sector
Despite significant growth potential, challenges exist within the global expression vectors market. Regulatory hurdles associated with the development and approval of novel expression systems, especially in the therapeutic arena, pose a significant barrier. Supply chain disruptions and fluctuations in raw material costs can impact production and profitability. Intense competition among existing players and the emergence of new technologies require continuous innovation and adaptation. These challenges contribute to an uneven market environment requiring adaptability from market participants.
Emerging Opportunities in Global Expression Vectors Market
Emerging opportunities lie in the development of novel expression systems tailored for specific applications, including next-generation gene editing technologies and cell and gene therapies. The increasing adoption of automation and high-throughput screening technologies opens new avenues for streamlined and cost-effective vector production. Expanding into emerging markets with growing healthcare expenditure and increasing research activities presents significant growth potential. The focus on personalized medicine and custom vector design represents a growing niche market opportunity.
Leading Players in the Global Expression Vectors Market Market
- TAKARA HOLDINGS Inc
- Promega Corporation
- Merck KGaA
- 10 GenScript USA Inc
- OriGene Technologies Inc
- Thermo Fisher Scientific Inc
- New England Biolabs
- Sigma-Aldrich Corporation
- System Biosciences LLC
- DNA
- Bio-Rad Laboratories
- QIAGEN
- Agilent Technologies
Key Developments in Global Expression Vectors Market Industry
August 2022: Thermo Fisher Scientific launched a viral vector manufacturing facility in Plainville, Massachusetts, expanding its capabilities in cell and gene therapy. This significantly enhanced their production capacity and market position.
February 2021: Catalent acquired Delphi Genetics and opened a US plasmid manufacturing facility, establishing global pDNA development and manufacturing capabilities. This acquisition strengthened Catalent's position in the plasmid DNA market.
Strategic Outlook for Global Expression Vectors Market Market
The global expression vectors market is poised for sustained growth, driven by ongoing advancements in biotechnology, increasing demand for advanced therapies, and substantial investment in research and development. The focus on personalized medicine, gene editing, and cell and gene therapies will significantly impact market dynamics. Companies strategically investing in innovation, capacity expansion, and strategic partnerships are expected to capture significant market share and drive future growth. The market presents opportunities for both established players and emerging companies focusing on niche applications and innovative technologies.
Global Expression Vectors Market Segmentation
-
1. Host Type
- 1.1. Bacterial Expression Vectors
- 1.2. Mammalian Expression Vectors
- 1.3. Insect Expression Vectors
- 1.4. Yeast Expression Vectors
- 1.5. Other Expression Vectors
-
2. Application
- 2.1. Therapeutic Applications
- 2.2. Research Applications
- 2.3. Industrial Applications
-
3. End-User
- 3.1. Pharmaceutical and Biotechnology Companies
- 3.2. Contract
- 3.3. Academic Research Institutes
Global Expression Vectors Market Segmentation By Geography
-
1. North America
- 1.1. United States
- 1.2. Canada
- 1.3. Mexico
-
2. Europe
- 2.1. Germany
- 2.2. United Kingdom
- 2.3. France
- 2.4. Italy
- 2.5. Spain
- 2.6. Rest of Europe
-
3. Asia Pacific
- 3.1. China
- 3.2. Japan
- 3.3. India
- 3.4. Australia
- 3.5. South Korea
- 3.6. Rest of Asia Pacific
-
4. Middle East and Africa
- 4.1. GCC
- 4.2. South Africa
- 4.3. Rest of Middle East and Africa
-
5. South America
- 5.1. Brazil
- 5.2. Argentina
- 5.3. Rest of South America
Global Expression Vectors Market REPORT HIGHLIGHTS
| Aspects | Details |
|---|---|
| Study Period | 2019-2033 |
| Base Year | 2024 |
| Estimated Year | 2025 |
| Forecast Period | 2025-2033 |
| Historical Period | 2019-2024 |
| Growth Rate | CAGR of 5.60% from 2019-2033 |
| Segmentation |
|
Table of Contents
- 1. Introduction
- 1.1. Research Scope
- 1.2. Market Segmentation
- 1.3. Research Methodology
- 1.4. Definitions and Assumptions
- 2. Executive Summary
- 2.1. Introduction
- 3. Market Dynamics
- 3.1. Introduction
- 3.2. Market Drivers
- 3.2.1 Increase in Demand of Protein-Based Biologics; High Prevalence Rate of Lifestyle Diseases
- 3.2.2 Infectious Diseases and Genetic Disorders; Funding for Protein Research
- 3.3. Market Restrains
- 3.3.1. High Cost of Protein Therapy
- 3.4. Market Trends
- 3.4.1. Bacterial expression vectors are Expected to Witness High Growth Over the Forecast Period
- 4. Market Factor Analysis
- 4.1. Porters Five Forces
- 4.2. Supply/Value Chain
- 4.3. PESTEL analysis
- 4.4. Market Entropy
- 4.5. Patent/Trademark Analysis
- 5. Global Expression Vectors Market Analysis, Insights and Forecast, 2019-2031
- 5.1. Market Analysis, Insights and Forecast - by Host Type
- 5.1.1. Bacterial Expression Vectors
- 5.1.2. Mammalian Expression Vectors
- 5.1.3. Insect Expression Vectors
- 5.1.4. Yeast Expression Vectors
- 5.1.5. Other Expression Vectors
- 5.2. Market Analysis, Insights and Forecast - by Application
- 5.2.1. Therapeutic Applications
- 5.2.2. Research Applications
- 5.2.3. Industrial Applications
- 5.3. Market Analysis, Insights and Forecast - by End-User
- 5.3.1. Pharmaceutical and Biotechnology Companies
- 5.3.2. Contract
- 5.3.3. Academic Research Institutes
- 5.4. Market Analysis, Insights and Forecast - by Region
- 5.4.1. North America
- 5.4.2. Europe
- 5.4.3. Asia Pacific
- 5.4.4. Middle East and Africa
- 5.4.5. South America
- 5.1. Market Analysis, Insights and Forecast - by Host Type
- 6. North America Global Expression Vectors Market Analysis, Insights and Forecast, 2019-2031
- 6.1. Market Analysis, Insights and Forecast - by Host Type
- 6.1.1. Bacterial Expression Vectors
- 6.1.2. Mammalian Expression Vectors
- 6.1.3. Insect Expression Vectors
- 6.1.4. Yeast Expression Vectors
- 6.1.5. Other Expression Vectors
- 6.2. Market Analysis, Insights and Forecast - by Application
- 6.2.1. Therapeutic Applications
- 6.2.2. Research Applications
- 6.2.3. Industrial Applications
- 6.3. Market Analysis, Insights and Forecast - by End-User
- 6.3.1. Pharmaceutical and Biotechnology Companies
- 6.3.2. Contract
- 6.3.3. Academic Research Institutes
- 6.1. Market Analysis, Insights and Forecast - by Host Type
- 7. Europe Global Expression Vectors Market Analysis, Insights and Forecast, 2019-2031
- 7.1. Market Analysis, Insights and Forecast - by Host Type
- 7.1.1. Bacterial Expression Vectors
- 7.1.2. Mammalian Expression Vectors
- 7.1.3. Insect Expression Vectors
- 7.1.4. Yeast Expression Vectors
- 7.1.5. Other Expression Vectors
- 7.2. Market Analysis, Insights and Forecast - by Application
- 7.2.1. Therapeutic Applications
- 7.2.2. Research Applications
- 7.2.3. Industrial Applications
- 7.3. Market Analysis, Insights and Forecast - by End-User
- 7.3.1. Pharmaceutical and Biotechnology Companies
- 7.3.2. Contract
- 7.3.3. Academic Research Institutes
- 7.1. Market Analysis, Insights and Forecast - by Host Type
- 8. Asia Pacific Global Expression Vectors Market Analysis, Insights and Forecast, 2019-2031
- 8.1. Market Analysis, Insights and Forecast - by Host Type
- 8.1.1. Bacterial Expression Vectors
- 8.1.2. Mammalian Expression Vectors
- 8.1.3. Insect Expression Vectors
- 8.1.4. Yeast Expression Vectors
- 8.1.5. Other Expression Vectors
- 8.2. Market Analysis, Insights and Forecast - by Application
- 8.2.1. Therapeutic Applications
- 8.2.2. Research Applications
- 8.2.3. Industrial Applications
- 8.3. Market Analysis, Insights and Forecast - by End-User
- 8.3.1. Pharmaceutical and Biotechnology Companies
- 8.3.2. Contract
- 8.3.3. Academic Research Institutes
- 8.1. Market Analysis, Insights and Forecast - by Host Type
- 9. Middle East and Africa Global Expression Vectors Market Analysis, Insights and Forecast, 2019-2031
- 9.1. Market Analysis, Insights and Forecast - by Host Type
- 9.1.1. Bacterial Expression Vectors
- 9.1.2. Mammalian Expression Vectors
- 9.1.3. Insect Expression Vectors
- 9.1.4. Yeast Expression Vectors
- 9.1.5. Other Expression Vectors
- 9.2. Market Analysis, Insights and Forecast - by Application
- 9.2.1. Therapeutic Applications
- 9.2.2. Research Applications
- 9.2.3. Industrial Applications
- 9.3. Market Analysis, Insights and Forecast - by End-User
- 9.3.1. Pharmaceutical and Biotechnology Companies
- 9.3.2. Contract
- 9.3.3. Academic Research Institutes
- 9.1. Market Analysis, Insights and Forecast - by Host Type
- 10. South America Global Expression Vectors Market Analysis, Insights and Forecast, 2019-2031
- 10.1. Market Analysis, Insights and Forecast - by Host Type
- 10.1.1. Bacterial Expression Vectors
- 10.1.2. Mammalian Expression Vectors
- 10.1.3. Insect Expression Vectors
- 10.1.4. Yeast Expression Vectors
- 10.1.5. Other Expression Vectors
- 10.2. Market Analysis, Insights and Forecast - by Application
- 10.2.1. Therapeutic Applications
- 10.2.2. Research Applications
- 10.2.3. Industrial Applications
- 10.3. Market Analysis, Insights and Forecast - by End-User
- 10.3.1. Pharmaceutical and Biotechnology Companies
- 10.3.2. Contract
- 10.3.3. Academic Research Institutes
- 10.1. Market Analysis, Insights and Forecast - by Host Type
- 11. North America Global Expression Vectors Market Analysis, Insights and Forecast, 2019-2031
- 11.1. Market Analysis, Insights and Forecast - By Country/Sub-region
- 11.1.1 United States
- 11.1.2 Canada
- 11.1.3 Mexico
- 12. Europe Global Expression Vectors Market Analysis, Insights and Forecast, 2019-2031
- 12.1. Market Analysis, Insights and Forecast - By Country/Sub-region
- 12.1.1 Germany
- 12.1.2 United Kingdom
- 12.1.3 France
- 12.1.4 Italy
- 12.1.5 Spain
- 12.1.6 Rest of Europe
- 13. Asia Pacific Global Expression Vectors Market Analysis, Insights and Forecast, 2019-2031
- 13.1. Market Analysis, Insights and Forecast - By Country/Sub-region
- 13.1.1 China
- 13.1.2 Japan
- 13.1.3 India
- 13.1.4 Australia
- 13.1.5 South Korea
- 13.1.6 Rest of Asia Pacific
- 14. Middle East and Africa Global Expression Vectors Market Analysis, Insights and Forecast, 2019-2031
- 14.1. Market Analysis, Insights and Forecast - By Country/Sub-region
- 14.1.1 GCC
- 14.1.2 South Africa
- 14.1.3 Rest of Middle East and Africa
- 15. South America Global Expression Vectors Market Analysis, Insights and Forecast, 2019-2031
- 15.1. Market Analysis, Insights and Forecast - By Country/Sub-region
- 15.1.1 Brazil
- 15.1.2 Argentina
- 15.1.3 Rest of South America
- 16. Competitive Analysis
- 16.1. Market Share Analysis 2024
- 16.2. Company Profiles
- 16.2.1 TAKARA HOLDINGS Inc
- 16.2.1.1. Overview
- 16.2.1.2. Products
- 16.2.1.3. SWOT Analysis
- 16.2.1.4. Recent Developments
- 16.2.1.5. Financials (Based on Availability)
- 16.2.2 Promega Corporation
- 16.2.2.1. Overview
- 16.2.2.2. Products
- 16.2.2.3. SWOT Analysis
- 16.2.2.4. Recent Developments
- 16.2.2.5. Financials (Based on Availability)
- 16.2.3 Merck KGaA
- 16.2.3.1. Overview
- 16.2.3.2. Products
- 16.2.3.3. SWOT Analysis
- 16.2.3.4. Recent Developments
- 16.2.3.5. Financials (Based on Availability)
- 16.2.4 10 GenScript USA Inc
- 16.2.4.1. Overview
- 16.2.4.2. Products
- 16.2.4.3. SWOT Analysis
- 16.2.4.4. Recent Developments
- 16.2.4.5. Financials (Based on Availability)
- 16.2.5 OriGene Technologies Inc
- 16.2.5.1. Overview
- 16.2.5.2. Products
- 16.2.5.3. SWOT Analysis
- 16.2.5.4. Recent Developments
- 16.2.5.5. Financials (Based on Availability)
- 16.2.6 Thermo Fisher Scientific Inc
- 16.2.6.1. Overview
- 16.2.6.2. Products
- 16.2.6.3. SWOT Analysis
- 16.2.6.4. Recent Developments
- 16.2.6.5. Financials (Based on Availability)
- 16.2.7 New England Biolabs
- 16.2.7.1. Overview
- 16.2.7.2. Products
- 16.2.7.3. SWOT Analysis
- 16.2.7.4. Recent Developments
- 16.2.7.5. Financials (Based on Availability)
- 16.2.8 Sigma-Aldrich Corporation
- 16.2.8.1. Overview
- 16.2.8.2. Products
- 16.2.8.3. SWOT Analysis
- 16.2.8.4. Recent Developments
- 16.2.8.5. Financials (Based on Availability)
- 16.2.9 System Biosciences LLC
- 16.2.9.1. Overview
- 16.2.9.2. Products
- 16.2.9.3. SWOT Analysis
- 16.2.9.4. Recent Developments
- 16.2.9.5. Financials (Based on Availability)
- 16.2.10 DNA
- 16.2.10.1. Overview
- 16.2.10.2. Products
- 16.2.10.3. SWOT Analysis
- 16.2.10.4. Recent Developments
- 16.2.10.5. Financials (Based on Availability)
- 16.2.11 Bio-Rad Laboratories
- 16.2.11.1. Overview
- 16.2.11.2. Products
- 16.2.11.3. SWOT Analysis
- 16.2.11.4. Recent Developments
- 16.2.11.5. Financials (Based on Availability)
- 16.2.12 QIAGEN
- 16.2.12.1. Overview
- 16.2.12.2. Products
- 16.2.12.3. SWOT Analysis
- 16.2.12.4. Recent Developments
- 16.2.12.5. Financials (Based on Availability)
- 16.2.13 Agilent Technologies
- 16.2.13.1. Overview
- 16.2.13.2. Products
- 16.2.13.3. SWOT Analysis
- 16.2.13.4. Recent Developments
- 16.2.13.5. Financials (Based on Availability)
- 16.2.1 TAKARA HOLDINGS Inc
List of Figures
- Figure 1: Global Global Expression Vectors Market Revenue Breakdown (Million, %) by Region 2024 & 2032
- Figure 2: Global Global Expression Vectors Market Volume Breakdown (K Unit, %) by Region 2024 & 2032
- Figure 3: North America Global Expression Vectors Market Revenue (Million), by Country 2024 & 2032
- Figure 4: North America Global Expression Vectors Market Volume (K Unit), by Country 2024 & 2032
- Figure 5: North America Global Expression Vectors Market Revenue Share (%), by Country 2024 & 2032
- Figure 6: North America Global Expression Vectors Market Volume Share (%), by Country 2024 & 2032
- Figure 7: Europe Global Expression Vectors Market Revenue (Million), by Country 2024 & 2032
- Figure 8: Europe Global Expression Vectors Market Volume (K Unit), by Country 2024 & 2032
- Figure 9: Europe Global Expression Vectors Market Revenue Share (%), by Country 2024 & 2032
- Figure 10: Europe Global Expression Vectors Market Volume Share (%), by Country 2024 & 2032
- Figure 11: Asia Pacific Global Expression Vectors Market Revenue (Million), by Country 2024 & 2032
- Figure 12: Asia Pacific Global Expression Vectors Market Volume (K Unit), by Country 2024 & 2032
- Figure 13: Asia Pacific Global Expression Vectors Market Revenue Share (%), by Country 2024 & 2032
- Figure 14: Asia Pacific Global Expression Vectors Market Volume Share (%), by Country 2024 & 2032
- Figure 15: Middle East and Africa Global Expression Vectors Market Revenue (Million), by Country 2024 & 2032
- Figure 16: Middle East and Africa Global Expression Vectors Market Volume (K Unit), by Country 2024 & 2032
- Figure 17: Middle East and Africa Global Expression Vectors Market Revenue Share (%), by Country 2024 & 2032
- Figure 18: Middle East and Africa Global Expression Vectors Market Volume Share (%), by Country 2024 & 2032
- Figure 19: South America Global Expression Vectors Market Revenue (Million), by Country 2024 & 2032
- Figure 20: South America Global Expression Vectors Market Volume (K Unit), by Country 2024 & 2032
- Figure 21: South America Global Expression Vectors Market Revenue Share (%), by Country 2024 & 2032
- Figure 22: South America Global Expression Vectors Market Volume Share (%), by Country 2024 & 2032
- Figure 23: North America Global Expression Vectors Market Revenue (Million), by Host Type 2024 & 2032
- Figure 24: North America Global Expression Vectors Market Volume (K Unit), by Host Type 2024 & 2032
- Figure 25: North America Global Expression Vectors Market Revenue Share (%), by Host Type 2024 & 2032
- Figure 26: North America Global Expression Vectors Market Volume Share (%), by Host Type 2024 & 2032
- Figure 27: North America Global Expression Vectors Market Revenue (Million), by Application 2024 & 2032
- Figure 28: North America Global Expression Vectors Market Volume (K Unit), by Application 2024 & 2032
- Figure 29: North America Global Expression Vectors Market Revenue Share (%), by Application 2024 & 2032
- Figure 30: North America Global Expression Vectors Market Volume Share (%), by Application 2024 & 2032
- Figure 31: North America Global Expression Vectors Market Revenue (Million), by End-User 2024 & 2032
- Figure 32: North America Global Expression Vectors Market Volume (K Unit), by End-User 2024 & 2032
- Figure 33: North America Global Expression Vectors Market Revenue Share (%), by End-User 2024 & 2032
- Figure 34: North America Global Expression Vectors Market Volume Share (%), by End-User 2024 & 2032
- Figure 35: North America Global Expression Vectors Market Revenue (Million), by Country 2024 & 2032
- Figure 36: North America Global Expression Vectors Market Volume (K Unit), by Country 2024 & 2032
- Figure 37: North America Global Expression Vectors Market Revenue Share (%), by Country 2024 & 2032
- Figure 38: North America Global Expression Vectors Market Volume Share (%), by Country 2024 & 2032
- Figure 39: Europe Global Expression Vectors Market Revenue (Million), by Host Type 2024 & 2032
- Figure 40: Europe Global Expression Vectors Market Volume (K Unit), by Host Type 2024 & 2032
- Figure 41: Europe Global Expression Vectors Market Revenue Share (%), by Host Type 2024 & 2032
- Figure 42: Europe Global Expression Vectors Market Volume Share (%), by Host Type 2024 & 2032
- Figure 43: Europe Global Expression Vectors Market Revenue (Million), by Application 2024 & 2032
- Figure 44: Europe Global Expression Vectors Market Volume (K Unit), by Application 2024 & 2032
- Figure 45: Europe Global Expression Vectors Market Revenue Share (%), by Application 2024 & 2032
- Figure 46: Europe Global Expression Vectors Market Volume Share (%), by Application 2024 & 2032
- Figure 47: Europe Global Expression Vectors Market Revenue (Million), by End-User 2024 & 2032
- Figure 48: Europe Global Expression Vectors Market Volume (K Unit), by End-User 2024 & 2032
- Figure 49: Europe Global Expression Vectors Market Revenue Share (%), by End-User 2024 & 2032
- Figure 50: Europe Global Expression Vectors Market Volume Share (%), by End-User 2024 & 2032
- Figure 51: Europe Global Expression Vectors Market Revenue (Million), by Country 2024 & 2032
- Figure 52: Europe Global Expression Vectors Market Volume (K Unit), by Country 2024 & 2032
- Figure 53: Europe Global Expression Vectors Market Revenue Share (%), by Country 2024 & 2032
- Figure 54: Europe Global Expression Vectors Market Volume Share (%), by Country 2024 & 2032
- Figure 55: Asia Pacific Global Expression Vectors Market Revenue (Million), by Host Type 2024 & 2032
- Figure 56: Asia Pacific Global Expression Vectors Market Volume (K Unit), by Host Type 2024 & 2032
- Figure 57: Asia Pacific Global Expression Vectors Market Revenue Share (%), by Host Type 2024 & 2032
- Figure 58: Asia Pacific Global Expression Vectors Market Volume Share (%), by Host Type 2024 & 2032
- Figure 59: Asia Pacific Global Expression Vectors Market Revenue (Million), by Application 2024 & 2032
- Figure 60: Asia Pacific Global Expression Vectors Market Volume (K Unit), by Application 2024 & 2032
- Figure 61: Asia Pacific Global Expression Vectors Market Revenue Share (%), by Application 2024 & 2032
- Figure 62: Asia Pacific Global Expression Vectors Market Volume Share (%), by Application 2024 & 2032
- Figure 63: Asia Pacific Global Expression Vectors Market Revenue (Million), by End-User 2024 & 2032
- Figure 64: Asia Pacific Global Expression Vectors Market Volume (K Unit), by End-User 2024 & 2032
- Figure 65: Asia Pacific Global Expression Vectors Market Revenue Share (%), by End-User 2024 & 2032
- Figure 66: Asia Pacific Global Expression Vectors Market Volume Share (%), by End-User 2024 & 2032
- Figure 67: Asia Pacific Global Expression Vectors Market Revenue (Million), by Country 2024 & 2032
- Figure 68: Asia Pacific Global Expression Vectors Market Volume (K Unit), by Country 2024 & 2032
- Figure 69: Asia Pacific Global Expression Vectors Market Revenue Share (%), by Country 2024 & 2032
- Figure 70: Asia Pacific Global Expression Vectors Market Volume Share (%), by Country 2024 & 2032
- Figure 71: Middle East and Africa Global Expression Vectors Market Revenue (Million), by Host Type 2024 & 2032
- Figure 72: Middle East and Africa Global Expression Vectors Market Volume (K Unit), by Host Type 2024 & 2032
- Figure 73: Middle East and Africa Global Expression Vectors Market Revenue Share (%), by Host Type 2024 & 2032
- Figure 74: Middle East and Africa Global Expression Vectors Market Volume Share (%), by Host Type 2024 & 2032
- Figure 75: Middle East and Africa Global Expression Vectors Market Revenue (Million), by Application 2024 & 2032
- Figure 76: Middle East and Africa Global Expression Vectors Market Volume (K Unit), by Application 2024 & 2032
- Figure 77: Middle East and Africa Global Expression Vectors Market Revenue Share (%), by Application 2024 & 2032
- Figure 78: Middle East and Africa Global Expression Vectors Market Volume Share (%), by Application 2024 & 2032
- Figure 79: Middle East and Africa Global Expression Vectors Market Revenue (Million), by End-User 2024 & 2032
- Figure 80: Middle East and Africa Global Expression Vectors Market Volume (K Unit), by End-User 2024 & 2032
- Figure 81: Middle East and Africa Global Expression Vectors Market Revenue Share (%), by End-User 2024 & 2032
- Figure 82: Middle East and Africa Global Expression Vectors Market Volume Share (%), by End-User 2024 & 2032
- Figure 83: Middle East and Africa Global Expression Vectors Market Revenue (Million), by Country 2024 & 2032
- Figure 84: Middle East and Africa Global Expression Vectors Market Volume (K Unit), by Country 2024 & 2032
- Figure 85: Middle East and Africa Global Expression Vectors Market Revenue Share (%), by Country 2024 & 2032
- Figure 86: Middle East and Africa Global Expression Vectors Market Volume Share (%), by Country 2024 & 2032
- Figure 87: South America Global Expression Vectors Market Revenue (Million), by Host Type 2024 & 2032
- Figure 88: South America Global Expression Vectors Market Volume (K Unit), by Host Type 2024 & 2032
- Figure 89: South America Global Expression Vectors Market Revenue Share (%), by Host Type 2024 & 2032
- Figure 90: South America Global Expression Vectors Market Volume Share (%), by Host Type 2024 & 2032
- Figure 91: South America Global Expression Vectors Market Revenue (Million), by Application 2024 & 2032
- Figure 92: South America Global Expression Vectors Market Volume (K Unit), by Application 2024 & 2032
- Figure 93: South America Global Expression Vectors Market Revenue Share (%), by Application 2024 & 2032
- Figure 94: South America Global Expression Vectors Market Volume Share (%), by Application 2024 & 2032
- Figure 95: South America Global Expression Vectors Market Revenue (Million), by End-User 2024 & 2032
- Figure 96: South America Global Expression Vectors Market Volume (K Unit), by End-User 2024 & 2032
- Figure 97: South America Global Expression Vectors Market Revenue Share (%), by End-User 2024 & 2032
- Figure 98: South America Global Expression Vectors Market Volume Share (%), by End-User 2024 & 2032
- Figure 99: South America Global Expression Vectors Market Revenue (Million), by Country 2024 & 2032
- Figure 100: South America Global Expression Vectors Market Volume (K Unit), by Country 2024 & 2032
- Figure 101: South America Global Expression Vectors Market Revenue Share (%), by Country 2024 & 2032
- Figure 102: South America Global Expression Vectors Market Volume Share (%), by Country 2024 & 2032
List of Tables
- Table 1: Global Expression Vectors Market Revenue Million Forecast, by Region 2019 & 2032
- Table 2: Global Expression Vectors Market Volume K Unit Forecast, by Region 2019 & 2032
- Table 3: Global Expression Vectors Market Revenue Million Forecast, by Host Type 2019 & 2032
- Table 4: Global Expression Vectors Market Volume K Unit Forecast, by Host Type 2019 & 2032
- Table 5: Global Expression Vectors Market Revenue Million Forecast, by Application 2019 & 2032
- Table 6: Global Expression Vectors Market Volume K Unit Forecast, by Application 2019 & 2032
- Table 7: Global Expression Vectors Market Revenue Million Forecast, by End-User 2019 & 2032
- Table 8: Global Expression Vectors Market Volume K Unit Forecast, by End-User 2019 & 2032
- Table 9: Global Expression Vectors Market Revenue Million Forecast, by Region 2019 & 2032
- Table 10: Global Expression Vectors Market Volume K Unit Forecast, by Region 2019 & 2032
- Table 11: Global Expression Vectors Market Revenue Million Forecast, by Country 2019 & 2032
- Table 12: Global Expression Vectors Market Volume K Unit Forecast, by Country 2019 & 2032
- Table 13: United States Global Expression Vectors Market Revenue (Million) Forecast, by Application 2019 & 2032
- Table 14: United States Global Expression Vectors Market Volume (K Unit) Forecast, by Application 2019 & 2032
- Table 15: Canada Global Expression Vectors Market Revenue (Million) Forecast, by Application 2019 & 2032
- Table 16: Canada Global Expression Vectors Market Volume (K Unit) Forecast, by Application 2019 & 2032
- Table 17: Mexico Global Expression Vectors Market Revenue (Million) Forecast, by Application 2019 & 2032
- Table 18: Mexico Global Expression Vectors Market Volume (K Unit) Forecast, by Application 2019 & 2032
- Table 19: Global Expression Vectors Market Revenue Million Forecast, by Country 2019 & 2032
- Table 20: Global Expression Vectors Market Volume K Unit Forecast, by Country 2019 & 2032
- Table 21: Germany Global Expression Vectors Market Revenue (Million) Forecast, by Application 2019 & 2032
- Table 22: Germany Global Expression Vectors Market Volume (K Unit) Forecast, by Application 2019 & 2032
- Table 23: United Kingdom Global Expression Vectors Market Revenue (Million) Forecast, by Application 2019 & 2032
- Table 24: United Kingdom Global Expression Vectors Market Volume (K Unit) Forecast, by Application 2019 & 2032
- Table 25: France Global Expression Vectors Market Revenue (Million) Forecast, by Application 2019 & 2032
- Table 26: France Global Expression Vectors Market Volume (K Unit) Forecast, by Application 2019 & 2032
- Table 27: Italy Global Expression Vectors Market Revenue (Million) Forecast, by Application 2019 & 2032
- Table 28: Italy Global Expression Vectors Market Volume (K Unit) Forecast, by Application 2019 & 2032
- Table 29: Spain Global Expression Vectors Market Revenue (Million) Forecast, by Application 2019 & 2032
- Table 30: Spain Global Expression Vectors Market Volume (K Unit) Forecast, by Application 2019 & 2032
- Table 31: Rest of Europe Global Expression Vectors Market Revenue (Million) Forecast, by Application 2019 & 2032
- Table 32: Rest of Europe Global Expression Vectors Market Volume (K Unit) Forecast, by Application 2019 & 2032
- Table 33: Global Expression Vectors Market Revenue Million Forecast, by Country 2019 & 2032
- Table 34: Global Expression Vectors Market Volume K Unit Forecast, by Country 2019 & 2032
- Table 35: China Global Expression Vectors Market Revenue (Million) Forecast, by Application 2019 & 2032
- Table 36: China Global Expression Vectors Market Volume (K Unit) Forecast, by Application 2019 & 2032
- Table 37: Japan Global Expression Vectors Market Revenue (Million) Forecast, by Application 2019 & 2032
- Table 38: Japan Global Expression Vectors Market Volume (K Unit) Forecast, by Application 2019 & 2032
- Table 39: India Global Expression Vectors Market Revenue (Million) Forecast, by Application 2019 & 2032
- Table 40: India Global Expression Vectors Market Volume (K Unit) Forecast, by Application 2019 & 2032
- Table 41: Australia Global Expression Vectors Market Revenue (Million) Forecast, by Application 2019 & 2032
- Table 42: Australia Global Expression Vectors Market Volume (K Unit) Forecast, by Application 2019 & 2032
- Table 43: South Korea Global Expression Vectors Market Revenue (Million) Forecast, by Application 2019 & 2032
- Table 44: South Korea Global Expression Vectors Market Volume (K Unit) Forecast, by Application 2019 & 2032
- Table 45: Rest of Asia Pacific Global Expression Vectors Market Revenue (Million) Forecast, by Application 2019 & 2032
- Table 46: Rest of Asia Pacific Global Expression Vectors Market Volume (K Unit) Forecast, by Application 2019 & 2032
- Table 47: Global Expression Vectors Market Revenue Million Forecast, by Country 2019 & 2032
- Table 48: Global Expression Vectors Market Volume K Unit Forecast, by Country 2019 & 2032
- Table 49: GCC Global Expression Vectors Market Revenue (Million) Forecast, by Application 2019 & 2032
- Table 50: GCC Global Expression Vectors Market Volume (K Unit) Forecast, by Application 2019 & 2032
- Table 51: South Africa Global Expression Vectors Market Revenue (Million) Forecast, by Application 2019 & 2032
- Table 52: South Africa Global Expression Vectors Market Volume (K Unit) Forecast, by Application 2019 & 2032
- Table 53: Rest of Middle East and Africa Global Expression Vectors Market Revenue (Million) Forecast, by Application 2019 & 2032
- Table 54: Rest of Middle East and Africa Global Expression Vectors Market Volume (K Unit) Forecast, by Application 2019 & 2032
- Table 55: Global Expression Vectors Market Revenue Million Forecast, by Country 2019 & 2032
- Table 56: Global Expression Vectors Market Volume K Unit Forecast, by Country 2019 & 2032
- Table 57: Brazil Global Expression Vectors Market Revenue (Million) Forecast, by Application 2019 & 2032
- Table 58: Brazil Global Expression Vectors Market Volume (K Unit) Forecast, by Application 2019 & 2032
- Table 59: Argentina Global Expression Vectors Market Revenue (Million) Forecast, by Application 2019 & 2032
- Table 60: Argentina Global Expression Vectors Market Volume (K Unit) Forecast, by Application 2019 & 2032
- Table 61: Rest of South America Global Expression Vectors Market Revenue (Million) Forecast, by Application 2019 & 2032
- Table 62: Rest of South America Global Expression Vectors Market Volume (K Unit) Forecast, by Application 2019 & 2032
- Table 63: Global Expression Vectors Market Revenue Million Forecast, by Host Type 2019 & 2032
- Table 64: Global Expression Vectors Market Volume K Unit Forecast, by Host Type 2019 & 2032
- Table 65: Global Expression Vectors Market Revenue Million Forecast, by Application 2019 & 2032
- Table 66: Global Expression Vectors Market Volume K Unit Forecast, by Application 2019 & 2032
- Table 67: Global Expression Vectors Market Revenue Million Forecast, by End-User 2019 & 2032
- Table 68: Global Expression Vectors Market Volume K Unit Forecast, by End-User 2019 & 2032
- Table 69: Global Expression Vectors Market Revenue Million Forecast, by Country 2019 & 2032
- Table 70: Global Expression Vectors Market Volume K Unit Forecast, by Country 2019 & 2032
- Table 71: United States Global Expression Vectors Market Revenue (Million) Forecast, by Application 2019 & 2032
- Table 72: United States Global Expression Vectors Market Volume (K Unit) Forecast, by Application 2019 & 2032
- Table 73: Canada Global Expression Vectors Market Revenue (Million) Forecast, by Application 2019 & 2032
- Table 74: Canada Global Expression Vectors Market Volume (K Unit) Forecast, by Application 2019 & 2032
- Table 75: Mexico Global Expression Vectors Market Revenue (Million) Forecast, by Application 2019 & 2032
- Table 76: Mexico Global Expression Vectors Market Volume (K Unit) Forecast, by Application 2019 & 2032
- Table 77: Global Expression Vectors Market Revenue Million Forecast, by Host Type 2019 & 2032
- Table 78: Global Expression Vectors Market Volume K Unit Forecast, by Host Type 2019 & 2032
- Table 79: Global Expression Vectors Market Revenue Million Forecast, by Application 2019 & 2032
- Table 80: Global Expression Vectors Market Volume K Unit Forecast, by Application 2019 & 2032
- Table 81: Global Expression Vectors Market Revenue Million Forecast, by End-User 2019 & 2032
- Table 82: Global Expression Vectors Market Volume K Unit Forecast, by End-User 2019 & 2032
- Table 83: Global Expression Vectors Market Revenue Million Forecast, by Country 2019 & 2032
- Table 84: Global Expression Vectors Market Volume K Unit Forecast, by Country 2019 & 2032
- Table 85: Germany Global Expression Vectors Market Revenue (Million) Forecast, by Application 2019 & 2032
- Table 86: Germany Global Expression Vectors Market Volume (K Unit) Forecast, by Application 2019 & 2032
- Table 87: United Kingdom Global Expression Vectors Market Revenue (Million) Forecast, by Application 2019 & 2032
- Table 88: United Kingdom Global Expression Vectors Market Volume (K Unit) Forecast, by Application 2019 & 2032
- Table 89: France Global Expression Vectors Market Revenue (Million) Forecast, by Application 2019 & 2032
- Table 90: France Global Expression Vectors Market Volume (K Unit) Forecast, by Application 2019 & 2032
- Table 91: Italy Global Expression Vectors Market Revenue (Million) Forecast, by Application 2019 & 2032
- Table 92: Italy Global Expression Vectors Market Volume (K Unit) Forecast, by Application 2019 & 2032
- Table 93: Spain Global Expression Vectors Market Revenue (Million) Forecast, by Application 2019 & 2032
- Table 94: Spain Global Expression Vectors Market Volume (K Unit) Forecast, by Application 2019 & 2032
- Table 95: Rest of Europe Global Expression Vectors Market Revenue (Million) Forecast, by Application 2019 & 2032
- Table 96: Rest of Europe Global Expression Vectors Market Volume (K Unit) Forecast, by Application 2019 & 2032
- Table 97: Global Expression Vectors Market Revenue Million Forecast, by Host Type 2019 & 2032
- Table 98: Global Expression Vectors Market Volume K Unit Forecast, by Host Type 2019 & 2032
- Table 99: Global Expression Vectors Market Revenue Million Forecast, by Application 2019 & 2032
- Table 100: Global Expression Vectors Market Volume K Unit Forecast, by Application 2019 & 2032
- Table 101: Global Expression Vectors Market Revenue Million Forecast, by End-User 2019 & 2032
- Table 102: Global Expression Vectors Market Volume K Unit Forecast, by End-User 2019 & 2032
- Table 103: Global Expression Vectors Market Revenue Million Forecast, by Country 2019 & 2032
- Table 104: Global Expression Vectors Market Volume K Unit Forecast, by Country 2019 & 2032
- Table 105: China Global Expression Vectors Market Revenue (Million) Forecast, by Application 2019 & 2032
- Table 106: China Global Expression Vectors Market Volume (K Unit) Forecast, by Application 2019 & 2032
- Table 107: Japan Global Expression Vectors Market Revenue (Million) Forecast, by Application 2019 & 2032
- Table 108: Japan Global Expression Vectors Market Volume (K Unit) Forecast, by Application 2019 & 2032
- Table 109: India Global Expression Vectors Market Revenue (Million) Forecast, by Application 2019 & 2032
- Table 110: India Global Expression Vectors Market Volume (K Unit) Forecast, by Application 2019 & 2032
- Table 111: Australia Global Expression Vectors Market Revenue (Million) Forecast, by Application 2019 & 2032
- Table 112: Australia Global Expression Vectors Market Volume (K Unit) Forecast, by Application 2019 & 2032
- Table 113: South Korea Global Expression Vectors Market Revenue (Million) Forecast, by Application 2019 & 2032
- Table 114: South Korea Global Expression Vectors Market Volume (K Unit) Forecast, by Application 2019 & 2032
- Table 115: Rest of Asia Pacific Global Expression Vectors Market Revenue (Million) Forecast, by Application 2019 & 2032
- Table 116: Rest of Asia Pacific Global Expression Vectors Market Volume (K Unit) Forecast, by Application 2019 & 2032
- Table 117: Global Expression Vectors Market Revenue Million Forecast, by Host Type 2019 & 2032
- Table 118: Global Expression Vectors Market Volume K Unit Forecast, by Host Type 2019 & 2032
- Table 119: Global Expression Vectors Market Revenue Million Forecast, by Application 2019 & 2032
- Table 120: Global Expression Vectors Market Volume K Unit Forecast, by Application 2019 & 2032
- Table 121: Global Expression Vectors Market Revenue Million Forecast, by End-User 2019 & 2032
- Table 122: Global Expression Vectors Market Volume K Unit Forecast, by End-User 2019 & 2032
- Table 123: Global Expression Vectors Market Revenue Million Forecast, by Country 2019 & 2032
- Table 124: Global Expression Vectors Market Volume K Unit Forecast, by Country 2019 & 2032
- Table 125: GCC Global Expression Vectors Market Revenue (Million) Forecast, by Application 2019 & 2032
- Table 126: GCC Global Expression Vectors Market Volume (K Unit) Forecast, by Application 2019 & 2032
- Table 127: South Africa Global Expression Vectors Market Revenue (Million) Forecast, by Application 2019 & 2032
- Table 128: South Africa Global Expression Vectors Market Volume (K Unit) Forecast, by Application 2019 & 2032
- Table 129: Rest of Middle East and Africa Global Expression Vectors Market Revenue (Million) Forecast, by Application 2019 & 2032
- Table 130: Rest of Middle East and Africa Global Expression Vectors Market Volume (K Unit) Forecast, by Application 2019 & 2032
- Table 131: Global Expression Vectors Market Revenue Million Forecast, by Host Type 2019 & 2032
- Table 132: Global Expression Vectors Market Volume K Unit Forecast, by Host Type 2019 & 2032
- Table 133: Global Expression Vectors Market Revenue Million Forecast, by Application 2019 & 2032
- Table 134: Global Expression Vectors Market Volume K Unit Forecast, by Application 2019 & 2032
- Table 135: Global Expression Vectors Market Revenue Million Forecast, by End-User 2019 & 2032
- Table 136: Global Expression Vectors Market Volume K Unit Forecast, by End-User 2019 & 2032
- Table 137: Global Expression Vectors Market Revenue Million Forecast, by Country 2019 & 2032
- Table 138: Global Expression Vectors Market Volume K Unit Forecast, by Country 2019 & 2032
- Table 139: Brazil Global Expression Vectors Market Revenue (Million) Forecast, by Application 2019 & 2032
- Table 140: Brazil Global Expression Vectors Market Volume (K Unit) Forecast, by Application 2019 & 2032
- Table 141: Argentina Global Expression Vectors Market Revenue (Million) Forecast, by Application 2019 & 2032
- Table 142: Argentina Global Expression Vectors Market Volume (K Unit) Forecast, by Application 2019 & 2032
- Table 143: Rest of South America Global Expression Vectors Market Revenue (Million) Forecast, by Application 2019 & 2032
- Table 144: Rest of South America Global Expression Vectors Market Volume (K Unit) Forecast, by Application 2019 & 2032
Frequently Asked Questions
1. What is the projected Compound Annual Growth Rate (CAGR) of the Global Expression Vectors Market?
The projected CAGR is approximately 5.60%.
2. Which companies are prominent players in the Global Expression Vectors Market?
Key companies in the market include TAKARA HOLDINGS Inc, Promega Corporation, Merck KGaA, 10 GenScript USA Inc, OriGene Technologies Inc , Thermo Fisher Scientific Inc, New England Biolabs, Sigma-Aldrich Corporation, System Biosciences LLC, DNA, Bio-Rad Laboratories, QIAGEN, Agilent Technologies.
3. What are the main segments of the Global Expression Vectors Market?
The market segments include Host Type, Application, End-User.
4. Can you provide details about the market size?
The market size is estimated to be USD XX Million as of 2022.
5. What are some drivers contributing to market growth?
Increase in Demand of Protein-Based Biologics; High Prevalence Rate of Lifestyle Diseases. Infectious Diseases and Genetic Disorders; Funding for Protein Research.
6. What are the notable trends driving market growth?
Bacterial expression vectors are Expected to Witness High Growth Over the Forecast Period.
7. Are there any restraints impacting market growth?
High Cost of Protein Therapy.
8. Can you provide examples of recent developments in the market?
In August 2022, Thermo Fisher Scientific launched viral vector manufacturing facility in Plainville, Massachusetts, expanding its capabilities in cell and gene therapy.
9. What pricing options are available for accessing the report?
Pricing options include single-user, multi-user, and enterprise licenses priced at USD 4750, USD 5250, and USD 8750 respectively.
10. Is the market size provided in terms of value or volume?
The market size is provided in terms of value, measured in Million and volume, measured in K Unit.
11. Are there any specific market keywords associated with the report?
Yes, the market keyword associated with the report is "Global Expression Vectors Market," which aids in identifying and referencing the specific market segment covered.
12. How do I determine which pricing option suits my needs best?
The pricing options vary based on user requirements and access needs. Individual users may opt for single-user licenses, while businesses requiring broader access may choose multi-user or enterprise licenses for cost-effective access to the report.
13. Are there any additional resources or data provided in the Global Expression Vectors Market report?
While the report offers comprehensive insights, it's advisable to review the specific contents or supplementary materials provided to ascertain if additional resources or data are available.
14. How can I stay updated on further developments or reports in the Global Expression Vectors Market?
To stay informed about further developments, trends, and reports in the Global Expression Vectors Market, consider subscribing to industry newsletters, following relevant companies and organizations, or regularly checking reputable industry news sources and publications.
Methodology
Step 1 - Identification of Relevant Samples Size from Population Database


Step 2 - Approaches for Defining Global Market Size (Value, Volume* & Price*)

Note*: In applicable scenarios
Step 3 - Data Sources
Primary Research
- Web Analytics
- Survey Reports
- Research Institute
- Latest Research Reports
- Opinion Leaders
Secondary Research
- Annual Reports
- White Paper
- Latest Press Release
- Industry Association
- Paid Database
- Investor Presentations

Step 4 - Data Triangulation
Involves using different sources of information in order to increase the validity of a study
These sources are likely to be stakeholders in a program - participants, other researchers, program staff, other community members, and so on.
Then we put all data in single framework & apply various statistical tools to find out the dynamic on the market.
During the analysis stage, feedback from the stakeholder groups would be compared to determine areas of agreement as well as areas of divergence


