
Key Insights
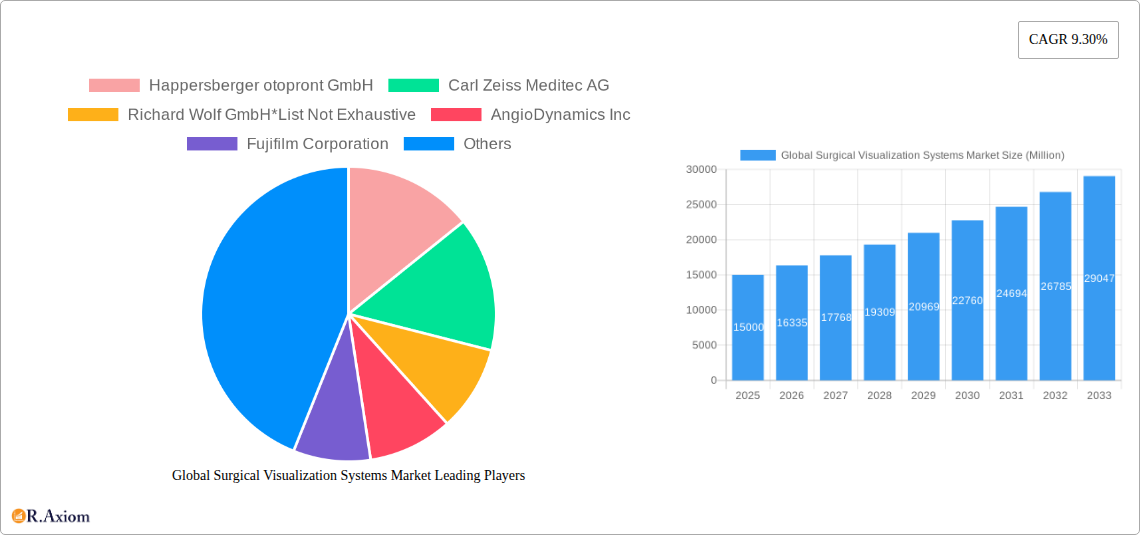
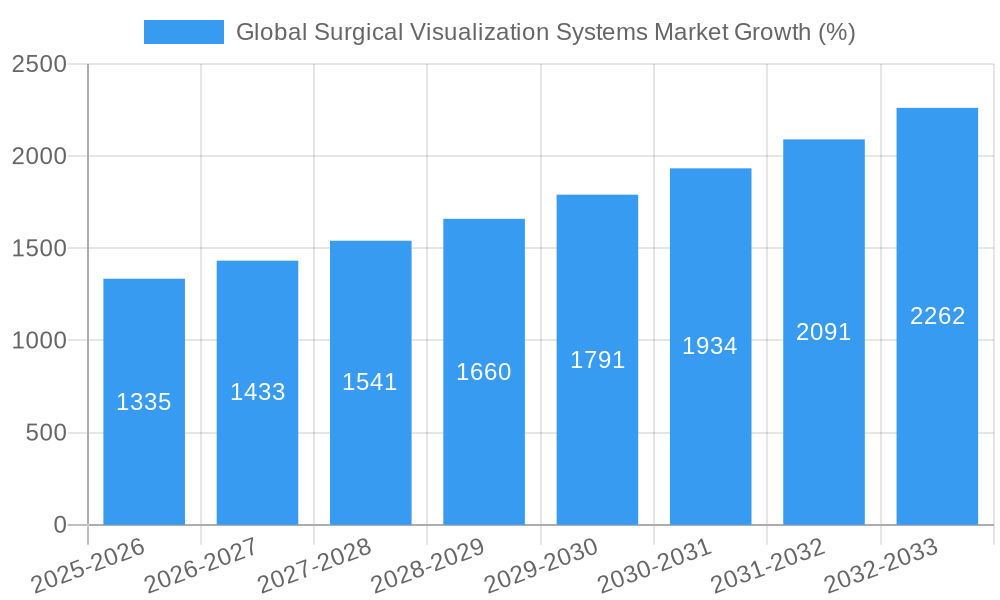
The global surgical visualization systems market is experiencing robust growth, driven by a confluence of factors. Technological advancements, such as the development of 4K and 3D imaging capabilities, are enhancing surgical precision and minimally invasive procedures. The increasing prevalence of chronic diseases requiring surgical intervention, coupled with a rising geriatric population, fuels demand for advanced visualization systems. Furthermore, the adoption of robotic-assisted surgery and image-guided procedures is boosting market expansion. The market is segmented by product (endoscopic cameras, light sources, displays, video recorders, accessories), application (gastroscopy, colonoscopy, laparoscopy, other applications), and end-users (hospitals, diagnostic imaging centers). North America currently holds a significant market share due to high healthcare expenditure and technological adoption. However, Asia Pacific is projected to witness the fastest growth rate owing to burgeoning healthcare infrastructure and increasing affordability of advanced medical technologies. While high initial investment costs and stringent regulatory requirements pose challenges, the long-term benefits of improved surgical outcomes and reduced recovery times are driving market penetration. Competition among established players like Olympus Corporation, Stryker Corporation, and Carl Zeiss Meditec AG is intense, with ongoing innovation and strategic partnerships shaping market dynamics. The forecast period (2025-2033) anticipates a sustained expansion, fueled by continuous technological improvements and increasing demand for advanced surgical capabilities. The market’s CAGR of 9.30% suggests significant growth potential throughout the forecast period.
The market segmentation highlights the diverse applications of surgical visualization systems across various surgical specialities. Endoscopic cameras, due to their versatility and minimally invasive nature, constitute a significant portion of the market. Hospitals and diagnostic imaging centers are the primary end-users, reflecting the crucial role these systems play in modern surgical practices. Regional variations in market growth reflect differences in healthcare infrastructure, economic development, and regulatory frameworks. The competitive landscape indicates a focus on product innovation, strategic acquisitions, and expanding global reach by major players. Future market growth is anticipated to be driven by increased investment in healthcare infrastructure, particularly in emerging markets, along with continued technological advancements that enhance image quality, resolution, and integration with other surgical technologies. This continued growth emphasizes the pivotal role of surgical visualization systems in improving surgical outcomes and patient care.
Global Surgical Visualization Systems Market: A Comprehensive Report (2019-2033)
This comprehensive report provides an in-depth analysis of the global surgical visualization systems market, offering invaluable insights for stakeholders across the medical device industry. Covering the period from 2019 to 2033, with 2025 as the base year, this report analyzes market trends, competitive dynamics, and future growth prospects. The market is segmented by product (Endoscopic Cameras, Light Sources, Displays and Monitors, Video Recorders, Accessories), application (Gastroscopy, Colonoscopy, Endoscopy, Other Applications), and end-users (Hospitals, Diagnostic Imaging Centers, Other End-Users). Key players such as Happersberger otopront GmbH, Carl Zeiss Meditec AG, Richard Wolf GmbH, AngioDynamics Inc, Fujifilm Corporation, Cardinal Health, Laborie Inc, Conmed Corporation, Stryker Corporation, Acutronic Medical Systems AG, Karl Storz GmbH & Co Kg, and Olympus Corporation are profiled. The report projects a xx Million market size in 2025, with a CAGR of xx% during the forecast period (2025-2033).
Global Surgical Visualization Systems Market Concentration & Innovation
The global surgical visualization systems market exhibits a moderately consolidated structure, with a few major players holding significant market share. The market share distribution, however, is dynamic due to continuous innovation and strategic mergers and acquisitions (M&A). Major players are focused on developing advanced imaging technologies, such as 4K and AI-powered systems, to enhance surgical precision and outcomes. Regulatory frameworks, particularly those related to medical device approvals (e.g., FDA 510(k) clearance), significantly influence market dynamics. The market also faces competitive pressure from substitutes, including alternative minimally invasive surgical techniques. End-user trends, such as the increasing adoption of minimally invasive surgeries and a preference for technologically advanced systems, are shaping market demand.
- Market Concentration: The top 5 players collectively hold approximately xx% of the market share in 2025.
- Innovation Drivers: Demand for higher-resolution imaging, AI-powered image analysis, and wireless capabilities are key drivers.
- M&A Activity: The past five years have witnessed xx M&A deals in the surgical visualization systems market, with a total deal value exceeding xx Million. These deals often involve smaller companies specializing in niche technologies being acquired by larger players.
- Regulatory Landscape: Stringent regulatory approvals and post-market surveillance create barriers to entry but also ensure product safety and efficacy.
Global Surgical Visualization Systems Market Industry Trends & Insights
The global surgical visualization systems market is experiencing robust growth, driven by several factors. The increasing prevalence of chronic diseases requiring surgical intervention, the rising adoption of minimally invasive surgical procedures, and technological advancements in imaging technologies contribute to this growth. The market has seen significant technological disruptions, including the introduction of 4K and 3D imaging, AI-assisted image analysis, and wireless endoscopy systems. These innovations are enhancing the clarity, precision, and convenience of surgical procedures. Consumer preferences are shifting towards systems that provide improved image quality, ease of use, and better integration with other surgical equipment. Competitive dynamics are intense, with companies constantly striving to develop innovative products and expand their market reach through strategic partnerships and acquisitions. The market penetration of advanced imaging technologies is gradually increasing.
- Market Growth Drivers: Rising prevalence of chronic diseases, increasing preference for minimally invasive surgery, technological advancements, and expanding healthcare infrastructure are major factors.
- Technological Disruptions: The integration of AI and machine learning into image analysis and the development of wireless endoscopy are reshaping the market.
- Consumer Preferences: Improved image quality, ease of use, and better integration with existing surgical workflows are highly valued.
- Competitive Dynamics: The market is highly competitive with players focused on product innovation, strategic partnerships, and M&A activities.
Dominant Markets & Segments in Global Surgical Visualization Systems Market
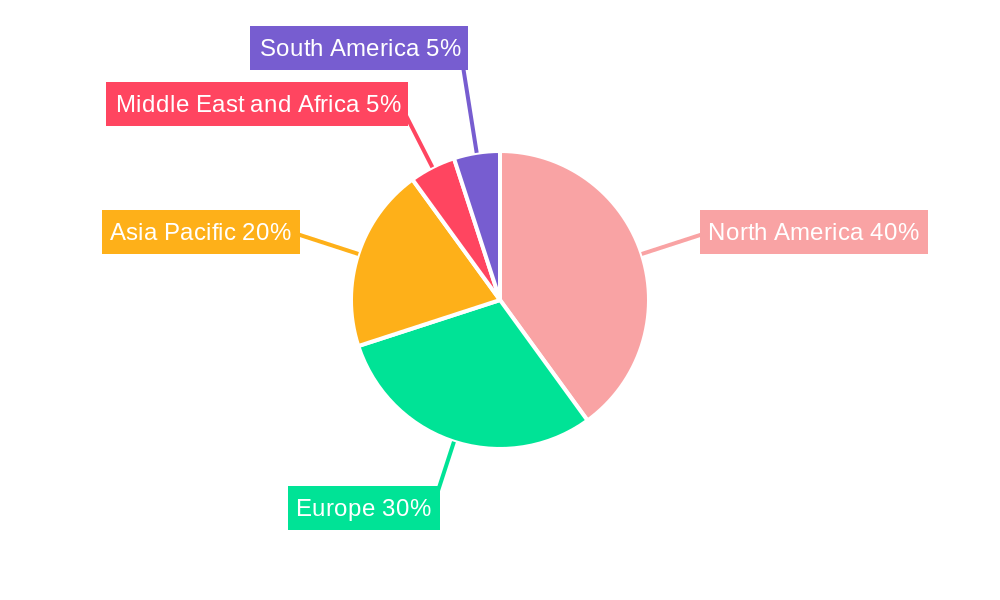
The North American region dominates the global surgical visualization systems market, driven by factors such as high healthcare expenditure, advanced medical infrastructure, and a higher adoption rate of minimally invasive surgeries. Within the segments, the Endoscopic Cameras segment holds the largest market share due to the widespread use of endoscopy in various surgical procedures. The Hospitals segment leads among end-users due to their high volume of surgical procedures.
Leading Region: North America, followed by Europe and Asia Pacific.
Dominant Segment (By Product): Endoscopic Cameras, driven by the high adoption of endoscopy procedures.
Dominant Segment (By Application): Colonoscopy and Gastroscopy segments lead due to high volume of these procedures.
Dominant Segment (By End-Users): Hospitals, driven by high volumes of surgical procedures and advanced infrastructure.
Key Drivers (North America): High healthcare expenditure, robust technological infrastructure, and the early adoption of new medical technologies.
Key Drivers (Europe): Government initiatives promoting advanced healthcare and substantial investment in medical technology.
Key Drivers (Asia Pacific): Rising disposable income, increasing healthcare expenditure, and improved healthcare infrastructure.
Global Surgical Visualization Systems Market Product Developments
Recent product innovations have focused on enhancing image quality, improving ergonomics, and integrating advanced features such as AI-powered image analysis. Wireless endoscopic cameras, offering improved maneuverability and reduced infection risk, are gaining popularity. These advancements are driving market growth by improving the efficiency, precision, and safety of surgical procedures. Companies are focusing on developing systems that are more user-friendly and better integrated with other surgical equipment.
Report Scope & Segmentation Analysis
This report segments the global surgical visualization systems market by product (Endoscopic Cameras, Light Sources, Displays and Monitors, Video Recorders, Accessories), application (Gastroscopy, Colonoscopy, Endoscopy, Other Applications), and end-user (Hospitals, Diagnostic Imaging Centers, Other End-Users). Each segment’s growth projections, market sizes, and competitive dynamics are analyzed. For example, the Endoscopic Cameras segment is expected to experience significant growth due to technological advancements and increasing preference for minimally invasive procedures. The Hospitals segment is expected to maintain its dominance due to the high volume of surgical procedures performed in hospitals.
Key Drivers of Global Surgical Visualization Systems Market Growth
The market's growth is primarily driven by technological advancements such as 4K and 3D imaging, the increasing prevalence of chronic diseases necessitating surgical intervention, rising adoption rates of minimally invasive surgeries, expanding healthcare infrastructure globally, and favorable regulatory environments supporting medical innovation. These factors combine to fuel demand for more sophisticated and effective surgical visualization systems.
Challenges in the Global Surgical Visualization Systems Market Sector
The market faces challenges including high initial investment costs for advanced systems, stringent regulatory requirements for medical device approvals, potential supply chain disruptions impacting component availability, and intense competition among established players and emerging entrants. These factors can impact market growth and profitability.
Emerging Opportunities in Global Surgical Visualization Systems Market
Emerging opportunities lie in developing countries with growing healthcare infrastructure, the integration of AI and machine learning for improved diagnostic capabilities and personalized medicine, the expanding use of robotic-assisted surgery, and the increasing adoption of single-use endoscopes to reduce infection risks. These trends present significant potential for market expansion.
Leading Players in the Global Surgical Visualization Systems Market Market
- Happersberger otopront GmbH
- Carl Zeiss Meditec AG (Carl Zeiss Meditec AG)
- Richard Wolf GmbH
- AngioDynamics Inc (AngioDynamics Inc)
- Fujifilm Corporation (Fujifilm Corporation)
- Cardinal Health (Cardinal Health)
- Laborie Inc
- Conmed Corporation (Conmed Corporation)
- Stryker Corporation (Stryker Corporation)
- Acutronic Medical Systems AG
- Karl Storz GmbH & Co Kg (Karl Storz GmbH & Co Kg)
- Olympus Corporation (Olympus Corporation)
Key Developments in Global Surgical Visualization Systems Market Industry
- February 2022: Ambu launched the 510(k) regulatory clearance of the Ambu aScope Gastro and Ambu aBox 2 in the United States. This launch signifies the entry of a new, advanced single-use gastroscope system into the market, influencing competition and potentially driving the adoption of single-use devices.
- March 2022: Endoluxe launched the high-definition, wireless endoscopic camera, TowerTech. This launch represents a significant advancement in wireless endoscopy technology, potentially influencing market preferences towards wireless solutions and enhancing overall surgical workflow efficiency.
Strategic Outlook for Global Surgical Visualization Systems Market Market
The future of the surgical visualization systems market looks promising, driven by continuous technological advancements, increasing demand for minimally invasive procedures, and the expansion of healthcare infrastructure in developing economies. Companies focusing on innovation, strategic partnerships, and effective market penetration strategies are well-positioned to capitalize on the substantial growth opportunities in this sector. The integration of AI and machine learning will play a pivotal role in shaping future product developments and market trends.
Global Surgical Visualization Systems Market Segmentation
-
1. Product
- 1.1. Endoscopic Cameras
- 1.2. Light Sources
- 1.3. Displays and Monitors
- 1.4. Video Recorders
- 1.5. Accessories
-
2. Application
- 2.1. Gastroscopy
- 2.2. Colonoscopy
- 2.3. Endoscopy
- 2.4. Other Applications
-
3. End-Users
- 3.1. Hospitals
- 3.2. Diagnostic Imaging Centers
- 3.3. Other End-Users
Global Surgical Visualization Systems Market Segmentation By Geography
-
1. North America
- 1.1. United States
- 1.2. Canada
- 1.3. Mexico
-
2. Europe
- 2.1. Germany
- 2.2. United Kingdom
- 2.3. France
- 2.4. Italy
- 2.5. Spain
- 2.6. Rest of Europe
-
3. Asia Pacific
- 3.1. China
- 3.2. Japan
- 3.3. India
- 3.4. Australia
- 3.5. South Korea
- 3.6. Rest of Asia Pacific
-
4. Middle East and Africa
- 4.1. GCC
- 4.2. South Africa
- 4.3. Rest of Middle East and Africa
-
5. South America
- 5.1. Brazil
- 5.2. Argentina
- 5.3. Rest of South America
Global Surgical Visualization Systems Market REPORT HIGHLIGHTS
| Aspects | Details |
|---|---|
| Study Period | 2019-2033 |
| Base Year | 2024 |
| Estimated Year | 2025 |
| Forecast Period | 2025-2033 |
| Historical Period | 2019-2024 |
| Growth Rate | CAGR of 9.30% from 2019-2033 |
| Segmentation |
|
Table of Contents
- 1. Introduction
- 1.1. Research Scope
- 1.2. Market Segmentation
- 1.3. Research Methodology
- 1.4. Definitions and Assumptions
- 2. Executive Summary
- 2.1. Introduction
- 3. Market Dynamics
- 3.1. Introduction
- 3.2. Market Drivers
- 3.2.1. Increasing Prevalence of Chronic Diseases; Technological Advancements in the Devices
- 3.3. Market Restrains
- 3.3.1. High Cost of Endoscopy Procedures
- 3.4. Market Trends
- 3.4.1. Colonoscopy Segment is Expected to Witness a Significant Growth Over the Forecast Period.
- 4. Market Factor Analysis
- 4.1. Porters Five Forces
- 4.2. Supply/Value Chain
- 4.3. PESTEL analysis
- 4.4. Market Entropy
- 4.5. Patent/Trademark Analysis
- 5. Global Surgical Visualization Systems Market Analysis, Insights and Forecast, 2019-2031
- 5.1. Market Analysis, Insights and Forecast - by Product
- 5.1.1. Endoscopic Cameras
- 5.1.2. Light Sources
- 5.1.3. Displays and Monitors
- 5.1.4. Video Recorders
- 5.1.5. Accessories
- 5.2. Market Analysis, Insights and Forecast - by Application
- 5.2.1. Gastroscopy
- 5.2.2. Colonoscopy
- 5.2.3. Endoscopy
- 5.2.4. Other Applications
- 5.3. Market Analysis, Insights and Forecast - by End-Users
- 5.3.1. Hospitals
- 5.3.2. Diagnostic Imaging Centers
- 5.3.3. Other End-Users
- 5.4. Market Analysis, Insights and Forecast - by Region
- 5.4.1. North America
- 5.4.2. Europe
- 5.4.3. Asia Pacific
- 5.4.4. Middle East and Africa
- 5.4.5. South America
- 5.1. Market Analysis, Insights and Forecast - by Product
- 6. North America Global Surgical Visualization Systems Market Analysis, Insights and Forecast, 2019-2031
- 6.1. Market Analysis, Insights and Forecast - by Product
- 6.1.1. Endoscopic Cameras
- 6.1.2. Light Sources
- 6.1.3. Displays and Monitors
- 6.1.4. Video Recorders
- 6.1.5. Accessories
- 6.2. Market Analysis, Insights and Forecast - by Application
- 6.2.1. Gastroscopy
- 6.2.2. Colonoscopy
- 6.2.3. Endoscopy
- 6.2.4. Other Applications
- 6.3. Market Analysis, Insights and Forecast - by End-Users
- 6.3.1. Hospitals
- 6.3.2. Diagnostic Imaging Centers
- 6.3.3. Other End-Users
- 6.1. Market Analysis, Insights and Forecast - by Product
- 7. Europe Global Surgical Visualization Systems Market Analysis, Insights and Forecast, 2019-2031
- 7.1. Market Analysis, Insights and Forecast - by Product
- 7.1.1. Endoscopic Cameras
- 7.1.2. Light Sources
- 7.1.3. Displays and Monitors
- 7.1.4. Video Recorders
- 7.1.5. Accessories
- 7.2. Market Analysis, Insights and Forecast - by Application
- 7.2.1. Gastroscopy
- 7.2.2. Colonoscopy
- 7.2.3. Endoscopy
- 7.2.4. Other Applications
- 7.3. Market Analysis, Insights and Forecast - by End-Users
- 7.3.1. Hospitals
- 7.3.2. Diagnostic Imaging Centers
- 7.3.3. Other End-Users
- 7.1. Market Analysis, Insights and Forecast - by Product
- 8. Asia Pacific Global Surgical Visualization Systems Market Analysis, Insights and Forecast, 2019-2031
- 8.1. Market Analysis, Insights and Forecast - by Product
- 8.1.1. Endoscopic Cameras
- 8.1.2. Light Sources
- 8.1.3. Displays and Monitors
- 8.1.4. Video Recorders
- 8.1.5. Accessories
- 8.2. Market Analysis, Insights and Forecast - by Application
- 8.2.1. Gastroscopy
- 8.2.2. Colonoscopy
- 8.2.3. Endoscopy
- 8.2.4. Other Applications
- 8.3. Market Analysis, Insights and Forecast - by End-Users
- 8.3.1. Hospitals
- 8.3.2. Diagnostic Imaging Centers
- 8.3.3. Other End-Users
- 8.1. Market Analysis, Insights and Forecast - by Product
- 9. Middle East and Africa Global Surgical Visualization Systems Market Analysis, Insights and Forecast, 2019-2031
- 9.1. Market Analysis, Insights and Forecast - by Product
- 9.1.1. Endoscopic Cameras
- 9.1.2. Light Sources
- 9.1.3. Displays and Monitors
- 9.1.4. Video Recorders
- 9.1.5. Accessories
- 9.2. Market Analysis, Insights and Forecast - by Application
- 9.2.1. Gastroscopy
- 9.2.2. Colonoscopy
- 9.2.3. Endoscopy
- 9.2.4. Other Applications
- 9.3. Market Analysis, Insights and Forecast - by End-Users
- 9.3.1. Hospitals
- 9.3.2. Diagnostic Imaging Centers
- 9.3.3. Other End-Users
- 9.1. Market Analysis, Insights and Forecast - by Product
- 10. South America Global Surgical Visualization Systems Market Analysis, Insights and Forecast, 2019-2031
- 10.1. Market Analysis, Insights and Forecast - by Product
- 10.1.1. Endoscopic Cameras
- 10.1.2. Light Sources
- 10.1.3. Displays and Monitors
- 10.1.4. Video Recorders
- 10.1.5. Accessories
- 10.2. Market Analysis, Insights and Forecast - by Application
- 10.2.1. Gastroscopy
- 10.2.2. Colonoscopy
- 10.2.3. Endoscopy
- 10.2.4. Other Applications
- 10.3. Market Analysis, Insights and Forecast - by End-Users
- 10.3.1. Hospitals
- 10.3.2. Diagnostic Imaging Centers
- 10.3.3. Other End-Users
- 10.1. Market Analysis, Insights and Forecast - by Product
- 11. North America Global Surgical Visualization Systems Market Analysis, Insights and Forecast, 2019-2031
- 11.1. Market Analysis, Insights and Forecast - By Country/Sub-region
- 11.1.1 United States
- 11.1.2 Canada
- 11.1.3 Mexico
- 12. Europe Global Surgical Visualization Systems Market Analysis, Insights and Forecast, 2019-2031
- 12.1. Market Analysis, Insights and Forecast - By Country/Sub-region
- 12.1.1 Germany
- 12.1.2 United Kingdom
- 12.1.3 France
- 12.1.4 Italy
- 12.1.5 Spain
- 12.1.6 Rest of Europe
- 13. Asia Pacific Global Surgical Visualization Systems Market Analysis, Insights and Forecast, 2019-2031
- 13.1. Market Analysis, Insights and Forecast - By Country/Sub-region
- 13.1.1 China
- 13.1.2 Japan
- 13.1.3 India
- 13.1.4 Australia
- 13.1.5 South Korea
- 13.1.6 Rest of Asia Pacific
- 14. Middle East and Africa Global Surgical Visualization Systems Market Analysis, Insights and Forecast, 2019-2031
- 14.1. Market Analysis, Insights and Forecast - By Country/Sub-region
- 14.1.1 GCC
- 14.1.2 South Africa
- 14.1.3 Rest of Middle East and Africa
- 15. South America Global Surgical Visualization Systems Market Analysis, Insights and Forecast, 2019-2031
- 15.1. Market Analysis, Insights and Forecast - By Country/Sub-region
- 15.1.1 Brazil
- 15.1.2 Argentina
- 15.1.3 Rest of South America
- 16. Competitive Analysis
- 16.1. Market Share Analysis 2024
- 16.2. Company Profiles
- 16.2.1 Happersberger otopront GmbH
- 16.2.1.1. Overview
- 16.2.1.2. Products
- 16.2.1.3. SWOT Analysis
- 16.2.1.4. Recent Developments
- 16.2.1.5. Financials (Based on Availability)
- 16.2.2 Carl Zeiss Meditec AG
- 16.2.2.1. Overview
- 16.2.2.2. Products
- 16.2.2.3. SWOT Analysis
- 16.2.2.4. Recent Developments
- 16.2.2.5. Financials (Based on Availability)
- 16.2.3 Richard Wolf GmbH*List Not Exhaustive
- 16.2.3.1. Overview
- 16.2.3.2. Products
- 16.2.3.3. SWOT Analysis
- 16.2.3.4. Recent Developments
- 16.2.3.5. Financials (Based on Availability)
- 16.2.4 AngioDynamics Inc
- 16.2.4.1. Overview
- 16.2.4.2. Products
- 16.2.4.3. SWOT Analysis
- 16.2.4.4. Recent Developments
- 16.2.4.5. Financials (Based on Availability)
- 16.2.5 Fujifilm Corporation
- 16.2.5.1. Overview
- 16.2.5.2. Products
- 16.2.5.3. SWOT Analysis
- 16.2.5.4. Recent Developments
- 16.2.5.5. Financials (Based on Availability)
- 16.2.6 Cardinal Health
- 16.2.6.1. Overview
- 16.2.6.2. Products
- 16.2.6.3. SWOT Analysis
- 16.2.6.4. Recent Developments
- 16.2.6.5. Financials (Based on Availability)
- 16.2.7 Laborie Inc
- 16.2.7.1. Overview
- 16.2.7.2. Products
- 16.2.7.3. SWOT Analysis
- 16.2.7.4. Recent Developments
- 16.2.7.5. Financials (Based on Availability)
- 16.2.8 Conmed Corporation
- 16.2.8.1. Overview
- 16.2.8.2. Products
- 16.2.8.3. SWOT Analysis
- 16.2.8.4. Recent Developments
- 16.2.8.5. Financials (Based on Availability)
- 16.2.9 Stryker Corporation
- 16.2.9.1. Overview
- 16.2.9.2. Products
- 16.2.9.3. SWOT Analysis
- 16.2.9.4. Recent Developments
- 16.2.9.5. Financials (Based on Availability)
- 16.2.10 Acutronic Medical Systems AG
- 16.2.10.1. Overview
- 16.2.10.2. Products
- 16.2.10.3. SWOT Analysis
- 16.2.10.4. Recent Developments
- 16.2.10.5. Financials (Based on Availability)
- 16.2.11 Karl Storz GmbH & Co Kg
- 16.2.11.1. Overview
- 16.2.11.2. Products
- 16.2.11.3. SWOT Analysis
- 16.2.11.4. Recent Developments
- 16.2.11.5. Financials (Based on Availability)
- 16.2.12 Olympus Corporation
- 16.2.12.1. Overview
- 16.2.12.2. Products
- 16.2.12.3. SWOT Analysis
- 16.2.12.4. Recent Developments
- 16.2.12.5. Financials (Based on Availability)
- 16.2.1 Happersberger otopront GmbH
List of Figures
- Figure 1: Global Global Surgical Visualization Systems Market Revenue Breakdown (Million, %) by Region 2024 & 2032
- Figure 2: North America Global Surgical Visualization Systems Market Revenue (Million), by Country 2024 & 2032
- Figure 3: North America Global Surgical Visualization Systems Market Revenue Share (%), by Country 2024 & 2032
- Figure 4: Europe Global Surgical Visualization Systems Market Revenue (Million), by Country 2024 & 2032
- Figure 5: Europe Global Surgical Visualization Systems Market Revenue Share (%), by Country 2024 & 2032
- Figure 6: Asia Pacific Global Surgical Visualization Systems Market Revenue (Million), by Country 2024 & 2032
- Figure 7: Asia Pacific Global Surgical Visualization Systems Market Revenue Share (%), by Country 2024 & 2032
- Figure 8: Middle East and Africa Global Surgical Visualization Systems Market Revenue (Million), by Country 2024 & 2032
- Figure 9: Middle East and Africa Global Surgical Visualization Systems Market Revenue Share (%), by Country 2024 & 2032
- Figure 10: South America Global Surgical Visualization Systems Market Revenue (Million), by Country 2024 & 2032
- Figure 11: South America Global Surgical Visualization Systems Market Revenue Share (%), by Country 2024 & 2032
- Figure 12: North America Global Surgical Visualization Systems Market Revenue (Million), by Product 2024 & 2032
- Figure 13: North America Global Surgical Visualization Systems Market Revenue Share (%), by Product 2024 & 2032
- Figure 14: North America Global Surgical Visualization Systems Market Revenue (Million), by Application 2024 & 2032
- Figure 15: North America Global Surgical Visualization Systems Market Revenue Share (%), by Application 2024 & 2032
- Figure 16: North America Global Surgical Visualization Systems Market Revenue (Million), by End-Users 2024 & 2032
- Figure 17: North America Global Surgical Visualization Systems Market Revenue Share (%), by End-Users 2024 & 2032
- Figure 18: North America Global Surgical Visualization Systems Market Revenue (Million), by Country 2024 & 2032
- Figure 19: North America Global Surgical Visualization Systems Market Revenue Share (%), by Country 2024 & 2032
- Figure 20: Europe Global Surgical Visualization Systems Market Revenue (Million), by Product 2024 & 2032
- Figure 21: Europe Global Surgical Visualization Systems Market Revenue Share (%), by Product 2024 & 2032
- Figure 22: Europe Global Surgical Visualization Systems Market Revenue (Million), by Application 2024 & 2032
- Figure 23: Europe Global Surgical Visualization Systems Market Revenue Share (%), by Application 2024 & 2032
- Figure 24: Europe Global Surgical Visualization Systems Market Revenue (Million), by End-Users 2024 & 2032
- Figure 25: Europe Global Surgical Visualization Systems Market Revenue Share (%), by End-Users 2024 & 2032
- Figure 26: Europe Global Surgical Visualization Systems Market Revenue (Million), by Country 2024 & 2032
- Figure 27: Europe Global Surgical Visualization Systems Market Revenue Share (%), by Country 2024 & 2032
- Figure 28: Asia Pacific Global Surgical Visualization Systems Market Revenue (Million), by Product 2024 & 2032
- Figure 29: Asia Pacific Global Surgical Visualization Systems Market Revenue Share (%), by Product 2024 & 2032
- Figure 30: Asia Pacific Global Surgical Visualization Systems Market Revenue (Million), by Application 2024 & 2032
- Figure 31: Asia Pacific Global Surgical Visualization Systems Market Revenue Share (%), by Application 2024 & 2032
- Figure 32: Asia Pacific Global Surgical Visualization Systems Market Revenue (Million), by End-Users 2024 & 2032
- Figure 33: Asia Pacific Global Surgical Visualization Systems Market Revenue Share (%), by End-Users 2024 & 2032
- Figure 34: Asia Pacific Global Surgical Visualization Systems Market Revenue (Million), by Country 2024 & 2032
- Figure 35: Asia Pacific Global Surgical Visualization Systems Market Revenue Share (%), by Country 2024 & 2032
- Figure 36: Middle East and Africa Global Surgical Visualization Systems Market Revenue (Million), by Product 2024 & 2032
- Figure 37: Middle East and Africa Global Surgical Visualization Systems Market Revenue Share (%), by Product 2024 & 2032
- Figure 38: Middle East and Africa Global Surgical Visualization Systems Market Revenue (Million), by Application 2024 & 2032
- Figure 39: Middle East and Africa Global Surgical Visualization Systems Market Revenue Share (%), by Application 2024 & 2032
- Figure 40: Middle East and Africa Global Surgical Visualization Systems Market Revenue (Million), by End-Users 2024 & 2032
- Figure 41: Middle East and Africa Global Surgical Visualization Systems Market Revenue Share (%), by End-Users 2024 & 2032
- Figure 42: Middle East and Africa Global Surgical Visualization Systems Market Revenue (Million), by Country 2024 & 2032
- Figure 43: Middle East and Africa Global Surgical Visualization Systems Market Revenue Share (%), by Country 2024 & 2032
- Figure 44: South America Global Surgical Visualization Systems Market Revenue (Million), by Product 2024 & 2032
- Figure 45: South America Global Surgical Visualization Systems Market Revenue Share (%), by Product 2024 & 2032
- Figure 46: South America Global Surgical Visualization Systems Market Revenue (Million), by Application 2024 & 2032
- Figure 47: South America Global Surgical Visualization Systems Market Revenue Share (%), by Application 2024 & 2032
- Figure 48: South America Global Surgical Visualization Systems Market Revenue (Million), by End-Users 2024 & 2032
- Figure 49: South America Global Surgical Visualization Systems Market Revenue Share (%), by End-Users 2024 & 2032
- Figure 50: South America Global Surgical Visualization Systems Market Revenue (Million), by Country 2024 & 2032
- Figure 51: South America Global Surgical Visualization Systems Market Revenue Share (%), by Country 2024 & 2032
List of Tables
- Table 1: Global Surgical Visualization Systems Market Revenue Million Forecast, by Region 2019 & 2032
- Table 2: Global Surgical Visualization Systems Market Revenue Million Forecast, by Product 2019 & 2032
- Table 3: Global Surgical Visualization Systems Market Revenue Million Forecast, by Application 2019 & 2032
- Table 4: Global Surgical Visualization Systems Market Revenue Million Forecast, by End-Users 2019 & 2032
- Table 5: Global Surgical Visualization Systems Market Revenue Million Forecast, by Region 2019 & 2032
- Table 6: Global Surgical Visualization Systems Market Revenue Million Forecast, by Country 2019 & 2032
- Table 7: United States Global Surgical Visualization Systems Market Revenue (Million) Forecast, by Application 2019 & 2032
- Table 8: Canada Global Surgical Visualization Systems Market Revenue (Million) Forecast, by Application 2019 & 2032
- Table 9: Mexico Global Surgical Visualization Systems Market Revenue (Million) Forecast, by Application 2019 & 2032
- Table 10: Global Surgical Visualization Systems Market Revenue Million Forecast, by Country 2019 & 2032
- Table 11: Germany Global Surgical Visualization Systems Market Revenue (Million) Forecast, by Application 2019 & 2032
- Table 12: United Kingdom Global Surgical Visualization Systems Market Revenue (Million) Forecast, by Application 2019 & 2032
- Table 13: France Global Surgical Visualization Systems Market Revenue (Million) Forecast, by Application 2019 & 2032
- Table 14: Italy Global Surgical Visualization Systems Market Revenue (Million) Forecast, by Application 2019 & 2032
- Table 15: Spain Global Surgical Visualization Systems Market Revenue (Million) Forecast, by Application 2019 & 2032
- Table 16: Rest of Europe Global Surgical Visualization Systems Market Revenue (Million) Forecast, by Application 2019 & 2032
- Table 17: Global Surgical Visualization Systems Market Revenue Million Forecast, by Country 2019 & 2032
- Table 18: China Global Surgical Visualization Systems Market Revenue (Million) Forecast, by Application 2019 & 2032
- Table 19: Japan Global Surgical Visualization Systems Market Revenue (Million) Forecast, by Application 2019 & 2032
- Table 20: India Global Surgical Visualization Systems Market Revenue (Million) Forecast, by Application 2019 & 2032
- Table 21: Australia Global Surgical Visualization Systems Market Revenue (Million) Forecast, by Application 2019 & 2032
- Table 22: South Korea Global Surgical Visualization Systems Market Revenue (Million) Forecast, by Application 2019 & 2032
- Table 23: Rest of Asia Pacific Global Surgical Visualization Systems Market Revenue (Million) Forecast, by Application 2019 & 2032
- Table 24: Global Surgical Visualization Systems Market Revenue Million Forecast, by Country 2019 & 2032
- Table 25: GCC Global Surgical Visualization Systems Market Revenue (Million) Forecast, by Application 2019 & 2032
- Table 26: South Africa Global Surgical Visualization Systems Market Revenue (Million) Forecast, by Application 2019 & 2032
- Table 27: Rest of Middle East and Africa Global Surgical Visualization Systems Market Revenue (Million) Forecast, by Application 2019 & 2032
- Table 28: Global Surgical Visualization Systems Market Revenue Million Forecast, by Country 2019 & 2032
- Table 29: Brazil Global Surgical Visualization Systems Market Revenue (Million) Forecast, by Application 2019 & 2032
- Table 30: Argentina Global Surgical Visualization Systems Market Revenue (Million) Forecast, by Application 2019 & 2032
- Table 31: Rest of South America Global Surgical Visualization Systems Market Revenue (Million) Forecast, by Application 2019 & 2032
- Table 32: Global Surgical Visualization Systems Market Revenue Million Forecast, by Product 2019 & 2032
- Table 33: Global Surgical Visualization Systems Market Revenue Million Forecast, by Application 2019 & 2032
- Table 34: Global Surgical Visualization Systems Market Revenue Million Forecast, by End-Users 2019 & 2032
- Table 35: Global Surgical Visualization Systems Market Revenue Million Forecast, by Country 2019 & 2032
- Table 36: United States Global Surgical Visualization Systems Market Revenue (Million) Forecast, by Application 2019 & 2032
- Table 37: Canada Global Surgical Visualization Systems Market Revenue (Million) Forecast, by Application 2019 & 2032
- Table 38: Mexico Global Surgical Visualization Systems Market Revenue (Million) Forecast, by Application 2019 & 2032
- Table 39: Global Surgical Visualization Systems Market Revenue Million Forecast, by Product 2019 & 2032
- Table 40: Global Surgical Visualization Systems Market Revenue Million Forecast, by Application 2019 & 2032
- Table 41: Global Surgical Visualization Systems Market Revenue Million Forecast, by End-Users 2019 & 2032
- Table 42: Global Surgical Visualization Systems Market Revenue Million Forecast, by Country 2019 & 2032
- Table 43: Germany Global Surgical Visualization Systems Market Revenue (Million) Forecast, by Application 2019 & 2032
- Table 44: United Kingdom Global Surgical Visualization Systems Market Revenue (Million) Forecast, by Application 2019 & 2032
- Table 45: France Global Surgical Visualization Systems Market Revenue (Million) Forecast, by Application 2019 & 2032
- Table 46: Italy Global Surgical Visualization Systems Market Revenue (Million) Forecast, by Application 2019 & 2032
- Table 47: Spain Global Surgical Visualization Systems Market Revenue (Million) Forecast, by Application 2019 & 2032
- Table 48: Rest of Europe Global Surgical Visualization Systems Market Revenue (Million) Forecast, by Application 2019 & 2032
- Table 49: Global Surgical Visualization Systems Market Revenue Million Forecast, by Product 2019 & 2032
- Table 50: Global Surgical Visualization Systems Market Revenue Million Forecast, by Application 2019 & 2032
- Table 51: Global Surgical Visualization Systems Market Revenue Million Forecast, by End-Users 2019 & 2032
- Table 52: Global Surgical Visualization Systems Market Revenue Million Forecast, by Country 2019 & 2032
- Table 53: China Global Surgical Visualization Systems Market Revenue (Million) Forecast, by Application 2019 & 2032
- Table 54: Japan Global Surgical Visualization Systems Market Revenue (Million) Forecast, by Application 2019 & 2032
- Table 55: India Global Surgical Visualization Systems Market Revenue (Million) Forecast, by Application 2019 & 2032
- Table 56: Australia Global Surgical Visualization Systems Market Revenue (Million) Forecast, by Application 2019 & 2032
- Table 57: South Korea Global Surgical Visualization Systems Market Revenue (Million) Forecast, by Application 2019 & 2032
- Table 58: Rest of Asia Pacific Global Surgical Visualization Systems Market Revenue (Million) Forecast, by Application 2019 & 2032
- Table 59: Global Surgical Visualization Systems Market Revenue Million Forecast, by Product 2019 & 2032
- Table 60: Global Surgical Visualization Systems Market Revenue Million Forecast, by Application 2019 & 2032
- Table 61: Global Surgical Visualization Systems Market Revenue Million Forecast, by End-Users 2019 & 2032
- Table 62: Global Surgical Visualization Systems Market Revenue Million Forecast, by Country 2019 & 2032
- Table 63: GCC Global Surgical Visualization Systems Market Revenue (Million) Forecast, by Application 2019 & 2032
- Table 64: South Africa Global Surgical Visualization Systems Market Revenue (Million) Forecast, by Application 2019 & 2032
- Table 65: Rest of Middle East and Africa Global Surgical Visualization Systems Market Revenue (Million) Forecast, by Application 2019 & 2032
- Table 66: Global Surgical Visualization Systems Market Revenue Million Forecast, by Product 2019 & 2032
- Table 67: Global Surgical Visualization Systems Market Revenue Million Forecast, by Application 2019 & 2032
- Table 68: Global Surgical Visualization Systems Market Revenue Million Forecast, by End-Users 2019 & 2032
- Table 69: Global Surgical Visualization Systems Market Revenue Million Forecast, by Country 2019 & 2032
- Table 70: Brazil Global Surgical Visualization Systems Market Revenue (Million) Forecast, by Application 2019 & 2032
- Table 71: Argentina Global Surgical Visualization Systems Market Revenue (Million) Forecast, by Application 2019 & 2032
- Table 72: Rest of South America Global Surgical Visualization Systems Market Revenue (Million) Forecast, by Application 2019 & 2032
Frequently Asked Questions
1. What is the projected Compound Annual Growth Rate (CAGR) of the Global Surgical Visualization Systems Market?
The projected CAGR is approximately 9.30%.
2. Which companies are prominent players in the Global Surgical Visualization Systems Market?
Key companies in the market include Happersberger otopront GmbH, Carl Zeiss Meditec AG, Richard Wolf GmbH*List Not Exhaustive, AngioDynamics Inc, Fujifilm Corporation, Cardinal Health, Laborie Inc, Conmed Corporation, Stryker Corporation, Acutronic Medical Systems AG, Karl Storz GmbH & Co Kg, Olympus Corporation.
3. What are the main segments of the Global Surgical Visualization Systems Market?
The market segments include Product, Application, End-Users.
4. Can you provide details about the market size?
The market size is estimated to be USD XX Million as of 2022.
5. What are some drivers contributing to market growth?
Increasing Prevalence of Chronic Diseases; Technological Advancements in the Devices.
6. What are the notable trends driving market growth?
Colonoscopy Segment is Expected to Witness a Significant Growth Over the Forecast Period..
7. Are there any restraints impacting market growth?
High Cost of Endoscopy Procedures.
8. Can you provide examples of recent developments in the market?
March 2022: Endoluxe launches the high-definition, wireless endoscopic camera, TowerTech. TowerTech provides the complete functionality of legacy endoscopy video platforms, all built into the camera head.
9. What pricing options are available for accessing the report?
Pricing options include single-user, multi-user, and enterprise licenses priced at USD 4750, USD 5250, and USD 8750 respectively.
10. Is the market size provided in terms of value or volume?
The market size is provided in terms of value, measured in Million.
11. Are there any specific market keywords associated with the report?
Yes, the market keyword associated with the report is "Global Surgical Visualization Systems Market," which aids in identifying and referencing the specific market segment covered.
12. How do I determine which pricing option suits my needs best?
The pricing options vary based on user requirements and access needs. Individual users may opt for single-user licenses, while businesses requiring broader access may choose multi-user or enterprise licenses for cost-effective access to the report.
13. Are there any additional resources or data provided in the Global Surgical Visualization Systems Market report?
While the report offers comprehensive insights, it's advisable to review the specific contents or supplementary materials provided to ascertain if additional resources or data are available.
14. How can I stay updated on further developments or reports in the Global Surgical Visualization Systems Market?
To stay informed about further developments, trends, and reports in the Global Surgical Visualization Systems Market, consider subscribing to industry newsletters, following relevant companies and organizations, or regularly checking reputable industry news sources and publications.
Methodology
Step 1 - Identification of Relevant Samples Size from Population Database


Step 2 - Approaches for Defining Global Market Size (Value, Volume* & Price*)

Note*: In applicable scenarios
Step 3 - Data Sources
Primary Research
- Web Analytics
- Survey Reports
- Research Institute
- Latest Research Reports
- Opinion Leaders
Secondary Research
- Annual Reports
- White Paper
- Latest Press Release
- Industry Association
- Paid Database
- Investor Presentations

Step 4 - Data Triangulation
Involves using different sources of information in order to increase the validity of a study
These sources are likely to be stakeholders in a program - participants, other researchers, program staff, other community members, and so on.
Then we put all data in single framework & apply various statistical tools to find out the dynamic on the market.
During the analysis stage, feedback from the stakeholder groups would be compared to determine areas of agreement as well as areas of divergence


