
Key Insights
The global hearable electronic devices market, encompassing headsets, earbuds, and hearing aids, is experiencing robust growth, projected to reach a substantial market size with a Compound Annual Growth Rate (CAGR) of 11.70% from 2025 to 2033. This expansion is driven by several key factors. Firstly, the increasing adoption of wireless technology and the proliferation of smartphones are fueling demand for convenient and high-quality audio solutions. Secondly, advancements in noise-cancellation technology and improved sound quality are enhancing the user experience, attracting a wider consumer base. Thirdly, the rising prevalence of hearing loss, particularly among aging populations globally, is significantly boosting the demand for hearing aids. The market is segmented by product type (headsets, earbuds, hearing aids) and by device form factor (in-ear, on-ear, over-ear). While earbuds currently dominate market share due to their portability and affordability, the on-ear and over-ear segments are expected to witness growth driven by increasing preference for superior audio quality and noise isolation. The competitive landscape is characterized by established players like Bose, Apple (including Beats), and Samsung alongside emerging technology companies, creating a dynamic environment fostering innovation and technological advancements. Regional growth varies, with North America and Asia-Pacific expected to lead the market, driven by high consumer spending and rising adoption rates.
The market's growth trajectory, however, is not without challenges. Price sensitivity in developing markets and concerns regarding the potential long-term health effects of prolonged headphone use pose notable restraints. Furthermore, the market is susceptible to rapid technological advancements and evolving consumer preferences, necessitating continuous innovation and adaptation from market participants. Strategic partnerships, technological breakthroughs, and targeted marketing campaigns will be crucial for companies to succeed in this competitive and dynamic market. The integration of smart features and health monitoring capabilities within hearable devices is expected to further drive growth in the coming years. Companies are investing heavily in research and development to enhance the functionality and user experience of hearable devices, which in turn is contributing to the sustained expansion of the global market.

Hearable Electronic Devices Industry: Market Analysis and Forecast 2019-2033
This comprehensive report provides a detailed analysis of the Hearable Electronic Devices industry, covering market size, growth drivers, competitive landscape, and future outlook from 2019 to 2033. The report incorporates key industry developments, insightful segmentation, and profiles of leading players including Bose Corporation, Apple Inc. (including Beats Electronics), and others. This in-depth study is essential for industry stakeholders, investors, and businesses seeking to navigate this dynamic and rapidly evolving market.
Hearable Electronic Devices Industry Market Concentration & Innovation
This section analyzes the market concentration, innovation drivers, regulatory frameworks, product substitutes, end-user trends, and M&A activities within the Hearable Electronic Devices industry. The market is characterized by a mix of established players and emerging competitors, resulting in a moderately concentrated landscape. Market share data for 2024 reveals that the top five players account for approximately xx% of the global market. Innovation is a key driver, with continuous advancements in areas such as noise cancellation, sound quality, and health monitoring features.
- Regulatory Frameworks: Regulations concerning health and safety standards for hearing aids and other wearable devices influence product development and market entry.
- Product Substitutes: Competition comes from other personal audio devices such as traditional headphones and speakers.
- End-User Trends: Growing consumer preference for wireless connectivity, personalized audio experiences, and health-focused features significantly impacts market growth.
- M&A Activities: Significant mergers and acquisitions have shaped the industry landscape in recent years, with deal values totaling xx Million in 2024 alone. These activities primarily aimed to expand product portfolios, enhance technological capabilities, and increase market reach. Examples include [Insert specific M&A examples, if available, with deal values].
Hearable Electronic Devices Industry Industry Trends & Insights
The Hearable Electronic Devices market exhibits robust growth, driven by several key factors. The Compound Annual Growth Rate (CAGR) is projected to be xx% during the forecast period (2025-2033), with market penetration increasing from xx% in 2024 to xx% in 2033. Key growth drivers include:
- Technological Advancements: Advancements in noise-cancellation technology, Bluetooth connectivity, and integration with smartphones fuel demand.
- Rising Disposable Incomes: Increasing disposable incomes in developing economies contribute to higher consumer spending on premium audio devices.
- Growing Adoption of Wireless Technology: The shift towards wireless audio devices is significantly propelling market expansion.
- Increased Awareness of Hearing Health: Growing awareness about the importance of hearing health fuels demand for hearing aids.
- Integration of Smart Features: The incorporation of health-monitoring features and fitness tracking capabilities in earbuds and hearing aids expands the market appeal.
- Competitive Dynamics: Intense competition among established and emerging players spurs product innovation and pricing strategies, benefiting consumers.

Dominant Markets & Segments in Hearable Electronic Devices Industry
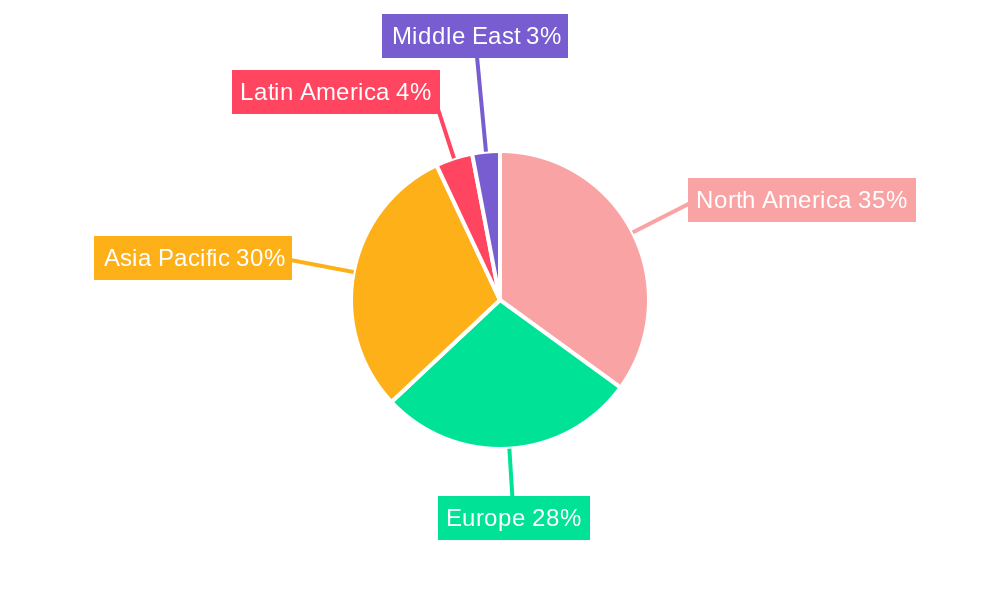
The North American region is currently the leading market for Hearable Electronic Devices, driven by factors such as high consumer spending power, advanced technological infrastructure, and strong adoption of wireless technologies.
- Key Drivers for North American Dominance:
- High per capita income and spending on consumer electronics.
- Strong technological infrastructure and early adoption of new technologies.
- Extensive distribution networks and strong retail presence.
- Favorable regulatory environment supporting technological innovation.
The In-Ear segment, particularly earbuds, holds the largest market share due to its portability, affordability, and wide range of functionalities. Within the product category, the Earbuds segment is projected to dominate the market due to increasing consumer preference for wireless, compact, and feature-rich audio devices. Further granular details will be provided in the full report.
Hearable Electronic Devices Industry Product Developments
The hearable electronic devices market witnesses continuous product innovation, with key advancements focused on improved sound quality, enhanced noise cancellation, advanced connectivity, longer battery life, and integration of health and fitness tracking capabilities. This evolution caters to diverse consumer preferences, creating niche segments and driving market expansion. Miniaturization and improved ergonomics are also key considerations influencing product designs and competitive advantages.
Report Scope & Segmentation Analysis
The report segments the Hearable Electronic Devices market by Type (In-Ear, On-Ear, Over-Ear) and Product (Headsets, Earbuds, Hearing Aids). Each segment is analyzed in terms of its market size, growth projections, and competitive dynamics. For example, the In-Ear segment is expected to witness the highest growth due to the rising popularity of earbuds. The Hearing Aids segment is anticipated to show substantial growth due to an increasing aging population and growing awareness of hearing health. Detailed projections for market size and growth are provided for each segment within the full report.
Key Drivers of Hearable Electronic Devices Industry Growth
Several factors contribute to the hearable electronic devices market's growth. Technological advancements, particularly in noise cancellation, Bluetooth technology, and integration with smartphones, are crucial. Increasing disposable incomes, especially in developing economies, contribute to higher consumer spending. Lastly, the rising popularity of wireless audio devices and the growing awareness of hearing health play significant roles in market expansion.
Challenges in the Hearable Electronic Devices Industry Sector
Despite the positive growth trajectory, the industry faces several challenges. Maintaining the quality and reliability of wireless connections is crucial, and overcoming technological hurdles in miniaturizing components is also paramount. The competitive landscape is another key challenge, with companies constantly striving to differentiate their products and maintain market share through price competition, aggressive marketing strategies, and new product launches.
Emerging Opportunities in Hearable Electronic Devices Industry
Emerging opportunities arise from the integration of health monitoring capabilities within hearable devices. This expands the market beyond pure audio functionality and opens avenues in the healthcare sector. Furthermore, the adoption of personalized audio experiences and advancements in materials science offer further prospects for growth. The expansion into developing markets with rising disposable incomes and increasing demand for consumer electronics presents substantial opportunities for market players.
Leading Players in the Hearable Electronic Devices Industry Market
- Bose Corporation
- Apple Inc (Incl Beats Electronics)
- ReSound (GN Group)
- Xiaomi Corporation
- Skullcandy Inc
- Samsung Electronics Co Ltd (Harman International Industries Inc (Incl JBL)
- Sennheiser Electronic GMBH & Co
- Starkey Hearing Technologies
- Demant A/S
- WS Audiology A/S
- Sony Corporation
Key Developments in Hearable Electronic Devices Industry Industry
- October 2022: WS Audiology A/S launched the HearUSA brand, uniting resources to expand access to hearing care. This signifies a strategic shift towards broader market reach and improved customer experience.
- November 2022: Starkey partnered with Special Olympics International, extending hearing health services to athletes globally. This highlights corporate social responsibility and market expansion into underserved communities.
Strategic Outlook for Hearable Electronic Devices Industry Market
The Hearable Electronic Devices market is poised for continued robust growth, driven by technological advancements, expanding consumer base, and increasing awareness of hearing health. Opportunities lie in the integration of health-monitoring features, personalized audio solutions, and expansion into new markets. The strategic focus will be on product differentiation, enhanced user experiences, and effective marketing strategies to navigate the competitive landscape and capitalize on emerging opportunities.
Hearable Electronic Devices Industry Segmentation
-
1. Type
- 1.1. In-Ear
- 1.2. On-Ear
- 1.3. Over-Ear
-
2. Product
- 2.1. Headsets
- 2.2. Earbuds
- 2.3. Hearing Aids
Hearable Electronic Devices Industry Segmentation By Geography
-
1. North America
- 1.1. United States
- 1.2. Canada
-
2. Europe
- 2.1. United Kingdom
- 2.2. Germany
- 2.3. France
- 2.4. Rest of Europe
-
3. Asia Pacific
- 3.1. China
- 3.2. Japan
- 3.3. India
- 3.4. South Korea
- 3.5. Rest of Asia Pacific
- 4. Latin America
- 5. Middle East
Hearable Electronic Devices Industry REPORT HIGHLIGHTS
| Aspects | Details |
|---|---|
| Study Period | 2019-2033 |
| Base Year | 2024 |
| Estimated Year | 2025 |
| Forecast Period | 2025-2033 |
| Historical Period | 2019-2024 |
| Growth Rate | CAGR of 11.70% from 2019-2033 |
| Segmentation |
|
Table of Contents
- 1. Introduction
- 1.1. Research Scope
- 1.2. Market Segmentation
- 1.3. Research Methodology
- 1.4. Definitions and Assumptions
- 2. Executive Summary
- 2.1. Introduction
- 3. Market Dynamics
- 3.1. Introduction
- 3.2. Market Drivers
- 3.2.1. Increasing Affinity of the Millennial Population Towards Technologically Advanced Appliances and Rising Number of Smartphone Users; Rise in Demand for Wireless Headphones and Infotainment Devices
- 3.3. Market Restrains
- 3.3.1. Optimizing Battery Life of Hearable Device
- 3.4. Market Trends
- 3.4.1. Rise in Demand for Wireless Headphones and Infotainment Devices to Drive the Market Growth
- 4. Market Factor Analysis
- 4.1. Porters Five Forces
- 4.2. Supply/Value Chain
- 4.3. PESTEL analysis
- 4.4. Market Entropy
- 4.5. Patent/Trademark Analysis
- 5. Global Hearable Electronic Devices Industry Analysis, Insights and Forecast, 2019-2031
- 5.1. Market Analysis, Insights and Forecast - by Type
- 5.1.1. In-Ear
- 5.1.2. On-Ear
- 5.1.3. Over-Ear
- 5.2. Market Analysis, Insights and Forecast - by Product
- 5.2.1. Headsets
- 5.2.2. Earbuds
- 5.2.3. Hearing Aids
- 5.3. Market Analysis, Insights and Forecast - by Region
- 5.3.1. North America
- 5.3.2. Europe
- 5.3.3. Asia Pacific
- 5.3.4. Latin America
- 5.3.5. Middle East
- 5.1. Market Analysis, Insights and Forecast - by Type
- 6. North America Hearable Electronic Devices Industry Analysis, Insights and Forecast, 2019-2031
- 6.1. Market Analysis, Insights and Forecast - by Type
- 6.1.1. In-Ear
- 6.1.2. On-Ear
- 6.1.3. Over-Ear
- 6.2. Market Analysis, Insights and Forecast - by Product
- 6.2.1. Headsets
- 6.2.2. Earbuds
- 6.2.3. Hearing Aids
- 6.1. Market Analysis, Insights and Forecast - by Type
- 7. Europe Hearable Electronic Devices Industry Analysis, Insights and Forecast, 2019-2031
- 7.1. Market Analysis, Insights and Forecast - by Type
- 7.1.1. In-Ear
- 7.1.2. On-Ear
- 7.1.3. Over-Ear
- 7.2. Market Analysis, Insights and Forecast - by Product
- 7.2.1. Headsets
- 7.2.2. Earbuds
- 7.2.3. Hearing Aids
- 7.1. Market Analysis, Insights and Forecast - by Type
- 8. Asia Pacific Hearable Electronic Devices Industry Analysis, Insights and Forecast, 2019-2031
- 8.1. Market Analysis, Insights and Forecast - by Type
- 8.1.1. In-Ear
- 8.1.2. On-Ear
- 8.1.3. Over-Ear
- 8.2. Market Analysis, Insights and Forecast - by Product
- 8.2.1. Headsets
- 8.2.2. Earbuds
- 8.2.3. Hearing Aids
- 8.1. Market Analysis, Insights and Forecast - by Type
- 9. Latin America Hearable Electronic Devices Industry Analysis, Insights and Forecast, 2019-2031
- 9.1. Market Analysis, Insights and Forecast - by Type
- 9.1.1. In-Ear
- 9.1.2. On-Ear
- 9.1.3. Over-Ear
- 9.2. Market Analysis, Insights and Forecast - by Product
- 9.2.1. Headsets
- 9.2.2. Earbuds
- 9.2.3. Hearing Aids
- 9.1. Market Analysis, Insights and Forecast - by Type
- 10. Middle East Hearable Electronic Devices Industry Analysis, Insights and Forecast, 2019-2031
- 10.1. Market Analysis, Insights and Forecast - by Type
- 10.1.1. In-Ear
- 10.1.2. On-Ear
- 10.1.3. Over-Ear
- 10.2. Market Analysis, Insights and Forecast - by Product
- 10.2.1. Headsets
- 10.2.2. Earbuds
- 10.2.3. Hearing Aids
- 10.1. Market Analysis, Insights and Forecast - by Type
- 11. North America Hearable Electronic Devices Industry Analysis, Insights and Forecast, 2019-2031
- 11.1. Market Analysis, Insights and Forecast - By Country/Sub-region
- 11.1.1 United States
- 11.1.2 Canada
- 12. Europe Hearable Electronic Devices Industry Analysis, Insights and Forecast, 2019-2031
- 12.1. Market Analysis, Insights and Forecast - By Country/Sub-region
- 12.1.1 United Kingdom
- 12.1.2 Germany
- 12.1.3 France
- 12.1.4 Rest of Europe
- 13. Asia Pacific Hearable Electronic Devices Industry Analysis, Insights and Forecast, 2019-2031
- 13.1. Market Analysis, Insights and Forecast - By Country/Sub-region
- 13.1.1 China
- 13.1.2 Japan
- 13.1.3 India
- 13.1.4 South Korea
- 13.1.5 Rest of Asia Pacific
- 14. Latin America Hearable Electronic Devices Industry Analysis, Insights and Forecast, 2019-2031
- 14.1. Market Analysis, Insights and Forecast - By Country/Sub-region
- 14.1.1.
- 15. Middle East Hearable Electronic Devices Industry Analysis, Insights and Forecast, 2019-2031
- 15.1. Market Analysis, Insights and Forecast - By Country/Sub-region
- 15.1.1.
- 16. Competitive Analysis
- 16.1. Global Market Share Analysis 2024
- 16.2. Company Profiles
- 16.2.1 Bose Corporation
- 16.2.1.1. Overview
- 16.2.1.2. Products
- 16.2.1.3. SWOT Analysis
- 16.2.1.4. Recent Developments
- 16.2.1.5. Financials (Based on Availability)
- 16.2.2 Apple Inc (Incl Beats Electronics)
- 16.2.2.1. Overview
- 16.2.2.2. Products
- 16.2.2.3. SWOT Analysis
- 16.2.2.4. Recent Developments
- 16.2.2.5. Financials (Based on Availability)
- 16.2.3 ReSound (GN Group)
- 16.2.3.1. Overview
- 16.2.3.2. Products
- 16.2.3.3. SWOT Analysis
- 16.2.3.4. Recent Developments
- 16.2.3.5. Financials (Based on Availability)
- 16.2.4 Xiaomi Corporation
- 16.2.4.1. Overview
- 16.2.4.2. Products
- 16.2.4.3. SWOT Analysis
- 16.2.4.4. Recent Developments
- 16.2.4.5. Financials (Based on Availability)
- 16.2.5 Skullcandy Inc
- 16.2.5.1. Overview
- 16.2.5.2. Products
- 16.2.5.3. SWOT Analysis
- 16.2.5.4. Recent Developments
- 16.2.5.5. Financials (Based on Availability)
- 16.2.6 Samsung Electronics Co Ltd (Harman International Industries Inc (Incl JBL)
- 16.2.6.1. Overview
- 16.2.6.2. Products
- 16.2.6.3. SWOT Analysis
- 16.2.6.4. Recent Developments
- 16.2.6.5. Financials (Based on Availability)
- 16.2.7 Sennheiser Electronic GMBH & Co
- 16.2.7.1. Overview
- 16.2.7.2. Products
- 16.2.7.3. SWOT Analysis
- 16.2.7.4. Recent Developments
- 16.2.7.5. Financials (Based on Availability)
- 16.2.8 Starkey Hearing Technologies
- 16.2.8.1. Overview
- 16.2.8.2. Products
- 16.2.8.3. SWOT Analysis
- 16.2.8.4. Recent Developments
- 16.2.8.5. Financials (Based on Availability)
- 16.2.9 Demant A/S
- 16.2.9.1. Overview
- 16.2.9.2. Products
- 16.2.9.3. SWOT Analysis
- 16.2.9.4. Recent Developments
- 16.2.9.5. Financials (Based on Availability)
- 16.2.10 WS Audiology A/S
- 16.2.10.1. Overview
- 16.2.10.2. Products
- 16.2.10.3. SWOT Analysis
- 16.2.10.4. Recent Developments
- 16.2.10.5. Financials (Based on Availability)
- 16.2.11 Sony Corporation
- 16.2.11.1. Overview
- 16.2.11.2. Products
- 16.2.11.3. SWOT Analysis
- 16.2.11.4. Recent Developments
- 16.2.11.5. Financials (Based on Availability)
- 16.2.1 Bose Corporation
List of Figures
- Figure 1: Global Hearable Electronic Devices Industry Revenue Breakdown (Million, %) by Region 2024 & 2032
- Figure 2: Global Hearable Electronic Devices Industry Volume Breakdown (K Unit, %) by Region 2024 & 2032
- Figure 3: North America Hearable Electronic Devices Industry Revenue (Million), by Country 2024 & 2032
- Figure 4: North America Hearable Electronic Devices Industry Volume (K Unit), by Country 2024 & 2032
- Figure 5: North America Hearable Electronic Devices Industry Revenue Share (%), by Country 2024 & 2032
- Figure 6: North America Hearable Electronic Devices Industry Volume Share (%), by Country 2024 & 2032
- Figure 7: Europe Hearable Electronic Devices Industry Revenue (Million), by Country 2024 & 2032
- Figure 8: Europe Hearable Electronic Devices Industry Volume (K Unit), by Country 2024 & 2032
- Figure 9: Europe Hearable Electronic Devices Industry Revenue Share (%), by Country 2024 & 2032
- Figure 10: Europe Hearable Electronic Devices Industry Volume Share (%), by Country 2024 & 2032
- Figure 11: Asia Pacific Hearable Electronic Devices Industry Revenue (Million), by Country 2024 & 2032
- Figure 12: Asia Pacific Hearable Electronic Devices Industry Volume (K Unit), by Country 2024 & 2032
- Figure 13: Asia Pacific Hearable Electronic Devices Industry Revenue Share (%), by Country 2024 & 2032
- Figure 14: Asia Pacific Hearable Electronic Devices Industry Volume Share (%), by Country 2024 & 2032
- Figure 15: Latin America Hearable Electronic Devices Industry Revenue (Million), by Country 2024 & 2032
- Figure 16: Latin America Hearable Electronic Devices Industry Volume (K Unit), by Country 2024 & 2032
- Figure 17: Latin America Hearable Electronic Devices Industry Revenue Share (%), by Country 2024 & 2032
- Figure 18: Latin America Hearable Electronic Devices Industry Volume Share (%), by Country 2024 & 2032
- Figure 19: Middle East Hearable Electronic Devices Industry Revenue (Million), by Country 2024 & 2032
- Figure 20: Middle East Hearable Electronic Devices Industry Volume (K Unit), by Country 2024 & 2032
- Figure 21: Middle East Hearable Electronic Devices Industry Revenue Share (%), by Country 2024 & 2032
- Figure 22: Middle East Hearable Electronic Devices Industry Volume Share (%), by Country 2024 & 2032
- Figure 23: North America Hearable Electronic Devices Industry Revenue (Million), by Type 2024 & 2032
- Figure 24: North America Hearable Electronic Devices Industry Volume (K Unit), by Type 2024 & 2032
- Figure 25: North America Hearable Electronic Devices Industry Revenue Share (%), by Type 2024 & 2032
- Figure 26: North America Hearable Electronic Devices Industry Volume Share (%), by Type 2024 & 2032
- Figure 27: North America Hearable Electronic Devices Industry Revenue (Million), by Product 2024 & 2032
- Figure 28: North America Hearable Electronic Devices Industry Volume (K Unit), by Product 2024 & 2032
- Figure 29: North America Hearable Electronic Devices Industry Revenue Share (%), by Product 2024 & 2032
- Figure 30: North America Hearable Electronic Devices Industry Volume Share (%), by Product 2024 & 2032
- Figure 31: North America Hearable Electronic Devices Industry Revenue (Million), by Country 2024 & 2032
- Figure 32: North America Hearable Electronic Devices Industry Volume (K Unit), by Country 2024 & 2032
- Figure 33: North America Hearable Electronic Devices Industry Revenue Share (%), by Country 2024 & 2032
- Figure 34: North America Hearable Electronic Devices Industry Volume Share (%), by Country 2024 & 2032
- Figure 35: Europe Hearable Electronic Devices Industry Revenue (Million), by Type 2024 & 2032
- Figure 36: Europe Hearable Electronic Devices Industry Volume (K Unit), by Type 2024 & 2032
- Figure 37: Europe Hearable Electronic Devices Industry Revenue Share (%), by Type 2024 & 2032
- Figure 38: Europe Hearable Electronic Devices Industry Volume Share (%), by Type 2024 & 2032
- Figure 39: Europe Hearable Electronic Devices Industry Revenue (Million), by Product 2024 & 2032
- Figure 40: Europe Hearable Electronic Devices Industry Volume (K Unit), by Product 2024 & 2032
- Figure 41: Europe Hearable Electronic Devices Industry Revenue Share (%), by Product 2024 & 2032
- Figure 42: Europe Hearable Electronic Devices Industry Volume Share (%), by Product 2024 & 2032
- Figure 43: Europe Hearable Electronic Devices Industry Revenue (Million), by Country 2024 & 2032
- Figure 44: Europe Hearable Electronic Devices Industry Volume (K Unit), by Country 2024 & 2032
- Figure 45: Europe Hearable Electronic Devices Industry Revenue Share (%), by Country 2024 & 2032
- Figure 46: Europe Hearable Electronic Devices Industry Volume Share (%), by Country 2024 & 2032
- Figure 47: Asia Pacific Hearable Electronic Devices Industry Revenue (Million), by Type 2024 & 2032
- Figure 48: Asia Pacific Hearable Electronic Devices Industry Volume (K Unit), by Type 2024 & 2032
- Figure 49: Asia Pacific Hearable Electronic Devices Industry Revenue Share (%), by Type 2024 & 2032
- Figure 50: Asia Pacific Hearable Electronic Devices Industry Volume Share (%), by Type 2024 & 2032
- Figure 51: Asia Pacific Hearable Electronic Devices Industry Revenue (Million), by Product 2024 & 2032
- Figure 52: Asia Pacific Hearable Electronic Devices Industry Volume (K Unit), by Product 2024 & 2032
- Figure 53: Asia Pacific Hearable Electronic Devices Industry Revenue Share (%), by Product 2024 & 2032
- Figure 54: Asia Pacific Hearable Electronic Devices Industry Volume Share (%), by Product 2024 & 2032
- Figure 55: Asia Pacific Hearable Electronic Devices Industry Revenue (Million), by Country 2024 & 2032
- Figure 56: Asia Pacific Hearable Electronic Devices Industry Volume (K Unit), by Country 2024 & 2032
- Figure 57: Asia Pacific Hearable Electronic Devices Industry Revenue Share (%), by Country 2024 & 2032
- Figure 58: Asia Pacific Hearable Electronic Devices Industry Volume Share (%), by Country 2024 & 2032
- Figure 59: Latin America Hearable Electronic Devices Industry Revenue (Million), by Type 2024 & 2032
- Figure 60: Latin America Hearable Electronic Devices Industry Volume (K Unit), by Type 2024 & 2032
- Figure 61: Latin America Hearable Electronic Devices Industry Revenue Share (%), by Type 2024 & 2032
- Figure 62: Latin America Hearable Electronic Devices Industry Volume Share (%), by Type 2024 & 2032
- Figure 63: Latin America Hearable Electronic Devices Industry Revenue (Million), by Product 2024 & 2032
- Figure 64: Latin America Hearable Electronic Devices Industry Volume (K Unit), by Product 2024 & 2032
- Figure 65: Latin America Hearable Electronic Devices Industry Revenue Share (%), by Product 2024 & 2032
- Figure 66: Latin America Hearable Electronic Devices Industry Volume Share (%), by Product 2024 & 2032
- Figure 67: Latin America Hearable Electronic Devices Industry Revenue (Million), by Country 2024 & 2032
- Figure 68: Latin America Hearable Electronic Devices Industry Volume (K Unit), by Country 2024 & 2032
- Figure 69: Latin America Hearable Electronic Devices Industry Revenue Share (%), by Country 2024 & 2032
- Figure 70: Latin America Hearable Electronic Devices Industry Volume Share (%), by Country 2024 & 2032
- Figure 71: Middle East Hearable Electronic Devices Industry Revenue (Million), by Type 2024 & 2032
- Figure 72: Middle East Hearable Electronic Devices Industry Volume (K Unit), by Type 2024 & 2032
- Figure 73: Middle East Hearable Electronic Devices Industry Revenue Share (%), by Type 2024 & 2032
- Figure 74: Middle East Hearable Electronic Devices Industry Volume Share (%), by Type 2024 & 2032
- Figure 75: Middle East Hearable Electronic Devices Industry Revenue (Million), by Product 2024 & 2032
- Figure 76: Middle East Hearable Electronic Devices Industry Volume (K Unit), by Product 2024 & 2032
- Figure 77: Middle East Hearable Electronic Devices Industry Revenue Share (%), by Product 2024 & 2032
- Figure 78: Middle East Hearable Electronic Devices Industry Volume Share (%), by Product 2024 & 2032
- Figure 79: Middle East Hearable Electronic Devices Industry Revenue (Million), by Country 2024 & 2032
- Figure 80: Middle East Hearable Electronic Devices Industry Volume (K Unit), by Country 2024 & 2032
- Figure 81: Middle East Hearable Electronic Devices Industry Revenue Share (%), by Country 2024 & 2032
- Figure 82: Middle East Hearable Electronic Devices Industry Volume Share (%), by Country 2024 & 2032
List of Tables
- Table 1: Global Hearable Electronic Devices Industry Revenue Million Forecast, by Region 2019 & 2032
- Table 2: Global Hearable Electronic Devices Industry Volume K Unit Forecast, by Region 2019 & 2032
- Table 3: Global Hearable Electronic Devices Industry Revenue Million Forecast, by Type 2019 & 2032
- Table 4: Global Hearable Electronic Devices Industry Volume K Unit Forecast, by Type 2019 & 2032
- Table 5: Global Hearable Electronic Devices Industry Revenue Million Forecast, by Product 2019 & 2032
- Table 6: Global Hearable Electronic Devices Industry Volume K Unit Forecast, by Product 2019 & 2032
- Table 7: Global Hearable Electronic Devices Industry Revenue Million Forecast, by Region 2019 & 2032
- Table 8: Global Hearable Electronic Devices Industry Volume K Unit Forecast, by Region 2019 & 2032
- Table 9: Global Hearable Electronic Devices Industry Revenue Million Forecast, by Country 2019 & 2032
- Table 10: Global Hearable Electronic Devices Industry Volume K Unit Forecast, by Country 2019 & 2032
- Table 11: United States Hearable Electronic Devices Industry Revenue (Million) Forecast, by Application 2019 & 2032
- Table 12: United States Hearable Electronic Devices Industry Volume (K Unit) Forecast, by Application 2019 & 2032
- Table 13: Canada Hearable Electronic Devices Industry Revenue (Million) Forecast, by Application 2019 & 2032
- Table 14: Canada Hearable Electronic Devices Industry Volume (K Unit) Forecast, by Application 2019 & 2032
- Table 15: Global Hearable Electronic Devices Industry Revenue Million Forecast, by Country 2019 & 2032
- Table 16: Global Hearable Electronic Devices Industry Volume K Unit Forecast, by Country 2019 & 2032
- Table 17: United Kingdom Hearable Electronic Devices Industry Revenue (Million) Forecast, by Application 2019 & 2032
- Table 18: United Kingdom Hearable Electronic Devices Industry Volume (K Unit) Forecast, by Application 2019 & 2032
- Table 19: Germany Hearable Electronic Devices Industry Revenue (Million) Forecast, by Application 2019 & 2032
- Table 20: Germany Hearable Electronic Devices Industry Volume (K Unit) Forecast, by Application 2019 & 2032
- Table 21: France Hearable Electronic Devices Industry Revenue (Million) Forecast, by Application 2019 & 2032
- Table 22: France Hearable Electronic Devices Industry Volume (K Unit) Forecast, by Application 2019 & 2032
- Table 23: Rest of Europe Hearable Electronic Devices Industry Revenue (Million) Forecast, by Application 2019 & 2032
- Table 24: Rest of Europe Hearable Electronic Devices Industry Volume (K Unit) Forecast, by Application 2019 & 2032
- Table 25: Global Hearable Electronic Devices Industry Revenue Million Forecast, by Country 2019 & 2032
- Table 26: Global Hearable Electronic Devices Industry Volume K Unit Forecast, by Country 2019 & 2032
- Table 27: China Hearable Electronic Devices Industry Revenue (Million) Forecast, by Application 2019 & 2032
- Table 28: China Hearable Electronic Devices Industry Volume (K Unit) Forecast, by Application 2019 & 2032
- Table 29: Japan Hearable Electronic Devices Industry Revenue (Million) Forecast, by Application 2019 & 2032
- Table 30: Japan Hearable Electronic Devices Industry Volume (K Unit) Forecast, by Application 2019 & 2032
- Table 31: India Hearable Electronic Devices Industry Revenue (Million) Forecast, by Application 2019 & 2032
- Table 32: India Hearable Electronic Devices Industry Volume (K Unit) Forecast, by Application 2019 & 2032
- Table 33: South Korea Hearable Electronic Devices Industry Revenue (Million) Forecast, by Application 2019 & 2032
- Table 34: South Korea Hearable Electronic Devices Industry Volume (K Unit) Forecast, by Application 2019 & 2032
- Table 35: Rest of Asia Pacific Hearable Electronic Devices Industry Revenue (Million) Forecast, by Application 2019 & 2032
- Table 36: Rest of Asia Pacific Hearable Electronic Devices Industry Volume (K Unit) Forecast, by Application 2019 & 2032
- Table 37: Global Hearable Electronic Devices Industry Revenue Million Forecast, by Country 2019 & 2032
- Table 38: Global Hearable Electronic Devices Industry Volume K Unit Forecast, by Country 2019 & 2032
- Table 39: Hearable Electronic Devices Industry Revenue (Million) Forecast, by Application 2019 & 2032
- Table 40: Hearable Electronic Devices Industry Volume (K Unit) Forecast, by Application 2019 & 2032
- Table 41: Global Hearable Electronic Devices Industry Revenue Million Forecast, by Country 2019 & 2032
- Table 42: Global Hearable Electronic Devices Industry Volume K Unit Forecast, by Country 2019 & 2032
- Table 43: Hearable Electronic Devices Industry Revenue (Million) Forecast, by Application 2019 & 2032
- Table 44: Hearable Electronic Devices Industry Volume (K Unit) Forecast, by Application 2019 & 2032
- Table 45: Global Hearable Electronic Devices Industry Revenue Million Forecast, by Type 2019 & 2032
- Table 46: Global Hearable Electronic Devices Industry Volume K Unit Forecast, by Type 2019 & 2032
- Table 47: Global Hearable Electronic Devices Industry Revenue Million Forecast, by Product 2019 & 2032
- Table 48: Global Hearable Electronic Devices Industry Volume K Unit Forecast, by Product 2019 & 2032
- Table 49: Global Hearable Electronic Devices Industry Revenue Million Forecast, by Country 2019 & 2032
- Table 50: Global Hearable Electronic Devices Industry Volume K Unit Forecast, by Country 2019 & 2032
- Table 51: United States Hearable Electronic Devices Industry Revenue (Million) Forecast, by Application 2019 & 2032
- Table 52: United States Hearable Electronic Devices Industry Volume (K Unit) Forecast, by Application 2019 & 2032
- Table 53: Canada Hearable Electronic Devices Industry Revenue (Million) Forecast, by Application 2019 & 2032
- Table 54: Canada Hearable Electronic Devices Industry Volume (K Unit) Forecast, by Application 2019 & 2032
- Table 55: Global Hearable Electronic Devices Industry Revenue Million Forecast, by Type 2019 & 2032
- Table 56: Global Hearable Electronic Devices Industry Volume K Unit Forecast, by Type 2019 & 2032
- Table 57: Global Hearable Electronic Devices Industry Revenue Million Forecast, by Product 2019 & 2032
- Table 58: Global Hearable Electronic Devices Industry Volume K Unit Forecast, by Product 2019 & 2032
- Table 59: Global Hearable Electronic Devices Industry Revenue Million Forecast, by Country 2019 & 2032
- Table 60: Global Hearable Electronic Devices Industry Volume K Unit Forecast, by Country 2019 & 2032
- Table 61: United Kingdom Hearable Electronic Devices Industry Revenue (Million) Forecast, by Application 2019 & 2032
- Table 62: United Kingdom Hearable Electronic Devices Industry Volume (K Unit) Forecast, by Application 2019 & 2032
- Table 63: Germany Hearable Electronic Devices Industry Revenue (Million) Forecast, by Application 2019 & 2032
- Table 64: Germany Hearable Electronic Devices Industry Volume (K Unit) Forecast, by Application 2019 & 2032
- Table 65: France Hearable Electronic Devices Industry Revenue (Million) Forecast, by Application 2019 & 2032
- Table 66: France Hearable Electronic Devices Industry Volume (K Unit) Forecast, by Application 2019 & 2032
- Table 67: Rest of Europe Hearable Electronic Devices Industry Revenue (Million) Forecast, by Application 2019 & 2032
- Table 68: Rest of Europe Hearable Electronic Devices Industry Volume (K Unit) Forecast, by Application 2019 & 2032
- Table 69: Global Hearable Electronic Devices Industry Revenue Million Forecast, by Type 2019 & 2032
- Table 70: Global Hearable Electronic Devices Industry Volume K Unit Forecast, by Type 2019 & 2032
- Table 71: Global Hearable Electronic Devices Industry Revenue Million Forecast, by Product 2019 & 2032
- Table 72: Global Hearable Electronic Devices Industry Volume K Unit Forecast, by Product 2019 & 2032
- Table 73: Global Hearable Electronic Devices Industry Revenue Million Forecast, by Country 2019 & 2032
- Table 74: Global Hearable Electronic Devices Industry Volume K Unit Forecast, by Country 2019 & 2032
- Table 75: China Hearable Electronic Devices Industry Revenue (Million) Forecast, by Application 2019 & 2032
- Table 76: China Hearable Electronic Devices Industry Volume (K Unit) Forecast, by Application 2019 & 2032
- Table 77: Japan Hearable Electronic Devices Industry Revenue (Million) Forecast, by Application 2019 & 2032
- Table 78: Japan Hearable Electronic Devices Industry Volume (K Unit) Forecast, by Application 2019 & 2032
- Table 79: India Hearable Electronic Devices Industry Revenue (Million) Forecast, by Application 2019 & 2032
- Table 80: India Hearable Electronic Devices Industry Volume (K Unit) Forecast, by Application 2019 & 2032
- Table 81: South Korea Hearable Electronic Devices Industry Revenue (Million) Forecast, by Application 2019 & 2032
- Table 82: South Korea Hearable Electronic Devices Industry Volume (K Unit) Forecast, by Application 2019 & 2032
- Table 83: Rest of Asia Pacific Hearable Electronic Devices Industry Revenue (Million) Forecast, by Application 2019 & 2032
- Table 84: Rest of Asia Pacific Hearable Electronic Devices Industry Volume (K Unit) Forecast, by Application 2019 & 2032
- Table 85: Global Hearable Electronic Devices Industry Revenue Million Forecast, by Type 2019 & 2032
- Table 86: Global Hearable Electronic Devices Industry Volume K Unit Forecast, by Type 2019 & 2032
- Table 87: Global Hearable Electronic Devices Industry Revenue Million Forecast, by Product 2019 & 2032
- Table 88: Global Hearable Electronic Devices Industry Volume K Unit Forecast, by Product 2019 & 2032
- Table 89: Global Hearable Electronic Devices Industry Revenue Million Forecast, by Country 2019 & 2032
- Table 90: Global Hearable Electronic Devices Industry Volume K Unit Forecast, by Country 2019 & 2032
- Table 91: Global Hearable Electronic Devices Industry Revenue Million Forecast, by Type 2019 & 2032
- Table 92: Global Hearable Electronic Devices Industry Volume K Unit Forecast, by Type 2019 & 2032
- Table 93: Global Hearable Electronic Devices Industry Revenue Million Forecast, by Product 2019 & 2032
- Table 94: Global Hearable Electronic Devices Industry Volume K Unit Forecast, by Product 2019 & 2032
- Table 95: Global Hearable Electronic Devices Industry Revenue Million Forecast, by Country 2019 & 2032
- Table 96: Global Hearable Electronic Devices Industry Volume K Unit Forecast, by Country 2019 & 2032
Frequently Asked Questions
1. What is the projected Compound Annual Growth Rate (CAGR) of the Hearable Electronic Devices Industry?
The projected CAGR is approximately 11.70%.
2. Which companies are prominent players in the Hearable Electronic Devices Industry?
Key companies in the market include Bose Corporation, Apple Inc (Incl Beats Electronics), ReSound (GN Group), Xiaomi Corporation, Skullcandy Inc, Samsung Electronics Co Ltd (Harman International Industries Inc (Incl JBL), Sennheiser Electronic GMBH & Co, Starkey Hearing Technologies, Demant A/S, WS Audiology A/S, Sony Corporation.
3. What are the main segments of the Hearable Electronic Devices Industry?
The market segments include Type, Product.
4. Can you provide details about the market size?
The market size is estimated to be USD XX Million as of 2022.
5. What are some drivers contributing to market growth?
Increasing Affinity of the Millennial Population Towards Technologically Advanced Appliances and Rising Number of Smartphone Users; Rise in Demand for Wireless Headphones and Infotainment Devices.
6. What are the notable trends driving market growth?
Rise in Demand for Wireless Headphones and Infotainment Devices to Drive the Market Growth.
7. Are there any restraints impacting market growth?
Optimizing Battery Life of Hearable Device.
8. Can you provide examples of recent developments in the market?
November 2022 - Starkey Partners with Special Olympics International to Bring Hearing Health Services to Athletes in Puerto Rico and provides life-changing health services and hearing instruments to Special Olympics athletes worldwide while helping make healthy hearing more inclusive of people with intellectual disabilities.
9. What pricing options are available for accessing the report?
Pricing options include single-user, multi-user, and enterprise licenses priced at USD 4750, USD 5250, and USD 8750 respectively.
10. Is the market size provided in terms of value or volume?
The market size is provided in terms of value, measured in Million and volume, measured in K Unit.
11. Are there any specific market keywords associated with the report?
Yes, the market keyword associated with the report is "Hearable Electronic Devices Industry," which aids in identifying and referencing the specific market segment covered.
12. How do I determine which pricing option suits my needs best?
The pricing options vary based on user requirements and access needs. Individual users may opt for single-user licenses, while businesses requiring broader access may choose multi-user or enterprise licenses for cost-effective access to the report.
13. Are there any additional resources or data provided in the Hearable Electronic Devices Industry report?
While the report offers comprehensive insights, it's advisable to review the specific contents or supplementary materials provided to ascertain if additional resources or data are available.
14. How can I stay updated on further developments or reports in the Hearable Electronic Devices Industry?
To stay informed about further developments, trends, and reports in the Hearable Electronic Devices Industry, consider subscribing to industry newsletters, following relevant companies and organizations, or regularly checking reputable industry news sources and publications.
Methodology
Step 1 - Identification of Relevant Samples Size from Population Database


Step 2 - Approaches for Defining Global Market Size (Value, Volume* & Price*)

Note*: In applicable scenarios
Step 3 - Data Sources
Primary Research
- Web Analytics
- Survey Reports
- Research Institute
- Latest Research Reports
- Opinion Leaders
Secondary Research
- Annual Reports
- White Paper
- Latest Press Release
- Industry Association
- Paid Database
- Investor Presentations

Step 4 - Data Triangulation
Involves using different sources of information in order to increase the validity of a study
These sources are likely to be stakeholders in a program - participants, other researchers, program staff, other community members, and so on.
Then we put all data in single framework & apply various statistical tools to find out the dynamic on the market.
During the analysis stage, feedback from the stakeholder groups would be compared to determine areas of agreement as well as areas of divergence


