
Key Insights
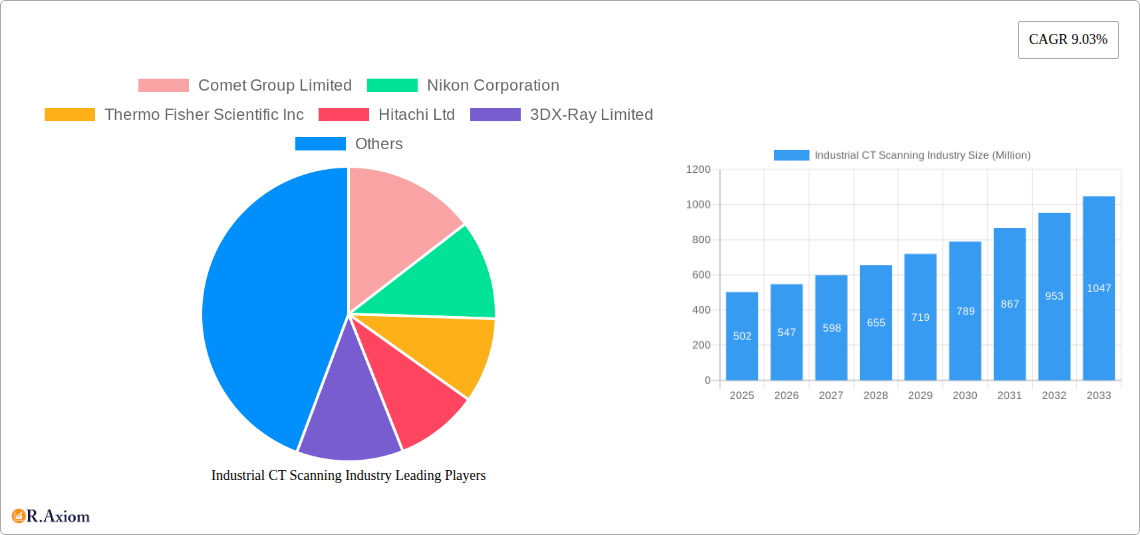
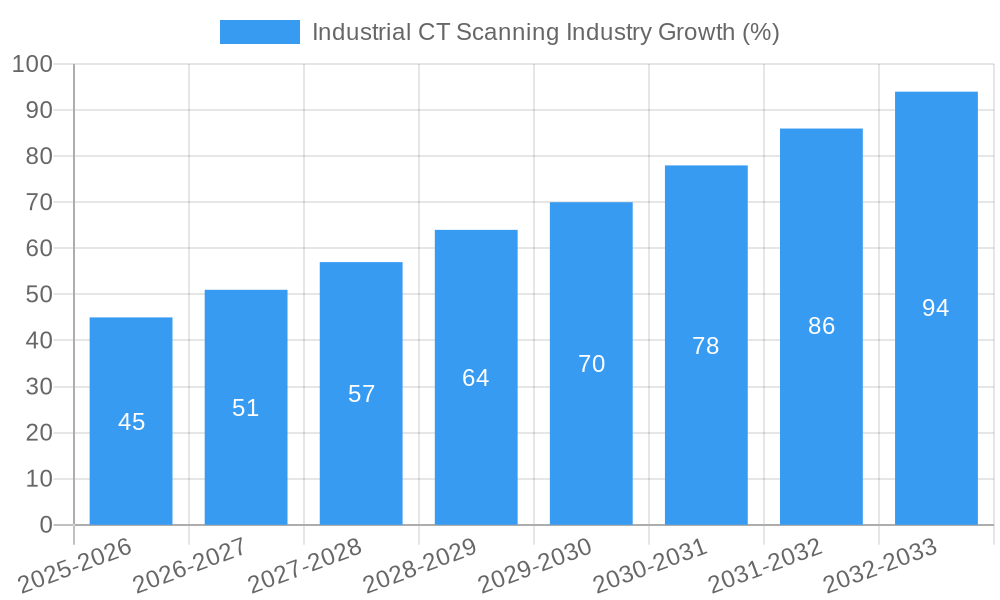
The Industrial CT Scanning market, valued at $502 million in 2025, is projected to experience robust growth, exhibiting a Compound Annual Growth Rate (CAGR) of 9.03% from 2025 to 2033. This expansion is driven by several key factors. Firstly, the increasing demand for advanced non-destructive testing (NDT) methods across diverse industries like aerospace, automotive, and electronics fuels the adoption of Industrial CT scanning for quality control and failure analysis. The growing complexity of manufactured components necessitates precise and detailed inspection capabilities, which Industrial CT Scanning uniquely provides. Furthermore, the rising need for improved product safety and reliability, particularly in sectors with stringent regulatory requirements, further bolsters market growth. Technological advancements, such as higher resolution imaging and faster scan times, along with the development of more user-friendly software and analysis tools, are also contributing significantly to market expansion.
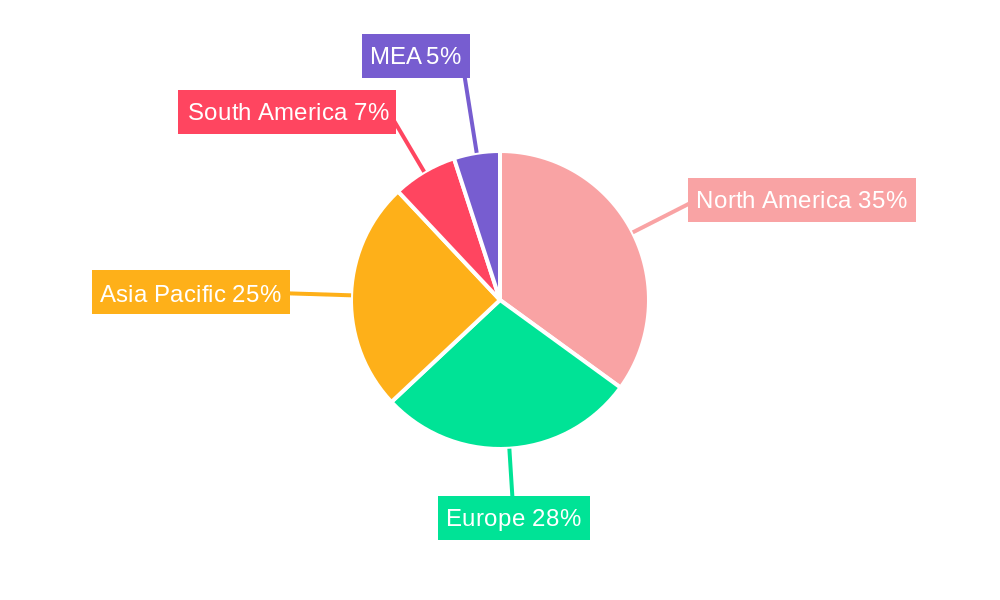
Despite the positive outlook, the market faces certain challenges. High initial investment costs associated with procuring and maintaining Industrial CT scanning systems can be a barrier to entry for smaller companies. Additionally, the specialized expertise required for operating and interpreting the scan data necessitates skilled personnel, potentially limiting adoption in regions with limited technical expertise. However, the long-term benefits of improved quality control, reduced production costs, and enhanced product safety are anticipated to outweigh these challenges, sustaining market growth throughout the forecast period. The market segmentation reveals strong performance across various applications (flaw detection, failure analysis, assembly analysis) and end-user industries, with North America and Asia Pacific anticipated as leading regional markets due to high industrial activity and technological advancements.
This comprehensive report provides an in-depth analysis of the Industrial CT Scanning industry, offering invaluable insights for stakeholders seeking to understand market dynamics, competitive landscapes, and future growth trajectories. The study period spans from 2019 to 2033, with 2025 serving as both the base and estimated year. The report forecasts market trends from 2025 to 2033, utilizing data from the historical period (2019-2024). The market is segmented by application (Flaw Detection and Inspection, Failure Analysis, Assembly Analysis, Other Applications) and end-user industry (Aerospace, Automotive, Electronics, Oil and Gas, Other End-User Industries). Key players analyzed include Comet Group Limited, Nikon Corporation, Thermo Fisher Scientific Inc, Hitachi Ltd, 3DX-Ray Limited, Zeiss International, Omron Corporation, Waygate Technologies, Bruker Corporation, and Shimadzu Corporation. The report projects a market value exceeding xx Million by 2033.
Industrial CT Scanning Industry Market Concentration & Innovation
The Industrial CT Scanning market exhibits a moderately concentrated landscape, with the top 10 players holding an estimated xx% market share in 2025. This concentration is driven by significant investments in R&D, leading to innovative product development and strong brand recognition. However, the market also witnesses considerable innovation from smaller players focusing on niche applications and technological advancements.
- Market Share: The top three players (estimated) hold a combined xx% market share, highlighting the dominance of established players.
- M&A Activity: The industry has seen a moderate level of M&A activity in recent years, with deal values ranging from xx Million to xx Million. These transactions primarily focus on expanding product portfolios, accessing new markets, and enhancing technological capabilities.
- Regulatory Frameworks: Stringent safety and environmental regulations, varying across different geographies, influence market growth and necessitate compliance investments by players.
- Product Substitutes: While Industrial CT scanning enjoys a strong position, alternative non-destructive testing methods, such as ultrasonic testing and X-ray radiography, represent substitutes, particularly in specific applications.
- End-User Trends: The increasing demand for high-quality products across various end-user industries, coupled with a growing focus on enhanced process efficiency, fuels the adoption of advanced CT scanning technologies.
Industrial CT Scanning Industry Industry Trends & Insights
The Industrial CT Scanning industry is experiencing robust growth, driven by several key factors. The market is projected to register a CAGR of xx% during the forecast period (2025-2033), reaching a value exceeding xx Million by 2033. This growth is fueled by the increasing adoption of advanced materials, the rising need for precise quality control, and the expanding application base across diverse sectors. Technological advancements such as high-resolution imaging, faster scan times, and improved data processing capabilities further propel market expansion. Competitive dynamics are characterized by both price competition and innovation-driven differentiation. Market penetration across industries like aerospace and automotive remains high, while significant growth potential exists in emerging sectors like additive manufacturing. Consumer preferences are shifting towards integrated solutions offering streamlined workflows and comprehensive data analysis capabilities.
Dominant Markets & Segments in Industrial CT Scanning Industry
The Aerospace industry represents a dominant segment in the Industrial CT Scanning market, owing to the stringent quality control standards and the demand for precise internal component inspection. The Automotive industry follows closely, with widespread application in quality assurance and failure analysis. The Flaw Detection and Inspection application segment is the largest, driven by the need to identify defects early in the manufacturing process.
- Key Drivers for Aerospace: Stringent safety regulations, demand for lightweight yet strong components, and high-value products drive high CT scanning adoption.
- Key Drivers for Automotive: Growing demand for higher vehicle safety standards, miniaturization of components, and increasing production volumes contribute to significant CT adoption.
- Key Drivers for Flaw Detection and Inspection: Rising awareness of product quality, minimizing manufacturing defects, and reducing costly recalls are primary drivers for growth in this segment.
- Regional Dominance: North America and Europe currently hold a significant market share, but Asia-Pacific is projected to exhibit the fastest growth rate during the forecast period, driven by investments in manufacturing and technological advancement.
Industrial CT Scanning Industry Product Developments
Recent product developments focus on enhancing scan speed, image resolution, and automation capabilities. High-energy CT systems capable of scanning large and dense components are gaining traction. The integration of AI and machine learning into data analysis is improving accuracy and efficiency. These innovations aim to cater to the diverse needs of various industrial sectors, offering improved throughput and reduced processing times, delivering competitive advantages to manufacturers.
Report Scope & Segmentation Analysis
This report analyzes the Industrial CT Scanning market across various applications: Flaw Detection and Inspection (projected growth xx%), Failure Analysis (projected growth xx%), Assembly Analysis (projected growth xx%), and Other Applications (projected growth xx%). It also covers key end-user industries: Aerospace (projected growth xx%), Automotive (projected growth xx%), Electronics (projected growth xx%), Oil and Gas (projected growth xx%), and Other End-User Industries (projected growth xx%). Each segment’s analysis includes market size estimations, growth projections, and an assessment of competitive dynamics. Market sizes are presented in Millions USD.
Key Drivers of Industrial CT Scanning Industry Growth
Several factors are driving growth, including:
- Technological Advancements: High-resolution imaging, faster scan times, and enhanced software capabilities are improving accuracy and efficiency.
- Rising Demand for Quality Control: Stricter quality standards across various industries necessitate the adoption of advanced non-destructive testing methods.
- Expanding Applications: Industrial CT scanning is finding applications in new areas like additive manufacturing and materials research.
Challenges in the Industrial CT Scanning Industry Sector
The industry faces challenges including:
- High Initial Investment Costs: The purchase and installation of CT scanning systems can be expensive, deterring smaller companies.
- Specialized Expertise Required: Operating and interpreting CT scan data requires skilled personnel.
- Competition from Alternative Testing Methods: Ultrasonic testing and X-ray radiography provide alternative, albeit often less detailed, inspection methods.
Emerging Opportunities in Industrial CT Scanning Industry
Emerging opportunities include:
- Expansion into New Markets: Growing adoption in emerging economies offers significant growth potential.
- Development of Specialized Applications: Tailoring CT scanning systems for specific industries and applications offers niche market opportunities.
- Integration of AI and Machine Learning: Automation and enhanced data analysis capabilities increase efficiency and accuracy.
Leading Players in the Industrial CT Scanning Industry Market
- Comet Group Limited
- Nikon Corporation
- Thermo Fisher Scientific Inc
- Hitachi Ltd
- 3DX-Ray Limited
- Zeiss International
- Omron Corporation
- Waygate Technologies
- Bruker Corporation
- Shimadzu Corporation
Key Developments in Industrial CT Scanning Industry Industry
- December 2020: Waygate Technologies launched the Phoenix Power|scan HE, a high-energy CT system with significantly increased penetration power for inspecting large, dense components. This expands the application range of CT scanning, particularly in industries dealing with heavy machinery and materials.
- March 2021: ZEISS introduced the ZEISS Xradia CrystalCT micro-CT system, enabling 3D crystallographic imaging for advanced materials analysis in research and industry. This caters to the growing demand for detailed material characterization in various sectors.
Strategic Outlook for Industrial CT Scanning Industry Market
The Industrial CT Scanning market is poised for continued growth, driven by technological advancements, expanding applications, and increasing demand for precise quality control across diverse industries. The integration of AI and machine learning presents significant opportunities for enhanced efficiency and data analysis. Furthermore, the expansion into new markets and the development of customized solutions for specific industry needs will further fuel market expansion in the coming years. The market is expected to remain moderately concentrated, with continued competition among major players focused on innovation and technological differentiation.
Industrial CT Scanning Industry Segmentation
-
1. Application
- 1.1. Flaw Detection and Inspection
- 1.2. Failure Analysis
- 1.3. Assembly Analysis
- 1.4. Other Applications
-
2. End-user Industry
- 2.1. Aerospace and Defense
- 2.2. Automotive
- 2.3. Electronics
- 2.4. Oil and Gas
- 2.5. Other End-user Industries
Industrial CT Scanning Industry Segmentation By Geography
- 1. North America
- 2. Europe
- 3. Asia
- 4. Australia and New Zealand
- 5. Latin America
- 6. Middle East and Africa
Industrial CT Scanning Industry REPORT HIGHLIGHTS
| Aspects | Details |
|---|---|
| Study Period | 2019-2033 |
| Base Year | 2024 |
| Estimated Year | 2025 |
| Forecast Period | 2025-2033 |
| Historical Period | 2019-2024 |
| Growth Rate | CAGR of 9.03% from 2019-2033 |
| Segmentation |
|
Table of Contents
- 1. Introduction
- 1.1. Research Scope
- 1.2. Market Segmentation
- 1.3. Research Methodology
- 1.4. Definitions and Assumptions
- 2. Executive Summary
- 2.1. Introduction
- 3. Market Dynamics
- 3.1. Introduction
- 3.2. Market Drivers
- 3.2.1. Technology Improvements in Resolution and Image Processing; Intensifying Demand for Portable Radiography Equipment
- 3.3. Market Restrains
- 3.3.1. High Acquisition and Maintenace Cost of Industrial CT systems
- 3.4. Market Trends
- 3.4.1. Aerospace Industry to Drive the Industrial Computed Tomography Market
- 4. Market Factor Analysis
- 4.1. Porters Five Forces
- 4.2. Supply/Value Chain
- 4.3. PESTEL analysis
- 4.4. Market Entropy
- 4.5. Patent/Trademark Analysis
- 5. Global Industrial CT Scanning Industry Analysis, Insights and Forecast, 2019-2031
- 5.1. Market Analysis, Insights and Forecast - by Application
- 5.1.1. Flaw Detection and Inspection
- 5.1.2. Failure Analysis
- 5.1.3. Assembly Analysis
- 5.1.4. Other Applications
- 5.2. Market Analysis, Insights and Forecast - by End-user Industry
- 5.2.1. Aerospace and Defense
- 5.2.2. Automotive
- 5.2.3. Electronics
- 5.2.4. Oil and Gas
- 5.2.5. Other End-user Industries
- 5.3. Market Analysis, Insights and Forecast - by Region
- 5.3.1. North America
- 5.3.2. Europe
- 5.3.3. Asia
- 5.3.4. Australia and New Zealand
- 5.3.5. Latin America
- 5.3.6. Middle East and Africa
- 5.1. Market Analysis, Insights and Forecast - by Application
- 6. North America Industrial CT Scanning Industry Analysis, Insights and Forecast, 2019-2031
- 6.1. Market Analysis, Insights and Forecast - by Application
- 6.1.1. Flaw Detection and Inspection
- 6.1.2. Failure Analysis
- 6.1.3. Assembly Analysis
- 6.1.4. Other Applications
- 6.2. Market Analysis, Insights and Forecast - by End-user Industry
- 6.2.1. Aerospace and Defense
- 6.2.2. Automotive
- 6.2.3. Electronics
- 6.2.4. Oil and Gas
- 6.2.5. Other End-user Industries
- 6.1. Market Analysis, Insights and Forecast - by Application
- 7. Europe Industrial CT Scanning Industry Analysis, Insights and Forecast, 2019-2031
- 7.1. Market Analysis, Insights and Forecast - by Application
- 7.1.1. Flaw Detection and Inspection
- 7.1.2. Failure Analysis
- 7.1.3. Assembly Analysis
- 7.1.4. Other Applications
- 7.2. Market Analysis, Insights and Forecast - by End-user Industry
- 7.2.1. Aerospace and Defense
- 7.2.2. Automotive
- 7.2.3. Electronics
- 7.2.4. Oil and Gas
- 7.2.5. Other End-user Industries
- 7.1. Market Analysis, Insights and Forecast - by Application
- 8. Asia Industrial CT Scanning Industry Analysis, Insights and Forecast, 2019-2031
- 8.1. Market Analysis, Insights and Forecast - by Application
- 8.1.1. Flaw Detection and Inspection
- 8.1.2. Failure Analysis
- 8.1.3. Assembly Analysis
- 8.1.4. Other Applications
- 8.2. Market Analysis, Insights and Forecast - by End-user Industry
- 8.2.1. Aerospace and Defense
- 8.2.2. Automotive
- 8.2.3. Electronics
- 8.2.4. Oil and Gas
- 8.2.5. Other End-user Industries
- 8.1. Market Analysis, Insights and Forecast - by Application
- 9. Australia and New Zealand Industrial CT Scanning Industry Analysis, Insights and Forecast, 2019-2031
- 9.1. Market Analysis, Insights and Forecast - by Application
- 9.1.1. Flaw Detection and Inspection
- 9.1.2. Failure Analysis
- 9.1.3. Assembly Analysis
- 9.1.4. Other Applications
- 9.2. Market Analysis, Insights and Forecast - by End-user Industry
- 9.2.1. Aerospace and Defense
- 9.2.2. Automotive
- 9.2.3. Electronics
- 9.2.4. Oil and Gas
- 9.2.5. Other End-user Industries
- 9.1. Market Analysis, Insights and Forecast - by Application
- 10. Latin America Industrial CT Scanning Industry Analysis, Insights and Forecast, 2019-2031
- 10.1. Market Analysis, Insights and Forecast - by Application
- 10.1.1. Flaw Detection and Inspection
- 10.1.2. Failure Analysis
- 10.1.3. Assembly Analysis
- 10.1.4. Other Applications
- 10.2. Market Analysis, Insights and Forecast - by End-user Industry
- 10.2.1. Aerospace and Defense
- 10.2.2. Automotive
- 10.2.3. Electronics
- 10.2.4. Oil and Gas
- 10.2.5. Other End-user Industries
- 10.1. Market Analysis, Insights and Forecast - by Application
- 11. Middle East and Africa Industrial CT Scanning Industry Analysis, Insights and Forecast, 2019-2031
- 11.1. Market Analysis, Insights and Forecast - by Application
- 11.1.1. Flaw Detection and Inspection
- 11.1.2. Failure Analysis
- 11.1.3. Assembly Analysis
- 11.1.4. Other Applications
- 11.2. Market Analysis, Insights and Forecast - by End-user Industry
- 11.2.1. Aerospace and Defense
- 11.2.2. Automotive
- 11.2.3. Electronics
- 11.2.4. Oil and Gas
- 11.2.5. Other End-user Industries
- 11.1. Market Analysis, Insights and Forecast - by Application
- 12. North America Industrial CT Scanning Industry Analysis, Insights and Forecast, 2019-2031
- 12.1. Market Analysis, Insights and Forecast - By Country/Sub-region
- 12.1.1 United States
- 12.1.2 Canada
- 12.1.3 Mexico
- 13. Europe Industrial CT Scanning Industry Analysis, Insights and Forecast, 2019-2031
- 13.1. Market Analysis, Insights and Forecast - By Country/Sub-region
- 13.1.1 Germany
- 13.1.2 United Kingdom
- 13.1.3 France
- 13.1.4 Spain
- 13.1.5 Italy
- 13.1.6 Spain
- 13.1.7 Belgium
- 13.1.8 Netherland
- 13.1.9 Nordics
- 13.1.10 Rest of Europe
- 14. Asia Pacific Industrial CT Scanning Industry Analysis, Insights and Forecast, 2019-2031
- 14.1. Market Analysis, Insights and Forecast - By Country/Sub-region
- 14.1.1 China
- 14.1.2 Japan
- 14.1.3 India
- 14.1.4 South Korea
- 14.1.5 Southeast Asia
- 14.1.6 Australia
- 14.1.7 Indonesia
- 14.1.8 Phillipes
- 14.1.9 Singapore
- 14.1.10 Thailandc
- 14.1.11 Rest of Asia Pacific
- 15. South America Industrial CT Scanning Industry Analysis, Insights and Forecast, 2019-2031
- 15.1. Market Analysis, Insights and Forecast - By Country/Sub-region
- 15.1.1 Brazil
- 15.1.2 Argentina
- 15.1.3 Peru
- 15.1.4 Chile
- 15.1.5 Colombia
- 15.1.6 Ecuador
- 15.1.7 Venezuela
- 15.1.8 Rest of South America
- 16. North America Industrial CT Scanning Industry Analysis, Insights and Forecast, 2019-2031
- 16.1. Market Analysis, Insights and Forecast - By Country/Sub-region
- 16.1.1 United States
- 16.1.2 Canada
- 16.1.3 Mexico
- 17. MEA Industrial CT Scanning Industry Analysis, Insights and Forecast, 2019-2031
- 17.1. Market Analysis, Insights and Forecast - By Country/Sub-region
- 17.1.1 United Arab Emirates
- 17.1.2 Saudi Arabia
- 17.1.3 South Africa
- 17.1.4 Rest of Middle East and Africa
- 18. Competitive Analysis
- 18.1. Global Market Share Analysis 2024
- 18.2. Company Profiles
- 18.2.1 Comet Group Limited
- 18.2.1.1. Overview
- 18.2.1.2. Products
- 18.2.1.3. SWOT Analysis
- 18.2.1.4. Recent Developments
- 18.2.1.5. Financials (Based on Availability)
- 18.2.2 Nikon Corporation
- 18.2.2.1. Overview
- 18.2.2.2. Products
- 18.2.2.3. SWOT Analysis
- 18.2.2.4. Recent Developments
- 18.2.2.5. Financials (Based on Availability)
- 18.2.3 Thermo Fisher Scientific Inc
- 18.2.3.1. Overview
- 18.2.3.2. Products
- 18.2.3.3. SWOT Analysis
- 18.2.3.4. Recent Developments
- 18.2.3.5. Financials (Based on Availability)
- 18.2.4 Hitachi Ltd
- 18.2.4.1. Overview
- 18.2.4.2. Products
- 18.2.4.3. SWOT Analysis
- 18.2.4.4. Recent Developments
- 18.2.4.5. Financials (Based on Availability)
- 18.2.5 3DX-Ray Limited
- 18.2.5.1. Overview
- 18.2.5.2. Products
- 18.2.5.3. SWOT Analysis
- 18.2.5.4. Recent Developments
- 18.2.5.5. Financials (Based on Availability)
- 18.2.6 Zeiss International
- 18.2.6.1. Overview
- 18.2.6.2. Products
- 18.2.6.3. SWOT Analysis
- 18.2.6.4. Recent Developments
- 18.2.6.5. Financials (Based on Availability)
- 18.2.7 Omron Corporation
- 18.2.7.1. Overview
- 18.2.7.2. Products
- 18.2.7.3. SWOT Analysis
- 18.2.7.4. Recent Developments
- 18.2.7.5. Financials (Based on Availability)
- 18.2.8 Waygate Technologies
- 18.2.8.1. Overview
- 18.2.8.2. Products
- 18.2.8.3. SWOT Analysis
- 18.2.8.4. Recent Developments
- 18.2.8.5. Financials (Based on Availability)
- 18.2.9 Bruker Corporation
- 18.2.9.1. Overview
- 18.2.9.2. Products
- 18.2.9.3. SWOT Analysis
- 18.2.9.4. Recent Developments
- 18.2.9.5. Financials (Based on Availability)
- 18.2.10 Shimadzu Corporation
- 18.2.10.1. Overview
- 18.2.10.2. Products
- 18.2.10.3. SWOT Analysis
- 18.2.10.4. Recent Developments
- 18.2.10.5. Financials (Based on Availability)
- 18.2.1 Comet Group Limited
List of Figures
- Figure 1: Global Industrial CT Scanning Industry Revenue Breakdown (Million, %) by Region 2024 & 2032
- Figure 2: Global Industrial CT Scanning Industry Volume Breakdown (K Unit, %) by Region 2024 & 2032
- Figure 3: North America Industrial CT Scanning Industry Revenue (Million), by Country 2024 & 2032
- Figure 4: North America Industrial CT Scanning Industry Volume (K Unit), by Country 2024 & 2032
- Figure 5: North America Industrial CT Scanning Industry Revenue Share (%), by Country 2024 & 2032
- Figure 6: North America Industrial CT Scanning Industry Volume Share (%), by Country 2024 & 2032
- Figure 7: Europe Industrial CT Scanning Industry Revenue (Million), by Country 2024 & 2032
- Figure 8: Europe Industrial CT Scanning Industry Volume (K Unit), by Country 2024 & 2032
- Figure 9: Europe Industrial CT Scanning Industry Revenue Share (%), by Country 2024 & 2032
- Figure 10: Europe Industrial CT Scanning Industry Volume Share (%), by Country 2024 & 2032
- Figure 11: Asia Pacific Industrial CT Scanning Industry Revenue (Million), by Country 2024 & 2032
- Figure 12: Asia Pacific Industrial CT Scanning Industry Volume (K Unit), by Country 2024 & 2032
- Figure 13: Asia Pacific Industrial CT Scanning Industry Revenue Share (%), by Country 2024 & 2032
- Figure 14: Asia Pacific Industrial CT Scanning Industry Volume Share (%), by Country 2024 & 2032
- Figure 15: South America Industrial CT Scanning Industry Revenue (Million), by Country 2024 & 2032
- Figure 16: South America Industrial CT Scanning Industry Volume (K Unit), by Country 2024 & 2032
- Figure 17: South America Industrial CT Scanning Industry Revenue Share (%), by Country 2024 & 2032
- Figure 18: South America Industrial CT Scanning Industry Volume Share (%), by Country 2024 & 2032
- Figure 19: North America Industrial CT Scanning Industry Revenue (Million), by Country 2024 & 2032
- Figure 20: North America Industrial CT Scanning Industry Volume (K Unit), by Country 2024 & 2032
- Figure 21: North America Industrial CT Scanning Industry Revenue Share (%), by Country 2024 & 2032
- Figure 22: North America Industrial CT Scanning Industry Volume Share (%), by Country 2024 & 2032
- Figure 23: MEA Industrial CT Scanning Industry Revenue (Million), by Country 2024 & 2032
- Figure 24: MEA Industrial CT Scanning Industry Volume (K Unit), by Country 2024 & 2032
- Figure 25: MEA Industrial CT Scanning Industry Revenue Share (%), by Country 2024 & 2032
- Figure 26: MEA Industrial CT Scanning Industry Volume Share (%), by Country 2024 & 2032
- Figure 27: North America Industrial CT Scanning Industry Revenue (Million), by Application 2024 & 2032
- Figure 28: North America Industrial CT Scanning Industry Volume (K Unit), by Application 2024 & 2032
- Figure 29: North America Industrial CT Scanning Industry Revenue Share (%), by Application 2024 & 2032
- Figure 30: North America Industrial CT Scanning Industry Volume Share (%), by Application 2024 & 2032
- Figure 31: North America Industrial CT Scanning Industry Revenue (Million), by End-user Industry 2024 & 2032
- Figure 32: North America Industrial CT Scanning Industry Volume (K Unit), by End-user Industry 2024 & 2032
- Figure 33: North America Industrial CT Scanning Industry Revenue Share (%), by End-user Industry 2024 & 2032
- Figure 34: North America Industrial CT Scanning Industry Volume Share (%), by End-user Industry 2024 & 2032
- Figure 35: North America Industrial CT Scanning Industry Revenue (Million), by Country 2024 & 2032
- Figure 36: North America Industrial CT Scanning Industry Volume (K Unit), by Country 2024 & 2032
- Figure 37: North America Industrial CT Scanning Industry Revenue Share (%), by Country 2024 & 2032
- Figure 38: North America Industrial CT Scanning Industry Volume Share (%), by Country 2024 & 2032
- Figure 39: Europe Industrial CT Scanning Industry Revenue (Million), by Application 2024 & 2032
- Figure 40: Europe Industrial CT Scanning Industry Volume (K Unit), by Application 2024 & 2032
- Figure 41: Europe Industrial CT Scanning Industry Revenue Share (%), by Application 2024 & 2032
- Figure 42: Europe Industrial CT Scanning Industry Volume Share (%), by Application 2024 & 2032
- Figure 43: Europe Industrial CT Scanning Industry Revenue (Million), by End-user Industry 2024 & 2032
- Figure 44: Europe Industrial CT Scanning Industry Volume (K Unit), by End-user Industry 2024 & 2032
- Figure 45: Europe Industrial CT Scanning Industry Revenue Share (%), by End-user Industry 2024 & 2032
- Figure 46: Europe Industrial CT Scanning Industry Volume Share (%), by End-user Industry 2024 & 2032
- Figure 47: Europe Industrial CT Scanning Industry Revenue (Million), by Country 2024 & 2032
- Figure 48: Europe Industrial CT Scanning Industry Volume (K Unit), by Country 2024 & 2032
- Figure 49: Europe Industrial CT Scanning Industry Revenue Share (%), by Country 2024 & 2032
- Figure 50: Europe Industrial CT Scanning Industry Volume Share (%), by Country 2024 & 2032
- Figure 51: Asia Industrial CT Scanning Industry Revenue (Million), by Application 2024 & 2032
- Figure 52: Asia Industrial CT Scanning Industry Volume (K Unit), by Application 2024 & 2032
- Figure 53: Asia Industrial CT Scanning Industry Revenue Share (%), by Application 2024 & 2032
- Figure 54: Asia Industrial CT Scanning Industry Volume Share (%), by Application 2024 & 2032
- Figure 55: Asia Industrial CT Scanning Industry Revenue (Million), by End-user Industry 2024 & 2032
- Figure 56: Asia Industrial CT Scanning Industry Volume (K Unit), by End-user Industry 2024 & 2032
- Figure 57: Asia Industrial CT Scanning Industry Revenue Share (%), by End-user Industry 2024 & 2032
- Figure 58: Asia Industrial CT Scanning Industry Volume Share (%), by End-user Industry 2024 & 2032
- Figure 59: Asia Industrial CT Scanning Industry Revenue (Million), by Country 2024 & 2032
- Figure 60: Asia Industrial CT Scanning Industry Volume (K Unit), by Country 2024 & 2032
- Figure 61: Asia Industrial CT Scanning Industry Revenue Share (%), by Country 2024 & 2032
- Figure 62: Asia Industrial CT Scanning Industry Volume Share (%), by Country 2024 & 2032
- Figure 63: Australia and New Zealand Industrial CT Scanning Industry Revenue (Million), by Application 2024 & 2032
- Figure 64: Australia and New Zealand Industrial CT Scanning Industry Volume (K Unit), by Application 2024 & 2032
- Figure 65: Australia and New Zealand Industrial CT Scanning Industry Revenue Share (%), by Application 2024 & 2032
- Figure 66: Australia and New Zealand Industrial CT Scanning Industry Volume Share (%), by Application 2024 & 2032
- Figure 67: Australia and New Zealand Industrial CT Scanning Industry Revenue (Million), by End-user Industry 2024 & 2032
- Figure 68: Australia and New Zealand Industrial CT Scanning Industry Volume (K Unit), by End-user Industry 2024 & 2032
- Figure 69: Australia and New Zealand Industrial CT Scanning Industry Revenue Share (%), by End-user Industry 2024 & 2032
- Figure 70: Australia and New Zealand Industrial CT Scanning Industry Volume Share (%), by End-user Industry 2024 & 2032
- Figure 71: Australia and New Zealand Industrial CT Scanning Industry Revenue (Million), by Country 2024 & 2032
- Figure 72: Australia and New Zealand Industrial CT Scanning Industry Volume (K Unit), by Country 2024 & 2032
- Figure 73: Australia and New Zealand Industrial CT Scanning Industry Revenue Share (%), by Country 2024 & 2032
- Figure 74: Australia and New Zealand Industrial CT Scanning Industry Volume Share (%), by Country 2024 & 2032
- Figure 75: Latin America Industrial CT Scanning Industry Revenue (Million), by Application 2024 & 2032
- Figure 76: Latin America Industrial CT Scanning Industry Volume (K Unit), by Application 2024 & 2032
- Figure 77: Latin America Industrial CT Scanning Industry Revenue Share (%), by Application 2024 & 2032
- Figure 78: Latin America Industrial CT Scanning Industry Volume Share (%), by Application 2024 & 2032
- Figure 79: Latin America Industrial CT Scanning Industry Revenue (Million), by End-user Industry 2024 & 2032
- Figure 80: Latin America Industrial CT Scanning Industry Volume (K Unit), by End-user Industry 2024 & 2032
- Figure 81: Latin America Industrial CT Scanning Industry Revenue Share (%), by End-user Industry 2024 & 2032
- Figure 82: Latin America Industrial CT Scanning Industry Volume Share (%), by End-user Industry 2024 & 2032
- Figure 83: Latin America Industrial CT Scanning Industry Revenue (Million), by Country 2024 & 2032
- Figure 84: Latin America Industrial CT Scanning Industry Volume (K Unit), by Country 2024 & 2032
- Figure 85: Latin America Industrial CT Scanning Industry Revenue Share (%), by Country 2024 & 2032
- Figure 86: Latin America Industrial CT Scanning Industry Volume Share (%), by Country 2024 & 2032
- Figure 87: Middle East and Africa Industrial CT Scanning Industry Revenue (Million), by Application 2024 & 2032
- Figure 88: Middle East and Africa Industrial CT Scanning Industry Volume (K Unit), by Application 2024 & 2032
- Figure 89: Middle East and Africa Industrial CT Scanning Industry Revenue Share (%), by Application 2024 & 2032
- Figure 90: Middle East and Africa Industrial CT Scanning Industry Volume Share (%), by Application 2024 & 2032
- Figure 91: Middle East and Africa Industrial CT Scanning Industry Revenue (Million), by End-user Industry 2024 & 2032
- Figure 92: Middle East and Africa Industrial CT Scanning Industry Volume (K Unit), by End-user Industry 2024 & 2032
- Figure 93: Middle East and Africa Industrial CT Scanning Industry Revenue Share (%), by End-user Industry 2024 & 2032
- Figure 94: Middle East and Africa Industrial CT Scanning Industry Volume Share (%), by End-user Industry 2024 & 2032
- Figure 95: Middle East and Africa Industrial CT Scanning Industry Revenue (Million), by Country 2024 & 2032
- Figure 96: Middle East and Africa Industrial CT Scanning Industry Volume (K Unit), by Country 2024 & 2032
- Figure 97: Middle East and Africa Industrial CT Scanning Industry Revenue Share (%), by Country 2024 & 2032
- Figure 98: Middle East and Africa Industrial CT Scanning Industry Volume Share (%), by Country 2024 & 2032
List of Tables
- Table 1: Global Industrial CT Scanning Industry Revenue Million Forecast, by Region 2019 & 2032
- Table 2: Global Industrial CT Scanning Industry Volume K Unit Forecast, by Region 2019 & 2032
- Table 3: Global Industrial CT Scanning Industry Revenue Million Forecast, by Application 2019 & 2032
- Table 4: Global Industrial CT Scanning Industry Volume K Unit Forecast, by Application 2019 & 2032
- Table 5: Global Industrial CT Scanning Industry Revenue Million Forecast, by End-user Industry 2019 & 2032
- Table 6: Global Industrial CT Scanning Industry Volume K Unit Forecast, by End-user Industry 2019 & 2032
- Table 7: Global Industrial CT Scanning Industry Revenue Million Forecast, by Region 2019 & 2032
- Table 8: Global Industrial CT Scanning Industry Volume K Unit Forecast, by Region 2019 & 2032
- Table 9: Global Industrial CT Scanning Industry Revenue Million Forecast, by Country 2019 & 2032
- Table 10: Global Industrial CT Scanning Industry Volume K Unit Forecast, by Country 2019 & 2032
- Table 11: United States Industrial CT Scanning Industry Revenue (Million) Forecast, by Application 2019 & 2032
- Table 12: United States Industrial CT Scanning Industry Volume (K Unit) Forecast, by Application 2019 & 2032
- Table 13: Canada Industrial CT Scanning Industry Revenue (Million) Forecast, by Application 2019 & 2032
- Table 14: Canada Industrial CT Scanning Industry Volume (K Unit) Forecast, by Application 2019 & 2032
- Table 15: Mexico Industrial CT Scanning Industry Revenue (Million) Forecast, by Application 2019 & 2032
- Table 16: Mexico Industrial CT Scanning Industry Volume (K Unit) Forecast, by Application 2019 & 2032
- Table 17: Global Industrial CT Scanning Industry Revenue Million Forecast, by Country 2019 & 2032
- Table 18: Global Industrial CT Scanning Industry Volume K Unit Forecast, by Country 2019 & 2032
- Table 19: Germany Industrial CT Scanning Industry Revenue (Million) Forecast, by Application 2019 & 2032
- Table 20: Germany Industrial CT Scanning Industry Volume (K Unit) Forecast, by Application 2019 & 2032
- Table 21: United Kingdom Industrial CT Scanning Industry Revenue (Million) Forecast, by Application 2019 & 2032
- Table 22: United Kingdom Industrial CT Scanning Industry Volume (K Unit) Forecast, by Application 2019 & 2032
- Table 23: France Industrial CT Scanning Industry Revenue (Million) Forecast, by Application 2019 & 2032
- Table 24: France Industrial CT Scanning Industry Volume (K Unit) Forecast, by Application 2019 & 2032
- Table 25: Spain Industrial CT Scanning Industry Revenue (Million) Forecast, by Application 2019 & 2032
- Table 26: Spain Industrial CT Scanning Industry Volume (K Unit) Forecast, by Application 2019 & 2032
- Table 27: Italy Industrial CT Scanning Industry Revenue (Million) Forecast, by Application 2019 & 2032
- Table 28: Italy Industrial CT Scanning Industry Volume (K Unit) Forecast, by Application 2019 & 2032
- Table 29: Spain Industrial CT Scanning Industry Revenue (Million) Forecast, by Application 2019 & 2032
- Table 30: Spain Industrial CT Scanning Industry Volume (K Unit) Forecast, by Application 2019 & 2032
- Table 31: Belgium Industrial CT Scanning Industry Revenue (Million) Forecast, by Application 2019 & 2032
- Table 32: Belgium Industrial CT Scanning Industry Volume (K Unit) Forecast, by Application 2019 & 2032
- Table 33: Netherland Industrial CT Scanning Industry Revenue (Million) Forecast, by Application 2019 & 2032
- Table 34: Netherland Industrial CT Scanning Industry Volume (K Unit) Forecast, by Application 2019 & 2032
- Table 35: Nordics Industrial CT Scanning Industry Revenue (Million) Forecast, by Application 2019 & 2032
- Table 36: Nordics Industrial CT Scanning Industry Volume (K Unit) Forecast, by Application 2019 & 2032
- Table 37: Rest of Europe Industrial CT Scanning Industry Revenue (Million) Forecast, by Application 2019 & 2032
- Table 38: Rest of Europe Industrial CT Scanning Industry Volume (K Unit) Forecast, by Application 2019 & 2032
- Table 39: Global Industrial CT Scanning Industry Revenue Million Forecast, by Country 2019 & 2032
- Table 40: Global Industrial CT Scanning Industry Volume K Unit Forecast, by Country 2019 & 2032
- Table 41: China Industrial CT Scanning Industry Revenue (Million) Forecast, by Application 2019 & 2032
- Table 42: China Industrial CT Scanning Industry Volume (K Unit) Forecast, by Application 2019 & 2032
- Table 43: Japan Industrial CT Scanning Industry Revenue (Million) Forecast, by Application 2019 & 2032
- Table 44: Japan Industrial CT Scanning Industry Volume (K Unit) Forecast, by Application 2019 & 2032
- Table 45: India Industrial CT Scanning Industry Revenue (Million) Forecast, by Application 2019 & 2032
- Table 46: India Industrial CT Scanning Industry Volume (K Unit) Forecast, by Application 2019 & 2032
- Table 47: South Korea Industrial CT Scanning Industry Revenue (Million) Forecast, by Application 2019 & 2032
- Table 48: South Korea Industrial CT Scanning Industry Volume (K Unit) Forecast, by Application 2019 & 2032
- Table 49: Southeast Asia Industrial CT Scanning Industry Revenue (Million) Forecast, by Application 2019 & 2032
- Table 50: Southeast Asia Industrial CT Scanning Industry Volume (K Unit) Forecast, by Application 2019 & 2032
- Table 51: Australia Industrial CT Scanning Industry Revenue (Million) Forecast, by Application 2019 & 2032
- Table 52: Australia Industrial CT Scanning Industry Volume (K Unit) Forecast, by Application 2019 & 2032
- Table 53: Indonesia Industrial CT Scanning Industry Revenue (Million) Forecast, by Application 2019 & 2032
- Table 54: Indonesia Industrial CT Scanning Industry Volume (K Unit) Forecast, by Application 2019 & 2032
- Table 55: Phillipes Industrial CT Scanning Industry Revenue (Million) Forecast, by Application 2019 & 2032
- Table 56: Phillipes Industrial CT Scanning Industry Volume (K Unit) Forecast, by Application 2019 & 2032
- Table 57: Singapore Industrial CT Scanning Industry Revenue (Million) Forecast, by Application 2019 & 2032
- Table 58: Singapore Industrial CT Scanning Industry Volume (K Unit) Forecast, by Application 2019 & 2032
- Table 59: Thailandc Industrial CT Scanning Industry Revenue (Million) Forecast, by Application 2019 & 2032
- Table 60: Thailandc Industrial CT Scanning Industry Volume (K Unit) Forecast, by Application 2019 & 2032
- Table 61: Rest of Asia Pacific Industrial CT Scanning Industry Revenue (Million) Forecast, by Application 2019 & 2032
- Table 62: Rest of Asia Pacific Industrial CT Scanning Industry Volume (K Unit) Forecast, by Application 2019 & 2032
- Table 63: Global Industrial CT Scanning Industry Revenue Million Forecast, by Country 2019 & 2032
- Table 64: Global Industrial CT Scanning Industry Volume K Unit Forecast, by Country 2019 & 2032
- Table 65: Brazil Industrial CT Scanning Industry Revenue (Million) Forecast, by Application 2019 & 2032
- Table 66: Brazil Industrial CT Scanning Industry Volume (K Unit) Forecast, by Application 2019 & 2032
- Table 67: Argentina Industrial CT Scanning Industry Revenue (Million) Forecast, by Application 2019 & 2032
- Table 68: Argentina Industrial CT Scanning Industry Volume (K Unit) Forecast, by Application 2019 & 2032
- Table 69: Peru Industrial CT Scanning Industry Revenue (Million) Forecast, by Application 2019 & 2032
- Table 70: Peru Industrial CT Scanning Industry Volume (K Unit) Forecast, by Application 2019 & 2032
- Table 71: Chile Industrial CT Scanning Industry Revenue (Million) Forecast, by Application 2019 & 2032
- Table 72: Chile Industrial CT Scanning Industry Volume (K Unit) Forecast, by Application 2019 & 2032
- Table 73: Colombia Industrial CT Scanning Industry Revenue (Million) Forecast, by Application 2019 & 2032
- Table 74: Colombia Industrial CT Scanning Industry Volume (K Unit) Forecast, by Application 2019 & 2032
- Table 75: Ecuador Industrial CT Scanning Industry Revenue (Million) Forecast, by Application 2019 & 2032
- Table 76: Ecuador Industrial CT Scanning Industry Volume (K Unit) Forecast, by Application 2019 & 2032
- Table 77: Venezuela Industrial CT Scanning Industry Revenue (Million) Forecast, by Application 2019 & 2032
- Table 78: Venezuela Industrial CT Scanning Industry Volume (K Unit) Forecast, by Application 2019 & 2032
- Table 79: Rest of South America Industrial CT Scanning Industry Revenue (Million) Forecast, by Application 2019 & 2032
- Table 80: Rest of South America Industrial CT Scanning Industry Volume (K Unit) Forecast, by Application 2019 & 2032
- Table 81: Global Industrial CT Scanning Industry Revenue Million Forecast, by Country 2019 & 2032
- Table 82: Global Industrial CT Scanning Industry Volume K Unit Forecast, by Country 2019 & 2032
- Table 83: United States Industrial CT Scanning Industry Revenue (Million) Forecast, by Application 2019 & 2032
- Table 84: United States Industrial CT Scanning Industry Volume (K Unit) Forecast, by Application 2019 & 2032
- Table 85: Canada Industrial CT Scanning Industry Revenue (Million) Forecast, by Application 2019 & 2032
- Table 86: Canada Industrial CT Scanning Industry Volume (K Unit) Forecast, by Application 2019 & 2032
- Table 87: Mexico Industrial CT Scanning Industry Revenue (Million) Forecast, by Application 2019 & 2032
- Table 88: Mexico Industrial CT Scanning Industry Volume (K Unit) Forecast, by Application 2019 & 2032
- Table 89: Global Industrial CT Scanning Industry Revenue Million Forecast, by Country 2019 & 2032
- Table 90: Global Industrial CT Scanning Industry Volume K Unit Forecast, by Country 2019 & 2032
- Table 91: United Arab Emirates Industrial CT Scanning Industry Revenue (Million) Forecast, by Application 2019 & 2032
- Table 92: United Arab Emirates Industrial CT Scanning Industry Volume (K Unit) Forecast, by Application 2019 & 2032
- Table 93: Saudi Arabia Industrial CT Scanning Industry Revenue (Million) Forecast, by Application 2019 & 2032
- Table 94: Saudi Arabia Industrial CT Scanning Industry Volume (K Unit) Forecast, by Application 2019 & 2032
- Table 95: South Africa Industrial CT Scanning Industry Revenue (Million) Forecast, by Application 2019 & 2032
- Table 96: South Africa Industrial CT Scanning Industry Volume (K Unit) Forecast, by Application 2019 & 2032
- Table 97: Rest of Middle East and Africa Industrial CT Scanning Industry Revenue (Million) Forecast, by Application 2019 & 2032
- Table 98: Rest of Middle East and Africa Industrial CT Scanning Industry Volume (K Unit) Forecast, by Application 2019 & 2032
- Table 99: Global Industrial CT Scanning Industry Revenue Million Forecast, by Application 2019 & 2032
- Table 100: Global Industrial CT Scanning Industry Volume K Unit Forecast, by Application 2019 & 2032
- Table 101: Global Industrial CT Scanning Industry Revenue Million Forecast, by End-user Industry 2019 & 2032
- Table 102: Global Industrial CT Scanning Industry Volume K Unit Forecast, by End-user Industry 2019 & 2032
- Table 103: Global Industrial CT Scanning Industry Revenue Million Forecast, by Country 2019 & 2032
- Table 104: Global Industrial CT Scanning Industry Volume K Unit Forecast, by Country 2019 & 2032
- Table 105: Global Industrial CT Scanning Industry Revenue Million Forecast, by Application 2019 & 2032
- Table 106: Global Industrial CT Scanning Industry Volume K Unit Forecast, by Application 2019 & 2032
- Table 107: Global Industrial CT Scanning Industry Revenue Million Forecast, by End-user Industry 2019 & 2032
- Table 108: Global Industrial CT Scanning Industry Volume K Unit Forecast, by End-user Industry 2019 & 2032
- Table 109: Global Industrial CT Scanning Industry Revenue Million Forecast, by Country 2019 & 2032
- Table 110: Global Industrial CT Scanning Industry Volume K Unit Forecast, by Country 2019 & 2032
- Table 111: Global Industrial CT Scanning Industry Revenue Million Forecast, by Application 2019 & 2032
- Table 112: Global Industrial CT Scanning Industry Volume K Unit Forecast, by Application 2019 & 2032
- Table 113: Global Industrial CT Scanning Industry Revenue Million Forecast, by End-user Industry 2019 & 2032
- Table 114: Global Industrial CT Scanning Industry Volume K Unit Forecast, by End-user Industry 2019 & 2032
- Table 115: Global Industrial CT Scanning Industry Revenue Million Forecast, by Country 2019 & 2032
- Table 116: Global Industrial CT Scanning Industry Volume K Unit Forecast, by Country 2019 & 2032
- Table 117: Global Industrial CT Scanning Industry Revenue Million Forecast, by Application 2019 & 2032
- Table 118: Global Industrial CT Scanning Industry Volume K Unit Forecast, by Application 2019 & 2032
- Table 119: Global Industrial CT Scanning Industry Revenue Million Forecast, by End-user Industry 2019 & 2032
- Table 120: Global Industrial CT Scanning Industry Volume K Unit Forecast, by End-user Industry 2019 & 2032
- Table 121: Global Industrial CT Scanning Industry Revenue Million Forecast, by Country 2019 & 2032
- Table 122: Global Industrial CT Scanning Industry Volume K Unit Forecast, by Country 2019 & 2032
- Table 123: Global Industrial CT Scanning Industry Revenue Million Forecast, by Application 2019 & 2032
- Table 124: Global Industrial CT Scanning Industry Volume K Unit Forecast, by Application 2019 & 2032
- Table 125: Global Industrial CT Scanning Industry Revenue Million Forecast, by End-user Industry 2019 & 2032
- Table 126: Global Industrial CT Scanning Industry Volume K Unit Forecast, by End-user Industry 2019 & 2032
- Table 127: Global Industrial CT Scanning Industry Revenue Million Forecast, by Country 2019 & 2032
- Table 128: Global Industrial CT Scanning Industry Volume K Unit Forecast, by Country 2019 & 2032
- Table 129: Global Industrial CT Scanning Industry Revenue Million Forecast, by Application 2019 & 2032
- Table 130: Global Industrial CT Scanning Industry Volume K Unit Forecast, by Application 2019 & 2032
- Table 131: Global Industrial CT Scanning Industry Revenue Million Forecast, by End-user Industry 2019 & 2032
- Table 132: Global Industrial CT Scanning Industry Volume K Unit Forecast, by End-user Industry 2019 & 2032
- Table 133: Global Industrial CT Scanning Industry Revenue Million Forecast, by Country 2019 & 2032
- Table 134: Global Industrial CT Scanning Industry Volume K Unit Forecast, by Country 2019 & 2032
Frequently Asked Questions
1. What is the projected Compound Annual Growth Rate (CAGR) of the Industrial CT Scanning Industry?
The projected CAGR is approximately 9.03%.
2. Which companies are prominent players in the Industrial CT Scanning Industry?
Key companies in the market include Comet Group Limited, Nikon Corporation, Thermo Fisher Scientific Inc, Hitachi Ltd, 3DX-Ray Limited, Zeiss International, Omron Corporation, Waygate Technologies, Bruker Corporation, Shimadzu Corporation.
3. What are the main segments of the Industrial CT Scanning Industry?
The market segments include Application, End-user Industry.
4. Can you provide details about the market size?
The market size is estimated to be USD 502.00 Million as of 2022.
5. What are some drivers contributing to market growth?
Technology Improvements in Resolution and Image Processing; Intensifying Demand for Portable Radiography Equipment.
6. What are the notable trends driving market growth?
Aerospace Industry to Drive the Industrial Computed Tomography Market.
7. Are there any restraints impacting market growth?
High Acquisition and Maintenace Cost of Industrial CT systems.
8. Can you provide examples of recent developments in the market?
March 2021 - ZEISS introduced ZEISS Xradia CrystalCT micro-computed tomography (microCT) system to enable 3D crystallographic imaging of polycrystalline materials for a wide range of metal and alloy, additive manufacturing, ceramic, and pharmaceutical samples in industrial and academic laboratories.
9. What pricing options are available for accessing the report?
Pricing options include single-user, multi-user, and enterprise licenses priced at USD 4750, USD 5250, and USD 8750 respectively.
10. Is the market size provided in terms of value or volume?
The market size is provided in terms of value, measured in Million and volume, measured in K Unit.
11. Are there any specific market keywords associated with the report?
Yes, the market keyword associated with the report is "Industrial CT Scanning Industry," which aids in identifying and referencing the specific market segment covered.
12. How do I determine which pricing option suits my needs best?
The pricing options vary based on user requirements and access needs. Individual users may opt for single-user licenses, while businesses requiring broader access may choose multi-user or enterprise licenses for cost-effective access to the report.
13. Are there any additional resources or data provided in the Industrial CT Scanning Industry report?
While the report offers comprehensive insights, it's advisable to review the specific contents or supplementary materials provided to ascertain if additional resources or data are available.
14. How can I stay updated on further developments or reports in the Industrial CT Scanning Industry?
To stay informed about further developments, trends, and reports in the Industrial CT Scanning Industry, consider subscribing to industry newsletters, following relevant companies and organizations, or regularly checking reputable industry news sources and publications.
Methodology
Step 1 - Identification of Relevant Samples Size from Population Database


Step 2 - Approaches for Defining Global Market Size (Value, Volume* & Price*)

Note*: In applicable scenarios
Step 3 - Data Sources
Primary Research
- Web Analytics
- Survey Reports
- Research Institute
- Latest Research Reports
- Opinion Leaders
Secondary Research
- Annual Reports
- White Paper
- Latest Press Release
- Industry Association
- Paid Database
- Investor Presentations

Step 4 - Data Triangulation
Involves using different sources of information in order to increase the validity of a study
These sources are likely to be stakeholders in a program - participants, other researchers, program staff, other community members, and so on.
Then we put all data in single framework & apply various statistical tools to find out the dynamic on the market.
During the analysis stage, feedback from the stakeholder groups would be compared to determine areas of agreement as well as areas of divergence


