
Key Insights
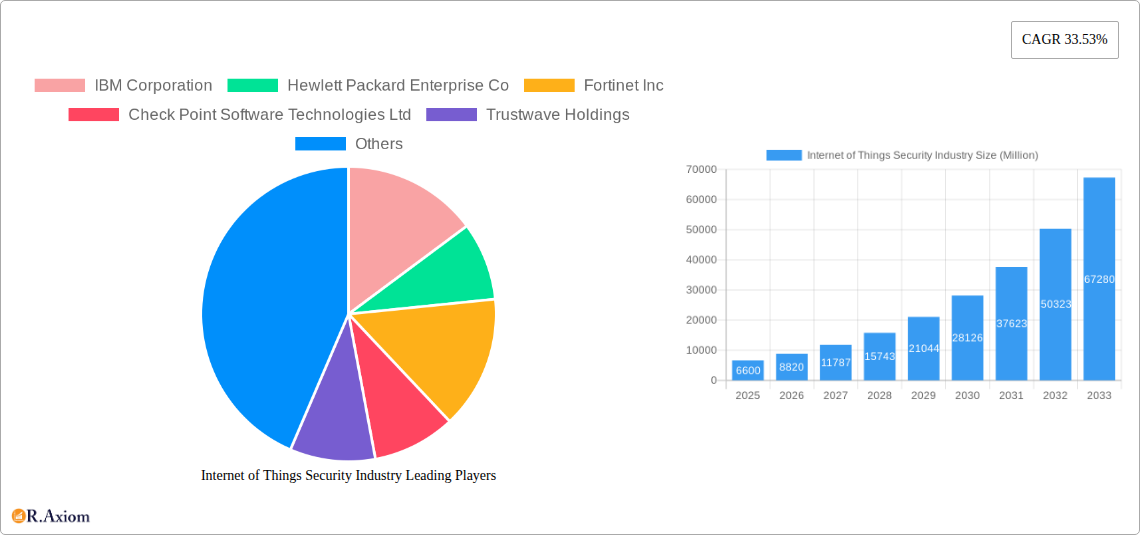
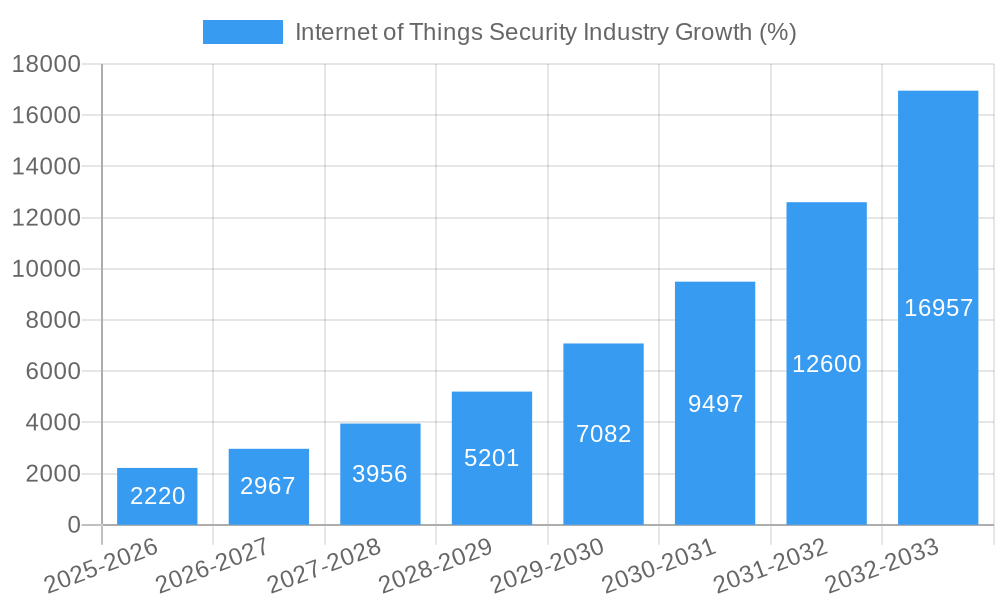
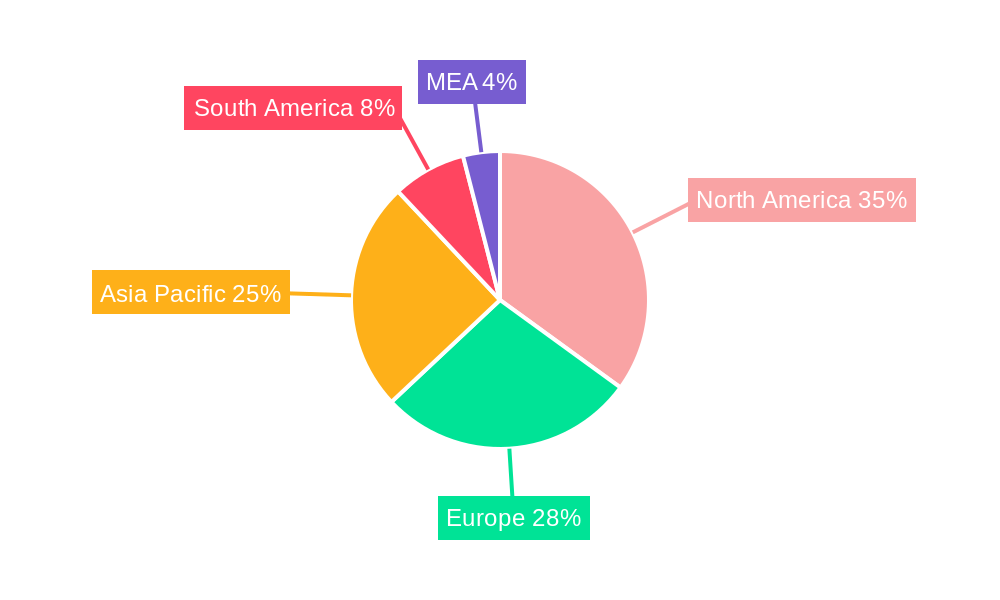
The Internet of Things (IoT) security market is experiencing explosive growth, projected to reach a substantial size driven by the escalating adoption of IoT devices across diverse sectors. The Compound Annual Growth Rate (CAGR) of 33.53% from 2019 to 2024 indicates a rapidly expanding market. This growth is fueled by several key factors. The increasing reliance on interconnected devices in critical infrastructure (energy, healthcare, manufacturing) necessitates robust security measures to prevent data breaches and operational disruptions. Furthermore, the proliferation of smart homes, wearables, and connected vehicles is creating a massive ecosystem vulnerable to cyber threats, driving demand for sophisticated security solutions. Government regulations mandating data protection and cybersecurity compliance in various industries further stimulate market expansion. The market is segmented by security type (network, endpoint), solution (software, services), and end-user industry, reflecting the diverse applications of IoT security technologies. Software solutions are currently dominant, offering scalable and cost-effective protection. However, the services segment, encompassing managed security services and professional consulting, is experiencing strong growth as businesses seek expert assistance in navigating the complexities of IoT security. North America and Europe currently hold significant market share due to early adoption and advanced technological infrastructure, but the Asia-Pacific region is poised for rapid growth driven by increasing digitalization and government initiatives. Competition is intense among established players like IBM, Cisco, and Fortinet, alongside emerging specialized security firms. The market's future trajectory will depend on factors such as the pace of IoT adoption, the evolution of cyber threats, and the development of more sophisticated and integrated security solutions.
The competitive landscape is dynamic, with established players continuously innovating and new entrants emerging. Strategic partnerships and acquisitions are common, reflecting the efforts of companies to expand their product portfolios and market reach. The demand for skilled cybersecurity professionals is also on the rise, leading to a need for investment in training and education. Challenges remain, including the heterogeneity of IoT devices, the difficulties of securing legacy systems, and the ever-evolving nature of cyber threats. However, the overall outlook for the IoT security market remains highly positive, with significant growth opportunities across all segments and regions. Effective strategies for market players include focusing on developing innovative solutions addressing specific industry needs, strengthening partnerships to leverage complementary technologies, and investing in research and development to stay ahead of the evolving threat landscape. The market's maturation will likely see a shift towards more integrated and AI-powered security solutions that can effectively manage the increasing complexity and scale of IoT deployments.
This comprehensive report provides a detailed analysis of the Internet of Things (IoT) security market, offering invaluable insights for industry stakeholders, investors, and businesses seeking to navigate this rapidly evolving landscape. The report covers the period from 2019 to 2033, with a focus on 2025 as the base and estimated year. The market is segmented by type of security (network security, endpoint security), solution (software, services), and end-user industry (automotive, healthcare, government, manufacturing, energy & power, retail, BFSI, others). Key players analyzed include IBM Corporation, Hewlett Packard Enterprise Co, Fortinet Inc, Check Point Software Technologies Ltd, Trustwave Holdings, Cisco Systems Inc, Thales Group (Gemalto NV), Palo Alto Networks Inc, Broadcom Inc (Symantec Corporation), AT&T Inc, and Intel Corporation. The report projects a market value exceeding xx Million by 2033.
Internet of Things Security Industry Market Concentration & Innovation
The IoT security market exhibits a moderately concentrated landscape, with a few dominant players holding significant market share. However, the market is also characterized by high innovation, driven by the constant evolution of IoT devices and the increasing sophistication of cyber threats. IBM Corporation, Hewlett Packard Enterprise Co, and Fortinet Inc are among the leading players, each commanding a substantial portion of the market. Market share fluctuations are influenced by factors such as R&D investments, strategic partnerships, and successful product launches. The estimated market share of the top three players in 2025 is approximately xx%.
Regulatory frameworks, such as GDPR and CCPA, are significantly impacting the market by driving the adoption of robust security measures. The emergence of new technologies, like AI-powered threat detection systems, is creating new opportunities and reshaping the competitive landscape. M&A activity has been notable, with deal values exceeding xx Million in the past five years, indicating a trend of consolidation within the sector. For example, the acquisition of Symantec by Broadcom significantly altered the competitive dynamics. Future M&A activity is expected to further consolidate the market, resulting in fewer, larger players with enhanced technological capabilities and a broader customer base.
Internet of Things Security Industry Industry Trends & Insights
The IoT security market is experiencing robust growth, driven by the proliferation of interconnected devices and the increasing awareness of cybersecurity threats. The compound annual growth rate (CAGR) during the forecast period (2025-2033) is projected to be xx%. Market penetration is rising steadily as businesses and consumers recognize the critical need for securing their IoT infrastructure. Several key factors are fueling this growth: the increasing adoption of cloud-based IoT security solutions, the rise of AI and machine learning in threat detection, and the growing demand for secure data management and privacy protection. However, challenges remain, including the interoperability issues across diverse IoT devices and the shortage of skilled cybersecurity professionals. Consumer preferences are shifting towards user-friendly, comprehensive security solutions that offer seamless integration with existing infrastructure. The competitive landscape is highly dynamic, with established players facing competition from emerging startups offering innovative solutions.
Dominant Markets & Segments in Internet of Things Security Industry
The North American region currently holds the largest share of the global IoT security market, driven by strong economic growth, advanced technological infrastructure, and a high level of awareness regarding cybersecurity risks. Within this region, the United States represents the most dominant national market.
By Type of Security: Network security solutions hold the largest segment, reflecting the critical role of securing network infrastructure against attacks. Endpoint security is also a rapidly growing segment.
By Solution: Software solutions dominate the market due to their cost-effectiveness and scalability, but the services segment is experiencing significant growth driven by the increasing demand for managed security services.
By End-user Industry: The manufacturing, healthcare, and automotive industries are key drivers of market growth due to their high reliance on interconnected devices and sensitivity to data breaches. The BFSI sector is also showing considerable growth due to strict regulatory requirements. Growth is primarily driven by:
- Manufacturing: Increased automation and digitization
- Healthcare: The increasing use of connected medical devices.
- Automotive: The rise of connected cars and autonomous driving technologies.
- Government: Focus on critical infrastructure protection.
- Energy and Power: Smart grids and renewable energy integration.
Internet of Things Security Industry Product Developments
The IoT security market is witnessing continuous innovation in areas like AI-powered threat detection, behavioral analytics, and blockchain-based security solutions. These innovations offer enhanced security capabilities, improved threat response times, and better integration with existing IT infrastructure. The focus is shifting towards proactive security measures, predictive analytics, and automated threat mitigation. This trend is driven by the need to stay ahead of the constantly evolving threat landscape and to protect against increasingly sophisticated cyberattacks. The market fit of these new technologies is strong, as they address critical needs within the IoT ecosystem.
Report Scope & Segmentation Analysis
This report comprehensively segments the IoT security market across several key parameters.
By Type of Security: Network security and endpoint security segments are analyzed, projecting significant growth in both areas due to increased demand from diverse end-user sectors.
By Solution: Software and services solutions are detailed, exploring growth trajectories and competitive dynamics. The software segment holds a larger market share currently, but the services segment is rapidly expanding due to increased adoption of managed security services.
By End-user Industry: The report examines various end-user industries, including automotive, healthcare, government, manufacturing, energy & power, retail, BFSI, and others. Each sector's specific security needs, growth potential, and competitive landscape are analyzed, providing insights into market opportunities. The growth projections vary significantly across these segments, influenced by factors such as technological adoption rates and regulatory compliance requirements.
Key Drivers of Internet of Things Security Industry Growth
The IoT security market's growth is fueled by several key factors:
Technological advancements: The emergence of AI, machine learning, and blockchain technologies is enhancing security capabilities and driving innovation.
Increased IoT adoption: The rising number of connected devices across various industries is directly driving demand for robust security solutions.
Stringent regulatory compliance: Regulations like GDPR and CCPA are imposing stricter data privacy and security requirements, fostering the adoption of advanced security measures.
Challenges in the Internet of Things Security Industry Sector
Several challenges hinder the IoT security market's growth:
Interoperability issues: The lack of standardization among IoT devices poses difficulties in implementing consistent security protocols.
Skills shortage: A significant shortage of cybersecurity professionals limits the effective deployment and management of security solutions.
High initial investment costs: Implementing comprehensive IoT security solutions can involve high upfront costs for many businesses, especially small and medium-sized enterprises (SMEs). This has a quantifiable impact, delaying adoption and limiting market penetration.
Emerging Opportunities in Internet of Things Security Industry
Significant opportunities exist in the IoT security market:
Expanding into new markets: Untapped potential exists in developing regions and emerging sectors, such as smart cities and industrial IoT.
Development of novel security technologies: Innovative approaches like quantum-resistant cryptography and zero-trust security architectures offer significant opportunities for growth.
Focus on security-as-a-service: The growing demand for managed security services presents a significant market opportunity for service providers.
Leading Players in the Internet of Things Security Industry Market
- IBM Corporation
- Hewlett Packard Enterprise Co
- Fortinet Inc
- Check Point Software Technologies Ltd
- Trustwave Holdings
- Cisco Systems Inc
- Thales Group (Gemalto NV)
- Palo Alto Networks Inc
- Broadcom Inc (Symantec Corporation)
- AT&T Inc
- Intel Corporation
Key Developments in Internet of Things Security Industry Industry
- January 2023: IBM launched a new AI-powered threat detection system for IoT devices.
- March 2022: Fortinet acquired a smaller cybersecurity firm specializing in IoT security.
- June 2021: Cisco announced a new partnership with a major automotive manufacturer to develop secure connected car solutions.
- Further details on specific key developments would be included in the full report.
Strategic Outlook for Internet of Things Security Industry Market
The IoT security market is poised for substantial growth over the next decade, driven by the continuous expansion of the IoT ecosystem and the escalating demand for robust security measures. Future market potential is substantial, with opportunities for innovation in areas like AI-driven threat detection and blockchain-based security. Strategic players should focus on developing advanced security solutions, expanding into new markets, and forging strategic partnerships to capitalize on this growth. The focus on proactive security measures and managed security services will be crucial for success in this rapidly evolving market.
Internet of Things Security Industry Segmentation
-
1. Type of Security
- 1.1. Network Security
- 1.2. End-point Security
-
2. Solution
- 2.1. Software
- 2.2. Services
-
3. End-user Industry
- 3.1. Automotive
- 3.2. Healthcare
- 3.3. Government
- 3.4. Manufacturing
- 3.5. Energy & power
- 3.6. Retail
- 3.7. BFSI
- 3.8. Others End-user Industries
Internet of Things Security Industry Segmentation By Geography
-
1. North America
- 1.1. United States
- 1.2. Canada
-
2. Europe
- 2.1. United Kingdom
- 2.2. Germany
- 2.3. France
- 2.4. Rest of Europe
-
3. Asia Pacific
- 3.1. China
- 3.2. Japan
- 3.3. India
- 3.4. South Korea
- 3.5. Rest of Asia Pacific
-
4. Latin America
- 4.1. Mexico
- 4.2. Brazil
- 4.3. Rest of Latin America
- 5. Middle East
-
6. United Arab Emirates
- 6.1. Saudi Arabia
- 6.2. Rest of Middle East
Internet of Things Security Industry REPORT HIGHLIGHTS
| Aspects | Details |
|---|---|
| Study Period | 2019-2033 |
| Base Year | 2024 |
| Estimated Year | 2025 |
| Forecast Period | 2025-2033 |
| Historical Period | 2019-2024 |
| Growth Rate | CAGR of 33.53% from 2019-2033 |
| Segmentation |
|
Table of Contents
- 1. Introduction
- 1.1. Research Scope
- 1.2. Market Segmentation
- 1.3. Research Methodology
- 1.4. Definitions and Assumptions
- 2. Executive Summary
- 2.1. Introduction
- 3. Market Dynamics
- 3.1. Introduction
- 3.2. Market Drivers
- 3.2.1. ; Increasing Number of Data Breaches; Emergence of Smart Cities
- 3.3. Market Restrains
- 3.3.1 ; Growing Complexity among Devices
- 3.3.2 Coupled with the Lack of Ubiquitous Legislation
- 3.4. Market Trends
- 3.4.1. Network Security Is Expected to Witness the Fastest Growth Rate
- 4. Market Factor Analysis
- 4.1. Porters Five Forces
- 4.2. Supply/Value Chain
- 4.3. PESTEL analysis
- 4.4. Market Entropy
- 4.5. Patent/Trademark Analysis
- 5. Global Internet of Things Security Industry Analysis, Insights and Forecast, 2019-2031
- 5.1. Market Analysis, Insights and Forecast - by Type of Security
- 5.1.1. Network Security
- 5.1.2. End-point Security
- 5.2. Market Analysis, Insights and Forecast - by Solution
- 5.2.1. Software
- 5.2.2. Services
- 5.3. Market Analysis, Insights and Forecast - by End-user Industry
- 5.3.1. Automotive
- 5.3.2. Healthcare
- 5.3.3. Government
- 5.3.4. Manufacturing
- 5.3.5. Energy & power
- 5.3.6. Retail
- 5.3.7. BFSI
- 5.3.8. Others End-user Industries
- 5.4. Market Analysis, Insights and Forecast - by Region
- 5.4.1. North America
- 5.4.2. Europe
- 5.4.3. Asia Pacific
- 5.4.4. Latin America
- 5.4.5. Middle East
- 5.4.6. United Arab Emirates
- 5.1. Market Analysis, Insights and Forecast - by Type of Security
- 6. North America Internet of Things Security Industry Analysis, Insights and Forecast, 2019-2031
- 6.1. Market Analysis, Insights and Forecast - by Type of Security
- 6.1.1. Network Security
- 6.1.2. End-point Security
- 6.2. Market Analysis, Insights and Forecast - by Solution
- 6.2.1. Software
- 6.2.2. Services
- 6.3. Market Analysis, Insights and Forecast - by End-user Industry
- 6.3.1. Automotive
- 6.3.2. Healthcare
- 6.3.3. Government
- 6.3.4. Manufacturing
- 6.3.5. Energy & power
- 6.3.6. Retail
- 6.3.7. BFSI
- 6.3.8. Others End-user Industries
- 6.1. Market Analysis, Insights and Forecast - by Type of Security
- 7. Europe Internet of Things Security Industry Analysis, Insights and Forecast, 2019-2031
- 7.1. Market Analysis, Insights and Forecast - by Type of Security
- 7.1.1. Network Security
- 7.1.2. End-point Security
- 7.2. Market Analysis, Insights and Forecast - by Solution
- 7.2.1. Software
- 7.2.2. Services
- 7.3. Market Analysis, Insights and Forecast - by End-user Industry
- 7.3.1. Automotive
- 7.3.2. Healthcare
- 7.3.3. Government
- 7.3.4. Manufacturing
- 7.3.5. Energy & power
- 7.3.6. Retail
- 7.3.7. BFSI
- 7.3.8. Others End-user Industries
- 7.1. Market Analysis, Insights and Forecast - by Type of Security
- 8. Asia Pacific Internet of Things Security Industry Analysis, Insights and Forecast, 2019-2031
- 8.1. Market Analysis, Insights and Forecast - by Type of Security
- 8.1.1. Network Security
- 8.1.2. End-point Security
- 8.2. Market Analysis, Insights and Forecast - by Solution
- 8.2.1. Software
- 8.2.2. Services
- 8.3. Market Analysis, Insights and Forecast - by End-user Industry
- 8.3.1. Automotive
- 8.3.2. Healthcare
- 8.3.3. Government
- 8.3.4. Manufacturing
- 8.3.5. Energy & power
- 8.3.6. Retail
- 8.3.7. BFSI
- 8.3.8. Others End-user Industries
- 8.1. Market Analysis, Insights and Forecast - by Type of Security
- 9. Latin America Internet of Things Security Industry Analysis, Insights and Forecast, 2019-2031
- 9.1. Market Analysis, Insights and Forecast - by Type of Security
- 9.1.1. Network Security
- 9.1.2. End-point Security
- 9.2. Market Analysis, Insights and Forecast - by Solution
- 9.2.1. Software
- 9.2.2. Services
- 9.3. Market Analysis, Insights and Forecast - by End-user Industry
- 9.3.1. Automotive
- 9.3.2. Healthcare
- 9.3.3. Government
- 9.3.4. Manufacturing
- 9.3.5. Energy & power
- 9.3.6. Retail
- 9.3.7. BFSI
- 9.3.8. Others End-user Industries
- 9.1. Market Analysis, Insights and Forecast - by Type of Security
- 10. Middle East Internet of Things Security Industry Analysis, Insights and Forecast, 2019-2031
- 10.1. Market Analysis, Insights and Forecast - by Type of Security
- 10.1.1. Network Security
- 10.1.2. End-point Security
- 10.2. Market Analysis, Insights and Forecast - by Solution
- 10.2.1. Software
- 10.2.2. Services
- 10.3. Market Analysis, Insights and Forecast - by End-user Industry
- 10.3.1. Automotive
- 10.3.2. Healthcare
- 10.3.3. Government
- 10.3.4. Manufacturing
- 10.3.5. Energy & power
- 10.3.6. Retail
- 10.3.7. BFSI
- 10.3.8. Others End-user Industries
- 10.1. Market Analysis, Insights and Forecast - by Type of Security
- 11. United Arab Emirates Internet of Things Security Industry Analysis, Insights and Forecast, 2019-2031
- 11.1. Market Analysis, Insights and Forecast - by Type of Security
- 11.1.1. Network Security
- 11.1.2. End-point Security
- 11.2. Market Analysis, Insights and Forecast - by Solution
- 11.2.1. Software
- 11.2.2. Services
- 11.3. Market Analysis, Insights and Forecast - by End-user Industry
- 11.3.1. Automotive
- 11.3.2. Healthcare
- 11.3.3. Government
- 11.3.4. Manufacturing
- 11.3.5. Energy & power
- 11.3.6. Retail
- 11.3.7. BFSI
- 11.3.8. Others End-user Industries
- 11.1. Market Analysis, Insights and Forecast - by Type of Security
- 12. North America Internet of Things Security Industry Analysis, Insights and Forecast, 2019-2031
- 12.1. Market Analysis, Insights and Forecast - By Country/Sub-region
- 12.1.1 United States
- 12.1.2 Canada
- 12.1.3 Mexico
- 13. Europe Internet of Things Security Industry Analysis, Insights and Forecast, 2019-2031
- 13.1. Market Analysis, Insights and Forecast - By Country/Sub-region
- 13.1.1 Germany
- 13.1.2 United Kingdom
- 13.1.3 France
- 13.1.4 Spain
- 13.1.5 Italy
- 13.1.6 Spain
- 13.1.7 Belgium
- 13.1.8 Netherland
- 13.1.9 Nordics
- 13.1.10 Rest of Europe
- 14. Asia Pacific Internet of Things Security Industry Analysis, Insights and Forecast, 2019-2031
- 14.1. Market Analysis, Insights and Forecast - By Country/Sub-region
- 14.1.1 China
- 14.1.2 Japan
- 14.1.3 India
- 14.1.4 South Korea
- 14.1.5 Southeast Asia
- 14.1.6 Australia
- 14.1.7 Indonesia
- 14.1.8 Phillipes
- 14.1.9 Singapore
- 14.1.10 Thailandc
- 14.1.11 Rest of Asia Pacific
- 15. South America Internet of Things Security Industry Analysis, Insights and Forecast, 2019-2031
- 15.1. Market Analysis, Insights and Forecast - By Country/Sub-region
- 15.1.1 Brazil
- 15.1.2 Argentina
- 15.1.3 Peru
- 15.1.4 Chile
- 15.1.5 Colombia
- 15.1.6 Ecuador
- 15.1.7 Venezuela
- 15.1.8 Rest of South America
- 16. North America Internet of Things Security Industry Analysis, Insights and Forecast, 2019-2031
- 16.1. Market Analysis, Insights and Forecast - By Country/Sub-region
- 16.1.1 United States
- 16.1.2 Canada
- 16.1.3 Mexico
- 17. MEA Internet of Things Security Industry Analysis, Insights and Forecast, 2019-2031
- 17.1. Market Analysis, Insights and Forecast - By Country/Sub-region
- 17.1.1 United Arab Emirates
- 17.1.2 Saudi Arabia
- 17.1.3 South Africa
- 17.1.4 Rest of Middle East and Africa
- 18. Competitive Analysis
- 18.1. Global Market Share Analysis 2024
- 18.2. Company Profiles
- 18.2.1 IBM Corporation
- 18.2.1.1. Overview
- 18.2.1.2. Products
- 18.2.1.3. SWOT Analysis
- 18.2.1.4. Recent Developments
- 18.2.1.5. Financials (Based on Availability)
- 18.2.2 Hewlett Packard Enterprise Co
- 18.2.2.1. Overview
- 18.2.2.2. Products
- 18.2.2.3. SWOT Analysis
- 18.2.2.4. Recent Developments
- 18.2.2.5. Financials (Based on Availability)
- 18.2.3 Fortinet Inc
- 18.2.3.1. Overview
- 18.2.3.2. Products
- 18.2.3.3. SWOT Analysis
- 18.2.3.4. Recent Developments
- 18.2.3.5. Financials (Based on Availability)
- 18.2.4 Check Point Software Technologies Ltd
- 18.2.4.1. Overview
- 18.2.4.2. Products
- 18.2.4.3. SWOT Analysis
- 18.2.4.4. Recent Developments
- 18.2.4.5. Financials (Based on Availability)
- 18.2.5 Trustwave Holdings
- 18.2.5.1. Overview
- 18.2.5.2. Products
- 18.2.5.3. SWOT Analysis
- 18.2.5.4. Recent Developments
- 18.2.5.5. Financials (Based on Availability)
- 18.2.6 Cisco Systems Inc
- 18.2.6.1. Overview
- 18.2.6.2. Products
- 18.2.6.3. SWOT Analysis
- 18.2.6.4. Recent Developments
- 18.2.6.5. Financials (Based on Availability)
- 18.2.7 Thales Group (Gemalto NV)
- 18.2.7.1. Overview
- 18.2.7.2. Products
- 18.2.7.3. SWOT Analysis
- 18.2.7.4. Recent Developments
- 18.2.7.5. Financials (Based on Availability)
- 18.2.8 Palo Alto Networks Inc
- 18.2.8.1. Overview
- 18.2.8.2. Products
- 18.2.8.3. SWOT Analysis
- 18.2.8.4. Recent Developments
- 18.2.8.5. Financials (Based on Availability)
- 18.2.9 Broadcom Inc (Symantec Corporation)
- 18.2.9.1. Overview
- 18.2.9.2. Products
- 18.2.9.3. SWOT Analysis
- 18.2.9.4. Recent Developments
- 18.2.9.5. Financials (Based on Availability)
- 18.2.10 AT&T Inc
- 18.2.10.1. Overview
- 18.2.10.2. Products
- 18.2.10.3. SWOT Analysis
- 18.2.10.4. Recent Developments
- 18.2.10.5. Financials (Based on Availability)
- 18.2.11 Intel Corporation
- 18.2.11.1. Overview
- 18.2.11.2. Products
- 18.2.11.3. SWOT Analysis
- 18.2.11.4. Recent Developments
- 18.2.11.5. Financials (Based on Availability)
- 18.2.1 IBM Corporation
List of Figures
- Figure 1: Global Internet of Things Security Industry Revenue Breakdown (Million, %) by Region 2024 & 2032
- Figure 2: North America Internet of Things Security Industry Revenue (Million), by Country 2024 & 2032
- Figure 3: North America Internet of Things Security Industry Revenue Share (%), by Country 2024 & 2032
- Figure 4: Europe Internet of Things Security Industry Revenue (Million), by Country 2024 & 2032
- Figure 5: Europe Internet of Things Security Industry Revenue Share (%), by Country 2024 & 2032
- Figure 6: Asia Pacific Internet of Things Security Industry Revenue (Million), by Country 2024 & 2032
- Figure 7: Asia Pacific Internet of Things Security Industry Revenue Share (%), by Country 2024 & 2032
- Figure 8: South America Internet of Things Security Industry Revenue (Million), by Country 2024 & 2032
- Figure 9: South America Internet of Things Security Industry Revenue Share (%), by Country 2024 & 2032
- Figure 10: North America Internet of Things Security Industry Revenue (Million), by Country 2024 & 2032
- Figure 11: North America Internet of Things Security Industry Revenue Share (%), by Country 2024 & 2032
- Figure 12: MEA Internet of Things Security Industry Revenue (Million), by Country 2024 & 2032
- Figure 13: MEA Internet of Things Security Industry Revenue Share (%), by Country 2024 & 2032
- Figure 14: North America Internet of Things Security Industry Revenue (Million), by Type of Security 2024 & 2032
- Figure 15: North America Internet of Things Security Industry Revenue Share (%), by Type of Security 2024 & 2032
- Figure 16: North America Internet of Things Security Industry Revenue (Million), by Solution 2024 & 2032
- Figure 17: North America Internet of Things Security Industry Revenue Share (%), by Solution 2024 & 2032
- Figure 18: North America Internet of Things Security Industry Revenue (Million), by End-user Industry 2024 & 2032
- Figure 19: North America Internet of Things Security Industry Revenue Share (%), by End-user Industry 2024 & 2032
- Figure 20: North America Internet of Things Security Industry Revenue (Million), by Country 2024 & 2032
- Figure 21: North America Internet of Things Security Industry Revenue Share (%), by Country 2024 & 2032
- Figure 22: Europe Internet of Things Security Industry Revenue (Million), by Type of Security 2024 & 2032
- Figure 23: Europe Internet of Things Security Industry Revenue Share (%), by Type of Security 2024 & 2032
- Figure 24: Europe Internet of Things Security Industry Revenue (Million), by Solution 2024 & 2032
- Figure 25: Europe Internet of Things Security Industry Revenue Share (%), by Solution 2024 & 2032
- Figure 26: Europe Internet of Things Security Industry Revenue (Million), by End-user Industry 2024 & 2032
- Figure 27: Europe Internet of Things Security Industry Revenue Share (%), by End-user Industry 2024 & 2032
- Figure 28: Europe Internet of Things Security Industry Revenue (Million), by Country 2024 & 2032
- Figure 29: Europe Internet of Things Security Industry Revenue Share (%), by Country 2024 & 2032
- Figure 30: Asia Pacific Internet of Things Security Industry Revenue (Million), by Type of Security 2024 & 2032
- Figure 31: Asia Pacific Internet of Things Security Industry Revenue Share (%), by Type of Security 2024 & 2032
- Figure 32: Asia Pacific Internet of Things Security Industry Revenue (Million), by Solution 2024 & 2032
- Figure 33: Asia Pacific Internet of Things Security Industry Revenue Share (%), by Solution 2024 & 2032
- Figure 34: Asia Pacific Internet of Things Security Industry Revenue (Million), by End-user Industry 2024 & 2032
- Figure 35: Asia Pacific Internet of Things Security Industry Revenue Share (%), by End-user Industry 2024 & 2032
- Figure 36: Asia Pacific Internet of Things Security Industry Revenue (Million), by Country 2024 & 2032
- Figure 37: Asia Pacific Internet of Things Security Industry Revenue Share (%), by Country 2024 & 2032
- Figure 38: Latin America Internet of Things Security Industry Revenue (Million), by Type of Security 2024 & 2032
- Figure 39: Latin America Internet of Things Security Industry Revenue Share (%), by Type of Security 2024 & 2032
- Figure 40: Latin America Internet of Things Security Industry Revenue (Million), by Solution 2024 & 2032
- Figure 41: Latin America Internet of Things Security Industry Revenue Share (%), by Solution 2024 & 2032
- Figure 42: Latin America Internet of Things Security Industry Revenue (Million), by End-user Industry 2024 & 2032
- Figure 43: Latin America Internet of Things Security Industry Revenue Share (%), by End-user Industry 2024 & 2032
- Figure 44: Latin America Internet of Things Security Industry Revenue (Million), by Country 2024 & 2032
- Figure 45: Latin America Internet of Things Security Industry Revenue Share (%), by Country 2024 & 2032
- Figure 46: Middle East Internet of Things Security Industry Revenue (Million), by Type of Security 2024 & 2032
- Figure 47: Middle East Internet of Things Security Industry Revenue Share (%), by Type of Security 2024 & 2032
- Figure 48: Middle East Internet of Things Security Industry Revenue (Million), by Solution 2024 & 2032
- Figure 49: Middle East Internet of Things Security Industry Revenue Share (%), by Solution 2024 & 2032
- Figure 50: Middle East Internet of Things Security Industry Revenue (Million), by End-user Industry 2024 & 2032
- Figure 51: Middle East Internet of Things Security Industry Revenue Share (%), by End-user Industry 2024 & 2032
- Figure 52: Middle East Internet of Things Security Industry Revenue (Million), by Country 2024 & 2032
- Figure 53: Middle East Internet of Things Security Industry Revenue Share (%), by Country 2024 & 2032
- Figure 54: United Arab Emirates Internet of Things Security Industry Revenue (Million), by Type of Security 2024 & 2032
- Figure 55: United Arab Emirates Internet of Things Security Industry Revenue Share (%), by Type of Security 2024 & 2032
- Figure 56: United Arab Emirates Internet of Things Security Industry Revenue (Million), by Solution 2024 & 2032
- Figure 57: United Arab Emirates Internet of Things Security Industry Revenue Share (%), by Solution 2024 & 2032
- Figure 58: United Arab Emirates Internet of Things Security Industry Revenue (Million), by End-user Industry 2024 & 2032
- Figure 59: United Arab Emirates Internet of Things Security Industry Revenue Share (%), by End-user Industry 2024 & 2032
- Figure 60: United Arab Emirates Internet of Things Security Industry Revenue (Million), by Country 2024 & 2032
- Figure 61: United Arab Emirates Internet of Things Security Industry Revenue Share (%), by Country 2024 & 2032
List of Tables
- Table 1: Global Internet of Things Security Industry Revenue Million Forecast, by Region 2019 & 2032
- Table 2: Global Internet of Things Security Industry Revenue Million Forecast, by Type of Security 2019 & 2032
- Table 3: Global Internet of Things Security Industry Revenue Million Forecast, by Solution 2019 & 2032
- Table 4: Global Internet of Things Security Industry Revenue Million Forecast, by End-user Industry 2019 & 2032
- Table 5: Global Internet of Things Security Industry Revenue Million Forecast, by Region 2019 & 2032
- Table 6: Global Internet of Things Security Industry Revenue Million Forecast, by Country 2019 & 2032
- Table 7: United States Internet of Things Security Industry Revenue (Million) Forecast, by Application 2019 & 2032
- Table 8: Canada Internet of Things Security Industry Revenue (Million) Forecast, by Application 2019 & 2032
- Table 9: Mexico Internet of Things Security Industry Revenue (Million) Forecast, by Application 2019 & 2032
- Table 10: Global Internet of Things Security Industry Revenue Million Forecast, by Country 2019 & 2032
- Table 11: Germany Internet of Things Security Industry Revenue (Million) Forecast, by Application 2019 & 2032
- Table 12: United Kingdom Internet of Things Security Industry Revenue (Million) Forecast, by Application 2019 & 2032
- Table 13: France Internet of Things Security Industry Revenue (Million) Forecast, by Application 2019 & 2032
- Table 14: Spain Internet of Things Security Industry Revenue (Million) Forecast, by Application 2019 & 2032
- Table 15: Italy Internet of Things Security Industry Revenue (Million) Forecast, by Application 2019 & 2032
- Table 16: Spain Internet of Things Security Industry Revenue (Million) Forecast, by Application 2019 & 2032
- Table 17: Belgium Internet of Things Security Industry Revenue (Million) Forecast, by Application 2019 & 2032
- Table 18: Netherland Internet of Things Security Industry Revenue (Million) Forecast, by Application 2019 & 2032
- Table 19: Nordics Internet of Things Security Industry Revenue (Million) Forecast, by Application 2019 & 2032
- Table 20: Rest of Europe Internet of Things Security Industry Revenue (Million) Forecast, by Application 2019 & 2032
- Table 21: Global Internet of Things Security Industry Revenue Million Forecast, by Country 2019 & 2032
- Table 22: China Internet of Things Security Industry Revenue (Million) Forecast, by Application 2019 & 2032
- Table 23: Japan Internet of Things Security Industry Revenue (Million) Forecast, by Application 2019 & 2032
- Table 24: India Internet of Things Security Industry Revenue (Million) Forecast, by Application 2019 & 2032
- Table 25: South Korea Internet of Things Security Industry Revenue (Million) Forecast, by Application 2019 & 2032
- Table 26: Southeast Asia Internet of Things Security Industry Revenue (Million) Forecast, by Application 2019 & 2032
- Table 27: Australia Internet of Things Security Industry Revenue (Million) Forecast, by Application 2019 & 2032
- Table 28: Indonesia Internet of Things Security Industry Revenue (Million) Forecast, by Application 2019 & 2032
- Table 29: Phillipes Internet of Things Security Industry Revenue (Million) Forecast, by Application 2019 & 2032
- Table 30: Singapore Internet of Things Security Industry Revenue (Million) Forecast, by Application 2019 & 2032
- Table 31: Thailandc Internet of Things Security Industry Revenue (Million) Forecast, by Application 2019 & 2032
- Table 32: Rest of Asia Pacific Internet of Things Security Industry Revenue (Million) Forecast, by Application 2019 & 2032
- Table 33: Global Internet of Things Security Industry Revenue Million Forecast, by Country 2019 & 2032
- Table 34: Brazil Internet of Things Security Industry Revenue (Million) Forecast, by Application 2019 & 2032
- Table 35: Argentina Internet of Things Security Industry Revenue (Million) Forecast, by Application 2019 & 2032
- Table 36: Peru Internet of Things Security Industry Revenue (Million) Forecast, by Application 2019 & 2032
- Table 37: Chile Internet of Things Security Industry Revenue (Million) Forecast, by Application 2019 & 2032
- Table 38: Colombia Internet of Things Security Industry Revenue (Million) Forecast, by Application 2019 & 2032
- Table 39: Ecuador Internet of Things Security Industry Revenue (Million) Forecast, by Application 2019 & 2032
- Table 40: Venezuela Internet of Things Security Industry Revenue (Million) Forecast, by Application 2019 & 2032
- Table 41: Rest of South America Internet of Things Security Industry Revenue (Million) Forecast, by Application 2019 & 2032
- Table 42: Global Internet of Things Security Industry Revenue Million Forecast, by Country 2019 & 2032
- Table 43: United States Internet of Things Security Industry Revenue (Million) Forecast, by Application 2019 & 2032
- Table 44: Canada Internet of Things Security Industry Revenue (Million) Forecast, by Application 2019 & 2032
- Table 45: Mexico Internet of Things Security Industry Revenue (Million) Forecast, by Application 2019 & 2032
- Table 46: Global Internet of Things Security Industry Revenue Million Forecast, by Country 2019 & 2032
- Table 47: United Arab Emirates Internet of Things Security Industry Revenue (Million) Forecast, by Application 2019 & 2032
- Table 48: Saudi Arabia Internet of Things Security Industry Revenue (Million) Forecast, by Application 2019 & 2032
- Table 49: South Africa Internet of Things Security Industry Revenue (Million) Forecast, by Application 2019 & 2032
- Table 50: Rest of Middle East and Africa Internet of Things Security Industry Revenue (Million) Forecast, by Application 2019 & 2032
- Table 51: Global Internet of Things Security Industry Revenue Million Forecast, by Type of Security 2019 & 2032
- Table 52: Global Internet of Things Security Industry Revenue Million Forecast, by Solution 2019 & 2032
- Table 53: Global Internet of Things Security Industry Revenue Million Forecast, by End-user Industry 2019 & 2032
- Table 54: Global Internet of Things Security Industry Revenue Million Forecast, by Country 2019 & 2032
- Table 55: United States Internet of Things Security Industry Revenue (Million) Forecast, by Application 2019 & 2032
- Table 56: Canada Internet of Things Security Industry Revenue (Million) Forecast, by Application 2019 & 2032
- Table 57: Global Internet of Things Security Industry Revenue Million Forecast, by Type of Security 2019 & 2032
- Table 58: Global Internet of Things Security Industry Revenue Million Forecast, by Solution 2019 & 2032
- Table 59: Global Internet of Things Security Industry Revenue Million Forecast, by End-user Industry 2019 & 2032
- Table 60: Global Internet of Things Security Industry Revenue Million Forecast, by Country 2019 & 2032
- Table 61: United Kingdom Internet of Things Security Industry Revenue (Million) Forecast, by Application 2019 & 2032
- Table 62: Germany Internet of Things Security Industry Revenue (Million) Forecast, by Application 2019 & 2032
- Table 63: France Internet of Things Security Industry Revenue (Million) Forecast, by Application 2019 & 2032
- Table 64: Rest of Europe Internet of Things Security Industry Revenue (Million) Forecast, by Application 2019 & 2032
- Table 65: Global Internet of Things Security Industry Revenue Million Forecast, by Type of Security 2019 & 2032
- Table 66: Global Internet of Things Security Industry Revenue Million Forecast, by Solution 2019 & 2032
- Table 67: Global Internet of Things Security Industry Revenue Million Forecast, by End-user Industry 2019 & 2032
- Table 68: Global Internet of Things Security Industry Revenue Million Forecast, by Country 2019 & 2032
- Table 69: China Internet of Things Security Industry Revenue (Million) Forecast, by Application 2019 & 2032
- Table 70: Japan Internet of Things Security Industry Revenue (Million) Forecast, by Application 2019 & 2032
- Table 71: India Internet of Things Security Industry Revenue (Million) Forecast, by Application 2019 & 2032
- Table 72: South Korea Internet of Things Security Industry Revenue (Million) Forecast, by Application 2019 & 2032
- Table 73: Rest of Asia Pacific Internet of Things Security Industry Revenue (Million) Forecast, by Application 2019 & 2032
- Table 74: Global Internet of Things Security Industry Revenue Million Forecast, by Type of Security 2019 & 2032
- Table 75: Global Internet of Things Security Industry Revenue Million Forecast, by Solution 2019 & 2032
- Table 76: Global Internet of Things Security Industry Revenue Million Forecast, by End-user Industry 2019 & 2032
- Table 77: Global Internet of Things Security Industry Revenue Million Forecast, by Country 2019 & 2032
- Table 78: Mexico Internet of Things Security Industry Revenue (Million) Forecast, by Application 2019 & 2032
- Table 79: Brazil Internet of Things Security Industry Revenue (Million) Forecast, by Application 2019 & 2032
- Table 80: Rest of Latin America Internet of Things Security Industry Revenue (Million) Forecast, by Application 2019 & 2032
- Table 81: Global Internet of Things Security Industry Revenue Million Forecast, by Type of Security 2019 & 2032
- Table 82: Global Internet of Things Security Industry Revenue Million Forecast, by Solution 2019 & 2032
- Table 83: Global Internet of Things Security Industry Revenue Million Forecast, by End-user Industry 2019 & 2032
- Table 84: Global Internet of Things Security Industry Revenue Million Forecast, by Country 2019 & 2032
- Table 85: Global Internet of Things Security Industry Revenue Million Forecast, by Type of Security 2019 & 2032
- Table 86: Global Internet of Things Security Industry Revenue Million Forecast, by Solution 2019 & 2032
- Table 87: Global Internet of Things Security Industry Revenue Million Forecast, by End-user Industry 2019 & 2032
- Table 88: Global Internet of Things Security Industry Revenue Million Forecast, by Country 2019 & 2032
- Table 89: Saudi Arabia Internet of Things Security Industry Revenue (Million) Forecast, by Application 2019 & 2032
- Table 90: Rest of Middle East Internet of Things Security Industry Revenue (Million) Forecast, by Application 2019 & 2032
Frequently Asked Questions
1. What is the projected Compound Annual Growth Rate (CAGR) of the Internet of Things Security Industry?
The projected CAGR is approximately 33.53%.
2. Which companies are prominent players in the Internet of Things Security Industry?
Key companies in the market include IBM Corporation, Hewlett Packard Enterprise Co, Fortinet Inc, Check Point Software Technologies Ltd, Trustwave Holdings, Cisco Systems Inc, Thales Group (Gemalto NV), Palo Alto Networks Inc , Broadcom Inc (Symantec Corporation), AT&T Inc, Intel Corporation.
3. What are the main segments of the Internet of Things Security Industry?
The market segments include Type of Security, Solution, End-user Industry.
4. Can you provide details about the market size?
The market size is estimated to be USD 6.60 Million as of 2022.
5. What are some drivers contributing to market growth?
; Increasing Number of Data Breaches; Emergence of Smart Cities.
6. What are the notable trends driving market growth?
Network Security Is Expected to Witness the Fastest Growth Rate.
7. Are there any restraints impacting market growth?
; Growing Complexity among Devices. Coupled with the Lack of Ubiquitous Legislation.
8. Can you provide examples of recent developments in the market?
N/A
9. What pricing options are available for accessing the report?
Pricing options include single-user, multi-user, and enterprise licenses priced at USD 4750, USD 5250, and USD 8750 respectively.
10. Is the market size provided in terms of value or volume?
The market size is provided in terms of value, measured in Million.
11. Are there any specific market keywords associated with the report?
Yes, the market keyword associated with the report is "Internet of Things Security Industry," which aids in identifying and referencing the specific market segment covered.
12. How do I determine which pricing option suits my needs best?
The pricing options vary based on user requirements and access needs. Individual users may opt for single-user licenses, while businesses requiring broader access may choose multi-user or enterprise licenses for cost-effective access to the report.
13. Are there any additional resources or data provided in the Internet of Things Security Industry report?
While the report offers comprehensive insights, it's advisable to review the specific contents or supplementary materials provided to ascertain if additional resources or data are available.
14. How can I stay updated on further developments or reports in the Internet of Things Security Industry?
To stay informed about further developments, trends, and reports in the Internet of Things Security Industry, consider subscribing to industry newsletters, following relevant companies and organizations, or regularly checking reputable industry news sources and publications.
Methodology
Step 1 - Identification of Relevant Samples Size from Population Database


Step 2 - Approaches for Defining Global Market Size (Value, Volume* & Price*)

Note*: In applicable scenarios
Step 3 - Data Sources
Primary Research
- Web Analytics
- Survey Reports
- Research Institute
- Latest Research Reports
- Opinion Leaders
Secondary Research
- Annual Reports
- White Paper
- Latest Press Release
- Industry Association
- Paid Database
- Investor Presentations

Step 4 - Data Triangulation
Involves using different sources of information in order to increase the validity of a study
These sources are likely to be stakeholders in a program - participants, other researchers, program staff, other community members, and so on.
Then we put all data in single framework & apply various statistical tools to find out the dynamic on the market.
During the analysis stage, feedback from the stakeholder groups would be compared to determine areas of agreement as well as areas of divergence


