
Key Insights
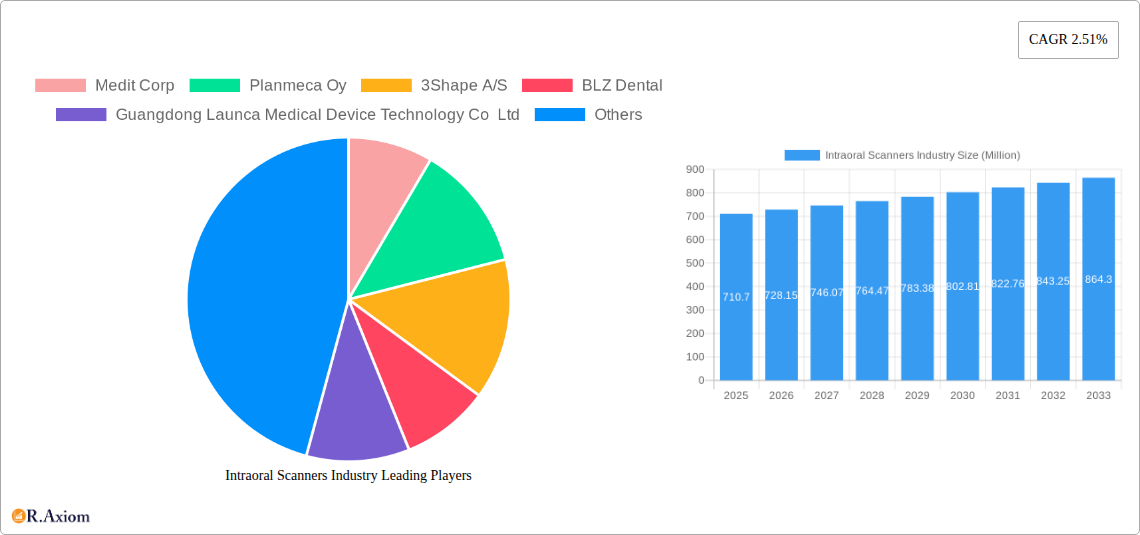
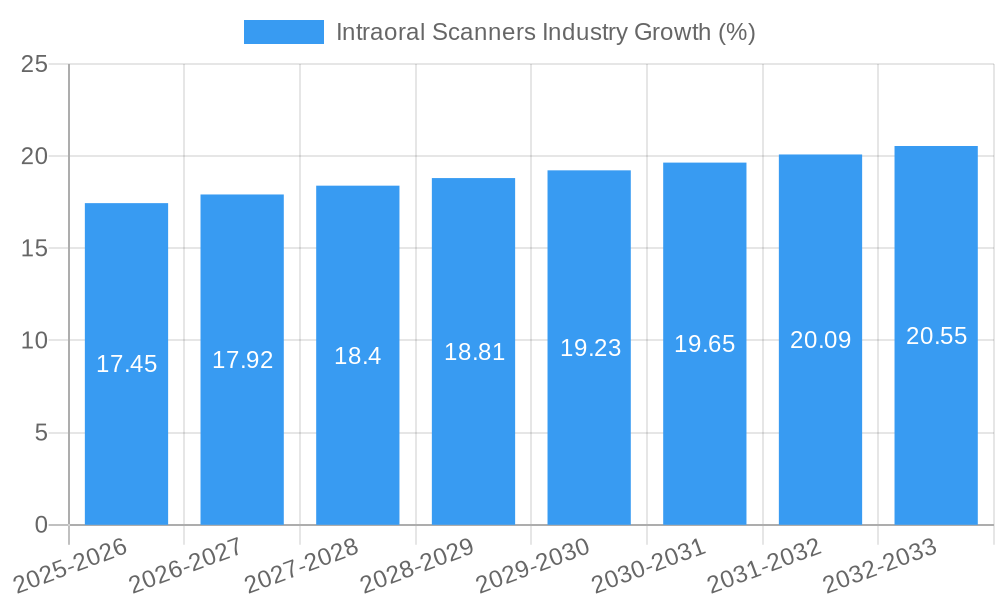
The global intraoral scanner market, valued at $710.70 million in 2025, is projected to experience steady growth, driven by several key factors. The increasing adoption of digital dentistry, coupled with the rising demand for minimally invasive procedures and improved diagnostic capabilities, is fueling market expansion. Technological advancements, such as the development of more accurate, faster, and user-friendly scanners, are further contributing to this growth. The market segmentation reveals a strong preference for standalone scanners in dental clinics, reflecting the need for dedicated, high-performance devices in specialized settings. However, the portable segment is also gaining traction, driven by the increasing need for flexibility and portability in various clinical environments. While precise market share data for each segment and region isn't provided, a logical assumption based on market trends suggests a slightly larger market share for standalone scanners within dental clinics in North America and Europe, with portable scanners showing faster growth rates in emerging markets. Competitive landscape analysis indicates that established players like Medit Corp, Planmeca Oy, and 3Shape A/S hold significant market share, while newer entrants are focusing on innovation and affordability to gain a foothold. The market's continued growth is expected to be influenced by factors such as technological innovation, increasing awareness of digital dentistry's benefits, and expanding healthcare infrastructure, particularly in developing regions. However, high initial investment costs and the need for specialized training may act as restraints. The forecast period of 2025-2033 suggests a continued positive trajectory, with a compounded annual growth rate (CAGR) of 2.51%, reflecting a steady but sustainable market expansion.
The future of the intraoral scanner market hinges on technological advancements, particularly in areas like artificial intelligence for enhanced image processing and integration with other digital dentistry workflows. Furthermore, the increasing focus on cost-effective solutions and the development of subscription-based models could broaden market accessibility. Regulatory approvals and reimbursement policies in various regions will also significantly influence market penetration. Geographic expansion, particularly in emerging markets with growing dental infrastructure and increasing adoption of digital technologies, presents significant growth opportunities for market players. Therefore, strategic partnerships, mergers and acquisitions, and focused marketing campaigns emphasizing the benefits of digital dentistry will be crucial for successful navigation within this dynamic market. The consistent CAGR projection underscores the long-term stability and potential of the intraoral scanner market, attracting further investment and innovation in the years to come.
Intraoral Scanners Industry: A Comprehensive Market Report (2019-2033)
This detailed report provides a comprehensive analysis of the intraoral scanners industry, encompassing market size, segmentation, competitive landscape, technological advancements, and future growth prospects. The study period covers 2019-2033, with 2025 serving as the base and estimated year. The forecast period spans 2025-2033, while the historical period encompasses 2019-2024. The report is invaluable for industry stakeholders, investors, and businesses seeking to understand and navigate this dynamic market. The global market value in 2024 is estimated at $XX Million, and is projected to reach $XX Million by 2033, exhibiting a CAGR of XX% during the forecast period.
Intraoral Scanners Industry Market Concentration & Innovation
The intraoral scanners market exhibits a moderately concentrated structure, with a handful of major players commanding significant market share. Medit Corp, Planmeca Oy, and 3Shape A/S are among the leading companies, collectively holding an estimated XX% market share in 2024. However, several smaller players and new entrants are increasing competition. Innovation is a key driver, fueled by advancements in imaging technology, software integration, and user-friendliness. Regulatory frameworks, while generally supportive of technological advancements in dentistry, vary across geographies. This necessitates careful navigation of local regulations for market entry and product approvals. Substitutes, such as traditional impression-taking methods, are still present but losing ground due to the efficiency and accuracy of intraoral scanners. M&A activity within the industry remains significant; however, precise deal values are confidential in many instances. The total M&A value during the historical period is estimated at $XX Million.
- Market Share Concentration: Top 3 players hold approximately XX%
- Innovation Drivers: Advancements in imaging technology, AI integration, and ease of use.
- Regulatory Frameworks: Vary across regions, influencing market entry strategies.
- Product Substitutes: Traditional impression methods, facing declining market share.
- M&A Activity: Significant, with total deal values in the $XX Million range (2019-2024).
- End-User Trends: Increasing preference for digital workflows and chairside efficiency.
Intraoral Scanners Industry Industry Trends & Insights
The intraoral scanners market is experiencing robust growth, driven by several key factors. The increasing adoption of digital dentistry workflows in dental clinics and hospitals globally is a primary catalyst. Technological disruptions, such as the integration of artificial intelligence (AI) for enhanced image processing and automation, are further accelerating market expansion. Consumer preferences are shifting towards faster, more accurate, and less invasive procedures, further bolstering demand. The competitive landscape is dynamic, with both established players and emerging companies vying for market share through product innovation, strategic partnerships, and acquisitions. Market penetration remains relatively high in developed countries compared to emerging markets, presenting significant growth potential. The market size is projected to witness impressive growth, reaching $XX Million by 2033 from $XX Million in 2024.
Dominant Markets & Segments in Intraoral Scanners Industry
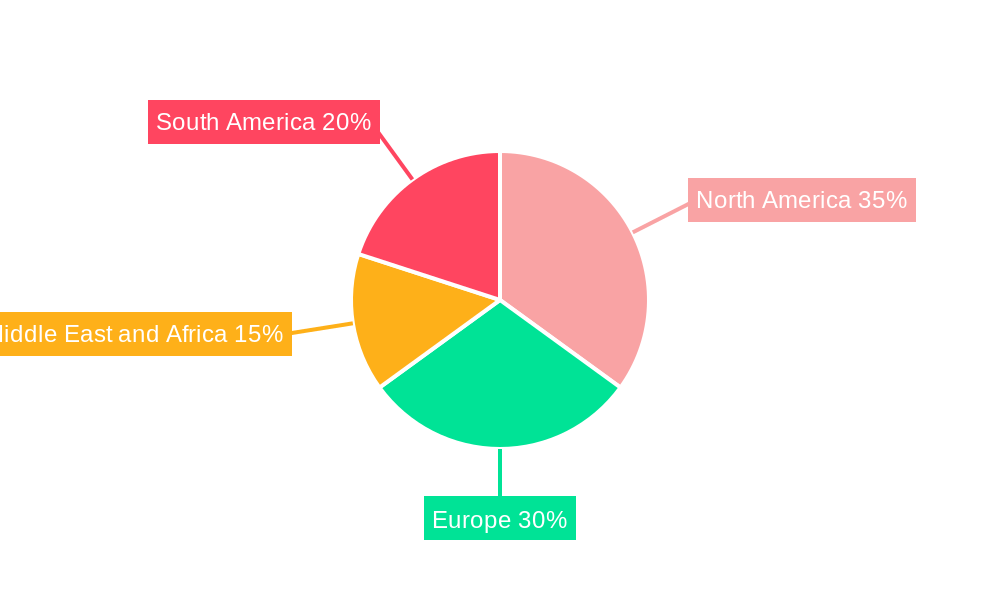
The North American region dominates the intraoral scanners market, driven by high adoption rates in dental clinics and hospitals, coupled with advanced technological infrastructure and favorable economic conditions. The standalone segment holds a larger market share compared to the portable segment due to its superior image quality and features. However, portable scanners are witnessing rapid growth due to increased portability and affordability, especially among smaller practices and mobile dental units. Dental clinics represent the largest end-user segment, contributing to more than XX% of the total market revenue in 2024.
- North America Dominance: High adoption rates, advanced infrastructure, and favorable economic conditions.
- Standalone Segment Leadership: Superior image quality and features drive market share dominance.
- Portable Segment Growth: Increased portability and affordability are attracting smaller practices.
- Dental Clinics as Largest End-User: Representing more than XX% of market revenue in 2024.
- Hospitals Segment Expansion: Growing demand for digital workflows in hospital settings.
- Other End-Users (e.g., research institutions): Representing a smaller but growing segment.
Intraoral Scanners Industry Product Developments
Recent product innovations focus on improved accuracy, speed, and ease of use. Features such as AI-powered image processing, wireless connectivity, and advanced scanning algorithms are becoming increasingly common. These advancements enhance clinical workflow efficiency and improve the overall patient experience. The competitive landscape is characterized by a continuous cycle of product launches and upgrades, with companies vying for differentiation through unique features and functionalities.
Report Scope & Segmentation Analysis
This report segments the intraoral scanners market by modality (standalone and portable) and end-user (dental clinics, hospitals, and other end-users). The standalone segment is projected to grow at a CAGR of XX% during the forecast period, driven by its superior accuracy and functionalities. The portable segment is expected to witness faster growth at a CAGR of XX%, fueled by its increasing affordability and portability. Dental clinics will remain the dominant end-user segment with a projected CAGR of XX%, while the hospital segment is anticipated to grow at a faster rate due to technological advancements and increasing adoption of digital dentistry workflows. The ‘other end-users’ segment is also expected to show steady growth.
Key Drivers of Intraoral Scanners Industry Growth
Several factors drive the growth of the intraoral scanners market. These include the increasing adoption of digital dentistry workflows, technological advancements leading to improved accuracy and speed, and the rising demand for minimally invasive dental procedures. Favorable regulatory environments in many countries further support market expansion. Furthermore, the rising prevalence of dental diseases and an increasing awareness of oral hygiene are contributing to the growth of the dental industry as a whole, positively impacting the demand for intraoral scanners.
Challenges in the Intraoral Scanners Industry Sector
The intraoral scanners market faces challenges such as high initial investment costs, the need for specialized training, and the potential for technical issues. Supply chain disruptions can impact product availability and prices. Intense competition among established players and new entrants creates pressure on pricing and profit margins. Furthermore, the evolving regulatory landscape in different regions can pose barriers to market entry and expansion. The overall market impact of these challenges is estimated to be a reduction in market growth by approximately XX% during the forecast period.
Emerging Opportunities in Intraoral Scanners Industry
Emerging opportunities lie in the integration of artificial intelligence and machine learning for advanced image analysis, and the development of more compact and portable scanners for broader accessibility. Expanding into emerging markets with untapped potential represents a significant growth avenue. The development of specialized scanners for specific applications, such as orthodontics or implantology, offers further opportunities for market expansion. Moreover, subscription models and service offerings are emerging as viable business models, particularly for smaller practices and users.
Leading Players in the Intraoral Scanners Industry Market
- Medit Corp
- Planmeca Oy
- 3Shape A/S
- BLZ Dental
- Guangdong Launca Medical Device Technology Co Ltd
- Densys Ltd
- Condor Technologies NV
- Dentsply Sirona Inc
- Align Technology Inc
- Institut Straumann AG
Key Developments in Intraoral Scanners Industry Industry
- March 2023: Freqty Technology launched the PANDA Smart intra-oral scanner at IDS Germany.
- March 2023: GC launched the Aadva IOS 200 intra-oral scanner with 4DR technology at IDS Cologne.
Strategic Outlook for Intraoral Scanners Industry Market
The intraoral scanners market is poised for continued growth, driven by technological advancements, increasing adoption of digital dentistry, and expansion into new markets. Opportunities exist in developing innovative products, enhancing software integration, and expanding service offerings. Strategic partnerships and acquisitions will continue to shape the competitive landscape. The market's long-term growth potential is substantial, driven by ongoing advancements and the steadily rising prevalence of digital dentistry.
Intraoral Scanners Industry Segmentation
-
1. Modality
- 1.1. Standalone
- 1.2. Portable
-
2. End User
- 2.1. Dental Clinics
- 2.2. Hospitals
- 2.3. Other End Users
Intraoral Scanners Industry Segmentation By Geography
-
1. North America
- 1.1. United States
- 1.2. Canada
- 1.3. Mexico
-
2. Europe
- 2.1. Germany
- 2.2. United Kingdom
- 2.3. France
- 2.4. Italy
- 2.5. Spain
- 2.6. Rest of Europe
-
3. Asia Pacific
- 3.1. China
- 3.2. Japan
- 3.3. India
- 3.4. Australia
- 3.5. South Korea
- 3.6. Rest of Asia Pacific
-
4. Middle East and Africa
- 4.1. GCC
- 4.2. South Africa
- 4.3. Rest of Middle East and Africa
-
5. South America
- 5.1. Brazil
- 5.2. Argentina
- 5.3. Rest of South America
Intraoral Scanners Industry REPORT HIGHLIGHTS
| Aspects | Details |
|---|---|
| Study Period | 2019-2033 |
| Base Year | 2024 |
| Estimated Year | 2025 |
| Forecast Period | 2025-2033 |
| Historical Period | 2019-2024 |
| Growth Rate | CAGR of 2.51% from 2019-2033 |
| Segmentation |
|
Table of Contents
- 1. Introduction
- 1.1. Research Scope
- 1.2. Market Segmentation
- 1.3. Research Methodology
- 1.4. Definitions and Assumptions
- 2. Executive Summary
- 2.1. Introduction
- 3. Market Dynamics
- 3.1. Introduction
- 3.2. Market Drivers
- 3.2.1. Rapid Technological Advancements; Increase in Geriatric Population; Rise in Dental Disorders
- 3.3. Market Restrains
- 3.3.1. Lack of Skilled Professionals; High Cost of Intraoral Scanners
- 3.4. Market Trends
- 3.4.1. Standalone Devices Segment is Expected to Witness Strong Growth in The Coming Years
- 4. Market Factor Analysis
- 4.1. Porters Five Forces
- 4.2. Supply/Value Chain
- 4.3. PESTEL analysis
- 4.4. Market Entropy
- 4.5. Patent/Trademark Analysis
- 5. Global Intraoral Scanners Industry Analysis, Insights and Forecast, 2019-2031
- 5.1. Market Analysis, Insights and Forecast - by Modality
- 5.1.1. Standalone
- 5.1.2. Portable
- 5.2. Market Analysis, Insights and Forecast - by End User
- 5.2.1. Dental Clinics
- 5.2.2. Hospitals
- 5.2.3. Other End Users
- 5.3. Market Analysis, Insights and Forecast - by Region
- 5.3.1. North America
- 5.3.2. Europe
- 5.3.3. Asia Pacific
- 5.3.4. Middle East and Africa
- 5.3.5. South America
- 5.1. Market Analysis, Insights and Forecast - by Modality
- 6. North America Intraoral Scanners Industry Analysis, Insights and Forecast, 2019-2031
- 6.1. Market Analysis, Insights and Forecast - by Modality
- 6.1.1. Standalone
- 6.1.2. Portable
- 6.2. Market Analysis, Insights and Forecast - by End User
- 6.2.1. Dental Clinics
- 6.2.2. Hospitals
- 6.2.3. Other End Users
- 6.1. Market Analysis, Insights and Forecast - by Modality
- 7. Europe Intraoral Scanners Industry Analysis, Insights and Forecast, 2019-2031
- 7.1. Market Analysis, Insights and Forecast - by Modality
- 7.1.1. Standalone
- 7.1.2. Portable
- 7.2. Market Analysis, Insights and Forecast - by End User
- 7.2.1. Dental Clinics
- 7.2.2. Hospitals
- 7.2.3. Other End Users
- 7.1. Market Analysis, Insights and Forecast - by Modality
- 8. Asia Pacific Intraoral Scanners Industry Analysis, Insights and Forecast, 2019-2031
- 8.1. Market Analysis, Insights and Forecast - by Modality
- 8.1.1. Standalone
- 8.1.2. Portable
- 8.2. Market Analysis, Insights and Forecast - by End User
- 8.2.1. Dental Clinics
- 8.2.2. Hospitals
- 8.2.3. Other End Users
- 8.1. Market Analysis, Insights and Forecast - by Modality
- 9. Middle East and Africa Intraoral Scanners Industry Analysis, Insights and Forecast, 2019-2031
- 9.1. Market Analysis, Insights and Forecast - by Modality
- 9.1.1. Standalone
- 9.1.2. Portable
- 9.2. Market Analysis, Insights and Forecast - by End User
- 9.2.1. Dental Clinics
- 9.2.2. Hospitals
- 9.2.3. Other End Users
- 9.1. Market Analysis, Insights and Forecast - by Modality
- 10. South America Intraoral Scanners Industry Analysis, Insights and Forecast, 2019-2031
- 10.1. Market Analysis, Insights and Forecast - by Modality
- 10.1.1. Standalone
- 10.1.2. Portable
- 10.2. Market Analysis, Insights and Forecast - by End User
- 10.2.1. Dental Clinics
- 10.2.2. Hospitals
- 10.2.3. Other End Users
- 10.1. Market Analysis, Insights and Forecast - by Modality
- 11. North America Intraoral Scanners Industry Analysis, Insights and Forecast, 2019-2031
- 11.1. Market Analysis, Insights and Forecast - By Country/Sub-region
- 11.1.1. undefined
- 12. Europe Intraoral Scanners Industry Analysis, Insights and Forecast, 2019-2031
- 12.1. Market Analysis, Insights and Forecast - By Country/Sub-region
- 12.1.1. undefined
- 13. Middle East and Africa Intraoral Scanners Industry Analysis, Insights and Forecast, 2019-2031
- 13.1. Market Analysis, Insights and Forecast - By Country/Sub-region
- 13.1.1. undefined
- 14. South America Intraoral Scanners Industry Analysis, Insights and Forecast, 2019-2031
- 14.1. Market Analysis, Insights and Forecast - By Country/Sub-region
- 14.1.1. undefined
- 15. Competitive Analysis
- 15.1. Global Market Share Analysis 2024
- 15.2. Company Profiles
- 15.2.1 Medit Corp
- 15.2.1.1. Overview
- 15.2.1.2. Products
- 15.2.1.3. SWOT Analysis
- 15.2.1.4. Recent Developments
- 15.2.1.5. Financials (Based on Availability)
- 15.2.2 Planmeca Oy
- 15.2.2.1. Overview
- 15.2.2.2. Products
- 15.2.2.3. SWOT Analysis
- 15.2.2.4. Recent Developments
- 15.2.2.5. Financials (Based on Availability)
- 15.2.3 3Shape A/S
- 15.2.3.1. Overview
- 15.2.3.2. Products
- 15.2.3.3. SWOT Analysis
- 15.2.3.4. Recent Developments
- 15.2.3.5. Financials (Based on Availability)
- 15.2.4 BLZ Dental
- 15.2.4.1. Overview
- 15.2.4.2. Products
- 15.2.4.3. SWOT Analysis
- 15.2.4.4. Recent Developments
- 15.2.4.5. Financials (Based on Availability)
- 15.2.5 Guangdong Launca Medical Device Technology Co Ltd
- 15.2.5.1. Overview
- 15.2.5.2. Products
- 15.2.5.3. SWOT Analysis
- 15.2.5.4. Recent Developments
- 15.2.5.5. Financials (Based on Availability)
- 15.2.6 Densys Ltd
- 15.2.6.1. Overview
- 15.2.6.2. Products
- 15.2.6.3. SWOT Analysis
- 15.2.6.4. Recent Developments
- 15.2.6.5. Financials (Based on Availability)
- 15.2.7 Condor Technologies NV
- 15.2.7.1. Overview
- 15.2.7.2. Products
- 15.2.7.3. SWOT Analysis
- 15.2.7.4. Recent Developments
- 15.2.7.5. Financials (Based on Availability)
- 15.2.8 Dentsply Sirona Inc
- 15.2.8.1. Overview
- 15.2.8.2. Products
- 15.2.8.3. SWOT Analysis
- 15.2.8.4. Recent Developments
- 15.2.8.5. Financials (Based on Availability)
- 15.2.9 Align Technology Inc
- 15.2.9.1. Overview
- 15.2.9.2. Products
- 15.2.9.3. SWOT Analysis
- 15.2.9.4. Recent Developments
- 15.2.9.5. Financials (Based on Availability)
- 15.2.10 Institut Straumann AG
- 15.2.10.1. Overview
- 15.2.10.2. Products
- 15.2.10.3. SWOT Analysis
- 15.2.10.4. Recent Developments
- 15.2.10.5. Financials (Based on Availability)
- 15.2.1 Medit Corp
List of Figures
- Figure 1: Global Intraoral Scanners Industry Revenue Breakdown (Million, %) by Region 2024 & 2032
- Figure 2: Global Intraoral Scanners Industry Volume Breakdown (K Unit, %) by Region 2024 & 2032
- Figure 3: North America Intraoral Scanners Industry Revenue (Million), by Country 2024 & 2032
- Figure 4: North America Intraoral Scanners Industry Volume (K Unit), by Country 2024 & 2032
- Figure 5: North America Intraoral Scanners Industry Revenue Share (%), by Country 2024 & 2032
- Figure 6: North America Intraoral Scanners Industry Volume Share (%), by Country 2024 & 2032
- Figure 7: Europe Intraoral Scanners Industry Revenue (Million), by Country 2024 & 2032
- Figure 8: Europe Intraoral Scanners Industry Volume (K Unit), by Country 2024 & 2032
- Figure 9: Europe Intraoral Scanners Industry Revenue Share (%), by Country 2024 & 2032
- Figure 10: Europe Intraoral Scanners Industry Volume Share (%), by Country 2024 & 2032
- Figure 11: Middle East and Africa Intraoral Scanners Industry Revenue (Million), by Country 2024 & 2032
- Figure 12: Middle East and Africa Intraoral Scanners Industry Volume (K Unit), by Country 2024 & 2032
- Figure 13: Middle East and Africa Intraoral Scanners Industry Revenue Share (%), by Country 2024 & 2032
- Figure 14: Middle East and Africa Intraoral Scanners Industry Volume Share (%), by Country 2024 & 2032
- Figure 15: South America Intraoral Scanners Industry Revenue (Million), by Country 2024 & 2032
- Figure 16: South America Intraoral Scanners Industry Volume (K Unit), by Country 2024 & 2032
- Figure 17: South America Intraoral Scanners Industry Revenue Share (%), by Country 2024 & 2032
- Figure 18: South America Intraoral Scanners Industry Volume Share (%), by Country 2024 & 2032
- Figure 19: North America Intraoral Scanners Industry Revenue (Million), by Modality 2024 & 2032
- Figure 20: North America Intraoral Scanners Industry Volume (K Unit), by Modality 2024 & 2032
- Figure 21: North America Intraoral Scanners Industry Revenue Share (%), by Modality 2024 & 2032
- Figure 22: North America Intraoral Scanners Industry Volume Share (%), by Modality 2024 & 2032
- Figure 23: North America Intraoral Scanners Industry Revenue (Million), by End User 2024 & 2032
- Figure 24: North America Intraoral Scanners Industry Volume (K Unit), by End User 2024 & 2032
- Figure 25: North America Intraoral Scanners Industry Revenue Share (%), by End User 2024 & 2032
- Figure 26: North America Intraoral Scanners Industry Volume Share (%), by End User 2024 & 2032
- Figure 27: North America Intraoral Scanners Industry Revenue (Million), by Country 2024 & 2032
- Figure 28: North America Intraoral Scanners Industry Volume (K Unit), by Country 2024 & 2032
- Figure 29: North America Intraoral Scanners Industry Revenue Share (%), by Country 2024 & 2032
- Figure 30: North America Intraoral Scanners Industry Volume Share (%), by Country 2024 & 2032
- Figure 31: Europe Intraoral Scanners Industry Revenue (Million), by Modality 2024 & 2032
- Figure 32: Europe Intraoral Scanners Industry Volume (K Unit), by Modality 2024 & 2032
- Figure 33: Europe Intraoral Scanners Industry Revenue Share (%), by Modality 2024 & 2032
- Figure 34: Europe Intraoral Scanners Industry Volume Share (%), by Modality 2024 & 2032
- Figure 35: Europe Intraoral Scanners Industry Revenue (Million), by End User 2024 & 2032
- Figure 36: Europe Intraoral Scanners Industry Volume (K Unit), by End User 2024 & 2032
- Figure 37: Europe Intraoral Scanners Industry Revenue Share (%), by End User 2024 & 2032
- Figure 38: Europe Intraoral Scanners Industry Volume Share (%), by End User 2024 & 2032
- Figure 39: Europe Intraoral Scanners Industry Revenue (Million), by Country 2024 & 2032
- Figure 40: Europe Intraoral Scanners Industry Volume (K Unit), by Country 2024 & 2032
- Figure 41: Europe Intraoral Scanners Industry Revenue Share (%), by Country 2024 & 2032
- Figure 42: Europe Intraoral Scanners Industry Volume Share (%), by Country 2024 & 2032
- Figure 43: Asia Pacific Intraoral Scanners Industry Revenue (Million), by Modality 2024 & 2032
- Figure 44: Asia Pacific Intraoral Scanners Industry Volume (K Unit), by Modality 2024 & 2032
- Figure 45: Asia Pacific Intraoral Scanners Industry Revenue Share (%), by Modality 2024 & 2032
- Figure 46: Asia Pacific Intraoral Scanners Industry Volume Share (%), by Modality 2024 & 2032
- Figure 47: Asia Pacific Intraoral Scanners Industry Revenue (Million), by End User 2024 & 2032
- Figure 48: Asia Pacific Intraoral Scanners Industry Volume (K Unit), by End User 2024 & 2032
- Figure 49: Asia Pacific Intraoral Scanners Industry Revenue Share (%), by End User 2024 & 2032
- Figure 50: Asia Pacific Intraoral Scanners Industry Volume Share (%), by End User 2024 & 2032
- Figure 51: Asia Pacific Intraoral Scanners Industry Revenue (Million), by Country 2024 & 2032
- Figure 52: Asia Pacific Intraoral Scanners Industry Volume (K Unit), by Country 2024 & 2032
- Figure 53: Asia Pacific Intraoral Scanners Industry Revenue Share (%), by Country 2024 & 2032
- Figure 54: Asia Pacific Intraoral Scanners Industry Volume Share (%), by Country 2024 & 2032
- Figure 55: Middle East and Africa Intraoral Scanners Industry Revenue (Million), by Modality 2024 & 2032
- Figure 56: Middle East and Africa Intraoral Scanners Industry Volume (K Unit), by Modality 2024 & 2032
- Figure 57: Middle East and Africa Intraoral Scanners Industry Revenue Share (%), by Modality 2024 & 2032
- Figure 58: Middle East and Africa Intraoral Scanners Industry Volume Share (%), by Modality 2024 & 2032
- Figure 59: Middle East and Africa Intraoral Scanners Industry Revenue (Million), by End User 2024 & 2032
- Figure 60: Middle East and Africa Intraoral Scanners Industry Volume (K Unit), by End User 2024 & 2032
- Figure 61: Middle East and Africa Intraoral Scanners Industry Revenue Share (%), by End User 2024 & 2032
- Figure 62: Middle East and Africa Intraoral Scanners Industry Volume Share (%), by End User 2024 & 2032
- Figure 63: Middle East and Africa Intraoral Scanners Industry Revenue (Million), by Country 2024 & 2032
- Figure 64: Middle East and Africa Intraoral Scanners Industry Volume (K Unit), by Country 2024 & 2032
- Figure 65: Middle East and Africa Intraoral Scanners Industry Revenue Share (%), by Country 2024 & 2032
- Figure 66: Middle East and Africa Intraoral Scanners Industry Volume Share (%), by Country 2024 & 2032
- Figure 67: South America Intraoral Scanners Industry Revenue (Million), by Modality 2024 & 2032
- Figure 68: South America Intraoral Scanners Industry Volume (K Unit), by Modality 2024 & 2032
- Figure 69: South America Intraoral Scanners Industry Revenue Share (%), by Modality 2024 & 2032
- Figure 70: South America Intraoral Scanners Industry Volume Share (%), by Modality 2024 & 2032
- Figure 71: South America Intraoral Scanners Industry Revenue (Million), by End User 2024 & 2032
- Figure 72: South America Intraoral Scanners Industry Volume (K Unit), by End User 2024 & 2032
- Figure 73: South America Intraoral Scanners Industry Revenue Share (%), by End User 2024 & 2032
- Figure 74: South America Intraoral Scanners Industry Volume Share (%), by End User 2024 & 2032
- Figure 75: South America Intraoral Scanners Industry Revenue (Million), by Country 2024 & 2032
- Figure 76: South America Intraoral Scanners Industry Volume (K Unit), by Country 2024 & 2032
- Figure 77: South America Intraoral Scanners Industry Revenue Share (%), by Country 2024 & 2032
- Figure 78: South America Intraoral Scanners Industry Volume Share (%), by Country 2024 & 2032
List of Tables
- Table 1: Global Intraoral Scanners Industry Revenue Million Forecast, by Region 2019 & 2032
- Table 2: Global Intraoral Scanners Industry Volume K Unit Forecast, by Region 2019 & 2032
- Table 3: Global Intraoral Scanners Industry Revenue Million Forecast, by Modality 2019 & 2032
- Table 4: Global Intraoral Scanners Industry Volume K Unit Forecast, by Modality 2019 & 2032
- Table 5: Global Intraoral Scanners Industry Revenue Million Forecast, by End User 2019 & 2032
- Table 6: Global Intraoral Scanners Industry Volume K Unit Forecast, by End User 2019 & 2032
- Table 7: Global Intraoral Scanners Industry Revenue Million Forecast, by Region 2019 & 2032
- Table 8: Global Intraoral Scanners Industry Volume K Unit Forecast, by Region 2019 & 2032
- Table 9: Global Intraoral Scanners Industry Revenue Million Forecast, by Country 2019 & 2032
- Table 10: Global Intraoral Scanners Industry Volume K Unit Forecast, by Country 2019 & 2032
- Table 11: Global Intraoral Scanners Industry Revenue Million Forecast, by Country 2019 & 2032
- Table 12: Global Intraoral Scanners Industry Volume K Unit Forecast, by Country 2019 & 2032
- Table 13: Global Intraoral Scanners Industry Revenue Million Forecast, by Country 2019 & 2032
- Table 14: Global Intraoral Scanners Industry Volume K Unit Forecast, by Country 2019 & 2032
- Table 15: Global Intraoral Scanners Industry Revenue Million Forecast, by Country 2019 & 2032
- Table 16: Global Intraoral Scanners Industry Volume K Unit Forecast, by Country 2019 & 2032
- Table 17: Global Intraoral Scanners Industry Revenue Million Forecast, by Modality 2019 & 2032
- Table 18: Global Intraoral Scanners Industry Volume K Unit Forecast, by Modality 2019 & 2032
- Table 19: Global Intraoral Scanners Industry Revenue Million Forecast, by End User 2019 & 2032
- Table 20: Global Intraoral Scanners Industry Volume K Unit Forecast, by End User 2019 & 2032
- Table 21: Global Intraoral Scanners Industry Revenue Million Forecast, by Country 2019 & 2032
- Table 22: Global Intraoral Scanners Industry Volume K Unit Forecast, by Country 2019 & 2032
- Table 23: United States Intraoral Scanners Industry Revenue (Million) Forecast, by Application 2019 & 2032
- Table 24: United States Intraoral Scanners Industry Volume (K Unit) Forecast, by Application 2019 & 2032
- Table 25: Canada Intraoral Scanners Industry Revenue (Million) Forecast, by Application 2019 & 2032
- Table 26: Canada Intraoral Scanners Industry Volume (K Unit) Forecast, by Application 2019 & 2032
- Table 27: Mexico Intraoral Scanners Industry Revenue (Million) Forecast, by Application 2019 & 2032
- Table 28: Mexico Intraoral Scanners Industry Volume (K Unit) Forecast, by Application 2019 & 2032
- Table 29: Global Intraoral Scanners Industry Revenue Million Forecast, by Modality 2019 & 2032
- Table 30: Global Intraoral Scanners Industry Volume K Unit Forecast, by Modality 2019 & 2032
- Table 31: Global Intraoral Scanners Industry Revenue Million Forecast, by End User 2019 & 2032
- Table 32: Global Intraoral Scanners Industry Volume K Unit Forecast, by End User 2019 & 2032
- Table 33: Global Intraoral Scanners Industry Revenue Million Forecast, by Country 2019 & 2032
- Table 34: Global Intraoral Scanners Industry Volume K Unit Forecast, by Country 2019 & 2032
- Table 35: Germany Intraoral Scanners Industry Revenue (Million) Forecast, by Application 2019 & 2032
- Table 36: Germany Intraoral Scanners Industry Volume (K Unit) Forecast, by Application 2019 & 2032
- Table 37: United Kingdom Intraoral Scanners Industry Revenue (Million) Forecast, by Application 2019 & 2032
- Table 38: United Kingdom Intraoral Scanners Industry Volume (K Unit) Forecast, by Application 2019 & 2032
- Table 39: France Intraoral Scanners Industry Revenue (Million) Forecast, by Application 2019 & 2032
- Table 40: France Intraoral Scanners Industry Volume (K Unit) Forecast, by Application 2019 & 2032
- Table 41: Italy Intraoral Scanners Industry Revenue (Million) Forecast, by Application 2019 & 2032
- Table 42: Italy Intraoral Scanners Industry Volume (K Unit) Forecast, by Application 2019 & 2032
- Table 43: Spain Intraoral Scanners Industry Revenue (Million) Forecast, by Application 2019 & 2032
- Table 44: Spain Intraoral Scanners Industry Volume (K Unit) Forecast, by Application 2019 & 2032
- Table 45: Rest of Europe Intraoral Scanners Industry Revenue (Million) Forecast, by Application 2019 & 2032
- Table 46: Rest of Europe Intraoral Scanners Industry Volume (K Unit) Forecast, by Application 2019 & 2032
- Table 47: Global Intraoral Scanners Industry Revenue Million Forecast, by Modality 2019 & 2032
- Table 48: Global Intraoral Scanners Industry Volume K Unit Forecast, by Modality 2019 & 2032
- Table 49: Global Intraoral Scanners Industry Revenue Million Forecast, by End User 2019 & 2032
- Table 50: Global Intraoral Scanners Industry Volume K Unit Forecast, by End User 2019 & 2032
- Table 51: Global Intraoral Scanners Industry Revenue Million Forecast, by Country 2019 & 2032
- Table 52: Global Intraoral Scanners Industry Volume K Unit Forecast, by Country 2019 & 2032
- Table 53: China Intraoral Scanners Industry Revenue (Million) Forecast, by Application 2019 & 2032
- Table 54: China Intraoral Scanners Industry Volume (K Unit) Forecast, by Application 2019 & 2032
- Table 55: Japan Intraoral Scanners Industry Revenue (Million) Forecast, by Application 2019 & 2032
- Table 56: Japan Intraoral Scanners Industry Volume (K Unit) Forecast, by Application 2019 & 2032
- Table 57: India Intraoral Scanners Industry Revenue (Million) Forecast, by Application 2019 & 2032
- Table 58: India Intraoral Scanners Industry Volume (K Unit) Forecast, by Application 2019 & 2032
- Table 59: Australia Intraoral Scanners Industry Revenue (Million) Forecast, by Application 2019 & 2032
- Table 60: Australia Intraoral Scanners Industry Volume (K Unit) Forecast, by Application 2019 & 2032
- Table 61: South Korea Intraoral Scanners Industry Revenue (Million) Forecast, by Application 2019 & 2032
- Table 62: South Korea Intraoral Scanners Industry Volume (K Unit) Forecast, by Application 2019 & 2032
- Table 63: Rest of Asia Pacific Intraoral Scanners Industry Revenue (Million) Forecast, by Application 2019 & 2032
- Table 64: Rest of Asia Pacific Intraoral Scanners Industry Volume (K Unit) Forecast, by Application 2019 & 2032
- Table 65: Global Intraoral Scanners Industry Revenue Million Forecast, by Modality 2019 & 2032
- Table 66: Global Intraoral Scanners Industry Volume K Unit Forecast, by Modality 2019 & 2032
- Table 67: Global Intraoral Scanners Industry Revenue Million Forecast, by End User 2019 & 2032
- Table 68: Global Intraoral Scanners Industry Volume K Unit Forecast, by End User 2019 & 2032
- Table 69: Global Intraoral Scanners Industry Revenue Million Forecast, by Country 2019 & 2032
- Table 70: Global Intraoral Scanners Industry Volume K Unit Forecast, by Country 2019 & 2032
- Table 71: GCC Intraoral Scanners Industry Revenue (Million) Forecast, by Application 2019 & 2032
- Table 72: GCC Intraoral Scanners Industry Volume (K Unit) Forecast, by Application 2019 & 2032
- Table 73: South Africa Intraoral Scanners Industry Revenue (Million) Forecast, by Application 2019 & 2032
- Table 74: South Africa Intraoral Scanners Industry Volume (K Unit) Forecast, by Application 2019 & 2032
- Table 75: Rest of Middle East and Africa Intraoral Scanners Industry Revenue (Million) Forecast, by Application 2019 & 2032
- Table 76: Rest of Middle East and Africa Intraoral Scanners Industry Volume (K Unit) Forecast, by Application 2019 & 2032
- Table 77: Global Intraoral Scanners Industry Revenue Million Forecast, by Modality 2019 & 2032
- Table 78: Global Intraoral Scanners Industry Volume K Unit Forecast, by Modality 2019 & 2032
- Table 79: Global Intraoral Scanners Industry Revenue Million Forecast, by End User 2019 & 2032
- Table 80: Global Intraoral Scanners Industry Volume K Unit Forecast, by End User 2019 & 2032
- Table 81: Global Intraoral Scanners Industry Revenue Million Forecast, by Country 2019 & 2032
- Table 82: Global Intraoral Scanners Industry Volume K Unit Forecast, by Country 2019 & 2032
- Table 83: Brazil Intraoral Scanners Industry Revenue (Million) Forecast, by Application 2019 & 2032
- Table 84: Brazil Intraoral Scanners Industry Volume (K Unit) Forecast, by Application 2019 & 2032
- Table 85: Argentina Intraoral Scanners Industry Revenue (Million) Forecast, by Application 2019 & 2032
- Table 86: Argentina Intraoral Scanners Industry Volume (K Unit) Forecast, by Application 2019 & 2032
- Table 87: Rest of South America Intraoral Scanners Industry Revenue (Million) Forecast, by Application 2019 & 2032
- Table 88: Rest of South America Intraoral Scanners Industry Volume (K Unit) Forecast, by Application 2019 & 2032
Frequently Asked Questions
1. What is the projected Compound Annual Growth Rate (CAGR) of the Intraoral Scanners Industry?
The projected CAGR is approximately 2.51%.
2. Which companies are prominent players in the Intraoral Scanners Industry?
Key companies in the market include Medit Corp, Planmeca Oy, 3Shape A/S, BLZ Dental, Guangdong Launca Medical Device Technology Co Ltd, Densys Ltd, Condor Technologies NV, Dentsply Sirona Inc, Align Technology Inc, Institut Straumann AG.
3. What are the main segments of the Intraoral Scanners Industry?
The market segments include Modality, End User.
4. Can you provide details about the market size?
The market size is estimated to be USD 710.70 Million as of 2022.
5. What are some drivers contributing to market growth?
Rapid Technological Advancements; Increase in Geriatric Population; Rise in Dental Disorders.
6. What are the notable trends driving market growth?
Standalone Devices Segment is Expected to Witness Strong Growth in The Coming Years.
7. Are there any restraints impacting market growth?
Lack of Skilled Professionals; High Cost of Intraoral Scanners.
8. Can you provide examples of recent developments in the market?
March 2023: Freqty Technology, a Chinese high-tech enterprise in the field of digital dentistry, launched the latest and smallest PANDA intra-oral scanner, the PANDA Smart, at the International Dental Show (IDS) in Germany in 2023.
9. What pricing options are available for accessing the report?
Pricing options include single-user, multi-user, and enterprise licenses priced at USD 4750, USD 5250, and USD 8750 respectively.
10. Is the market size provided in terms of value or volume?
The market size is provided in terms of value, measured in Million and volume, measured in K Unit.
11. Are there any specific market keywords associated with the report?
Yes, the market keyword associated with the report is "Intraoral Scanners Industry," which aids in identifying and referencing the specific market segment covered.
12. How do I determine which pricing option suits my needs best?
The pricing options vary based on user requirements and access needs. Individual users may opt for single-user licenses, while businesses requiring broader access may choose multi-user or enterprise licenses for cost-effective access to the report.
13. Are there any additional resources or data provided in the Intraoral Scanners Industry report?
While the report offers comprehensive insights, it's advisable to review the specific contents or supplementary materials provided to ascertain if additional resources or data are available.
14. How can I stay updated on further developments or reports in the Intraoral Scanners Industry?
To stay informed about further developments, trends, and reports in the Intraoral Scanners Industry, consider subscribing to industry newsletters, following relevant companies and organizations, or regularly checking reputable industry news sources and publications.
Methodology
Step 1 - Identification of Relevant Samples Size from Population Database


Step 2 - Approaches for Defining Global Market Size (Value, Volume* & Price*)

Note*: In applicable scenarios
Step 3 - Data Sources
Primary Research
- Web Analytics
- Survey Reports
- Research Institute
- Latest Research Reports
- Opinion Leaders
Secondary Research
- Annual Reports
- White Paper
- Latest Press Release
- Industry Association
- Paid Database
- Investor Presentations

Step 4 - Data Triangulation
Involves using different sources of information in order to increase the validity of a study
These sources are likely to be stakeholders in a program - participants, other researchers, program staff, other community members, and so on.
Then we put all data in single framework & apply various statistical tools to find out the dynamic on the market.
During the analysis stage, feedback from the stakeholder groups would be compared to determine areas of agreement as well as areas of divergence


