
Key Insights
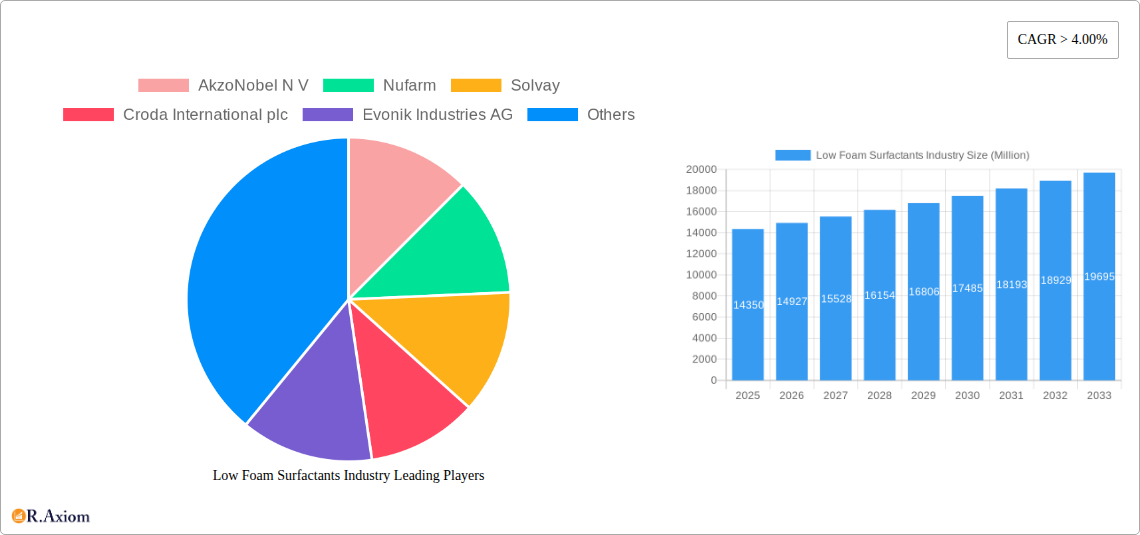
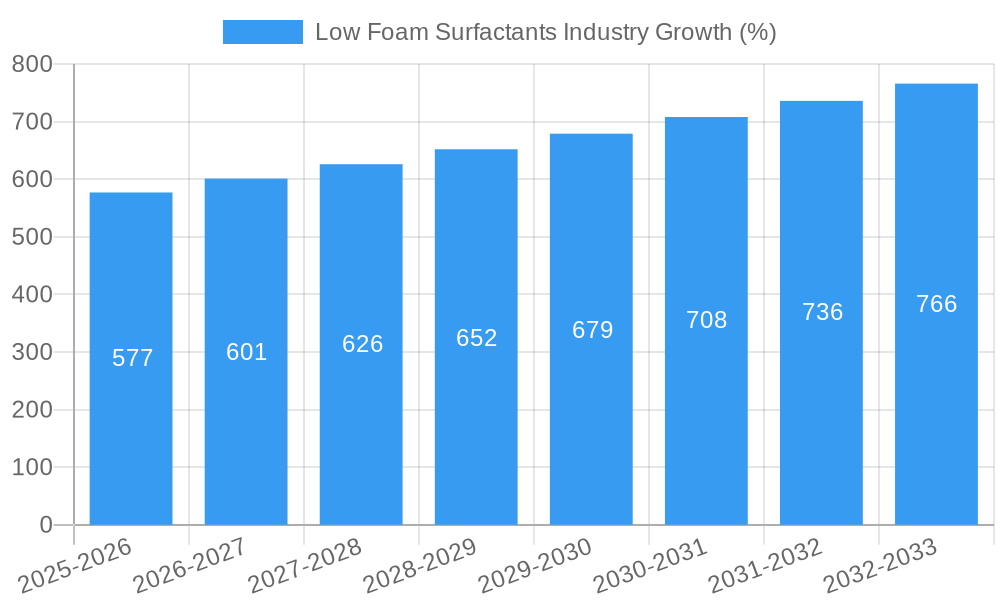
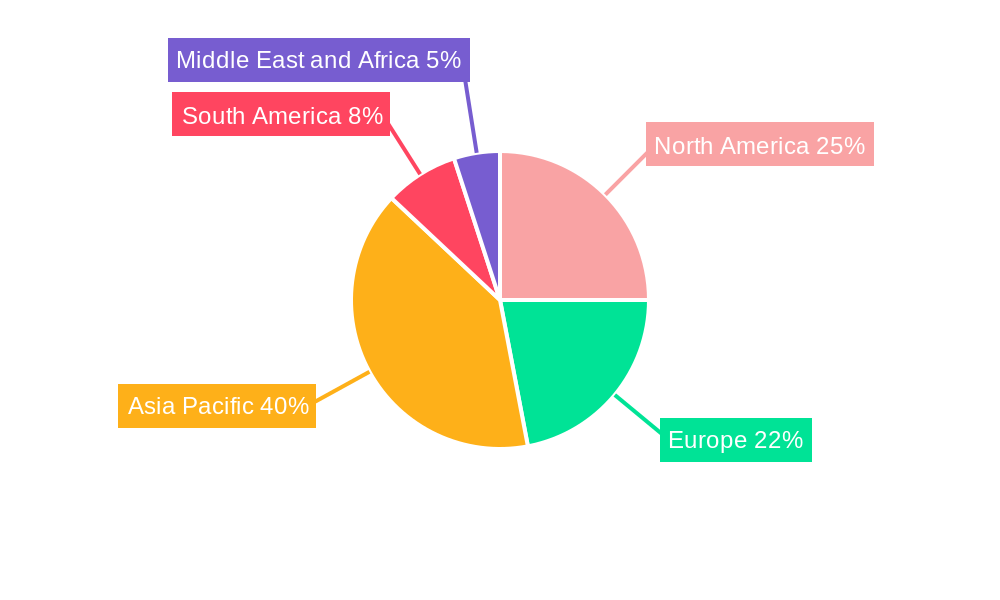
The low foam surfactants market, valued at $14.35 billion in 2025, is projected to experience robust growth, exhibiting a compound annual growth rate (CAGR) exceeding 4% from 2025 to 2033. This expansion is driven by several key factors. The increasing demand for efficient and environmentally friendly cleaning solutions across diverse industries, including detergents and cleaning agents, agrochemicals, and food processing, is a primary catalyst. Furthermore, the rising adoption of low-foam surfactants in specialized applications like metal cleaning and oilfield chemicals contributes significantly to market growth. Technological advancements leading to the development of high-performance, biodegradable low-foam surfactants further fuel this expansion. Stringent environmental regulations regarding foam control in wastewater treatment also create a favorable market landscape. Regional variations exist, with Asia Pacific, particularly China and India, expected to dominate due to rapid industrialization and expanding consumer base. North America and Europe also represent significant markets, driven by established industrial sectors and increasing awareness of sustainable cleaning practices. Competitive dynamics are shaped by a mix of established multinational corporations and specialized chemical manufacturers. The market segmentation by surfactant type (amphoteric, cationic, non-ionic) and end-user industry reflects the diverse applications and varying performance requirements.
The sustained growth trajectory of the low foam surfactants market is expected to continue throughout the forecast period. However, challenges remain. Fluctuations in raw material prices and potential supply chain disruptions can impact profitability. The market's future success will depend on ongoing innovation in surfactant chemistry to meet evolving industry needs, including enhanced biodegradability, improved performance in specific applications, and cost-effectiveness. Companies are likely to focus on strategic partnerships, mergers and acquisitions, and product diversification to maintain competitiveness and capitalize on the growing demand for sustainable and high-performance low-foam surfactants across various sectors globally.
Low Foam Surfactants Industry Market Report: 2019-2033
This comprehensive report provides an in-depth analysis of the Low Foam Surfactants industry, covering market size, growth drivers, key players, and future trends. The study period spans from 2019 to 2033, with 2025 serving as both the base and estimated year. The forecast period is 2025-2033, and the historical period encompasses 2019-2024. This report is essential for industry stakeholders, investors, and anyone seeking a detailed understanding of this dynamic market.
Low Foam Surfactants Industry Market Concentration & Innovation
The low foam surfactants market exhibits a moderately concentrated structure, with several major players holding significant market share. AkzoNobel N V, Nufarm, Solvay, Croda International plc, Evonik Industries AG, BASF SE, Huntsman International LLC, Dow, KAO CORPORATION, Oxiteno SA, Stepan Company, and Clariant AG are some of the key players. The market share of the top five companies is estimated at xx%, indicating a level of consolidation. However, the presence of numerous smaller players also signifies opportunities for market entry and expansion. Innovation is a key driver, with companies focusing on developing bio-based, high-performance, and environmentally friendly surfactants. This includes the development of novel formulations with improved cleaning efficacy and reduced environmental impact.
- Market Concentration: Top 5 companies hold an estimated xx% market share.
- Innovation Drivers: Development of bio-based surfactants, high-performance blends for specific applications (e.g., Dehypound M and Dehypound HDG from BASF SE), and focus on sustainability.
- Regulatory Frameworks: Stringent environmental regulations are driving the adoption of more sustainable surfactant technologies.
- Product Substitutes: Competition exists from other cleaning agents and technologies, impacting market share and pricing strategies.
- End-User Trends: Growing demand from various end-user industries like agrochemicals, detergents, and metal cleaning fuels market expansion.
- M&A Activities: The value of M&A deals in the industry during the historical period is estimated at $xx Million, with a predicted increase to $xx Million in the forecast period, reflecting industry consolidation.
Low Foam Surfactants Industry Industry Trends & Insights
The global low foam surfactants market is experiencing robust growth, driven by increasing demand from various end-use sectors. The Compound Annual Growth Rate (CAGR) during the forecast period (2025-2033) is projected to be xx%. Technological advancements, such as the development of bio-based and high-performance surfactants, are significantly impacting market dynamics. Consumer preferences are shifting towards environmentally friendly and sustainable products, which creates a significant opportunity for manufacturers who offer such products. Competitive dynamics are intense, with major players constantly innovating to maintain their market positions. Market penetration is steadily increasing across various segments, particularly in emerging economies. This growth is fueled by rising disposable incomes, increasing awareness of hygiene and cleanliness, and expansion of the industrial sector. The market penetration of low foam surfactants in detergents and cleaning agents is estimated to be xx% in 2025, with expectations to reach xx% by 2033.
Dominant Markets & Segments in Low Foam Surfactants Industry
The Detergents and Cleaning Agents segment is currently the dominant end-use industry for low foam surfactants, accounting for the largest market share globally. The Non-ionic type of low foam surfactants holds a leading position within the product type segment, driven by its versatility and cost-effectiveness. Geographically, North America and Europe are currently the leading regions, benefiting from robust industrial infrastructure and high consumer spending. However, Asia-Pacific is expected to show the fastest growth in the forecast period.
Key Drivers for Detergents and Cleaning Agents Segment:
- Increasing demand for effective and eco-friendly cleaning products.
- Growing consumer awareness of hygiene and sanitation.
- Technological advancements leading to superior product formulations.
Key Drivers for Non-ionic Type Segment:
- Cost-effectiveness compared to other types.
- Versatility and suitability for a wide range of applications.
- Wide availability and established supply chains.
Key Drivers for North America/Europe Regions:
- Established industrial infrastructure.
- High consumer spending power.
- Stringent environmental regulations driving adoption of eco-friendly products.
Key Drivers for Asia-Pacific Region (Growth):
- Rapid economic growth and industrialization.
- Rising disposable incomes.
- Expanding middle class with increasing demand for better living standards.
Low Foam Surfactants Industry Product Developments
Recent product innovations focus on enhancing performance, sustainability, and specific applications. Manufacturers are developing high-performance blends for multi-soil and multi-application cleaning, along with bio-based options to cater to the growing demand for eco-friendly products. This translates to competitive advantages through improved efficacy, reduced environmental footprint, and enhanced market appeal. Technological advancements in surfactant chemistry and formulation are driving the development of products with tailored properties, such as improved biodegradability, reduced toxicity, and enhanced cleaning power in specific applications.
Report Scope & Segmentation Analysis
This report segments the low foam surfactants market by type (Amphoteric, Cationic, Non-ionic) and end-user industry (Agrochemicals, Food and Dairy Process Cleaners, Detergents and Cleaning Agents, Pulp and Paper, Metal Cleaning and Metal Working Fluids, Oilfield Chemicals, Others). Each segment is analyzed in detail, including market size, growth projections, and competitive dynamics. The Non-ionic segment is projected to maintain its dominance due to its cost-effectiveness and versatility. The Detergents and Cleaning Agents segment is expected to continue as the leading end-user industry.
Key Drivers of Low Foam Surfactants Industry Growth
The low foam surfactants market is propelled by several key factors. Rising demand from various end-use sectors, particularly detergents and cleaning agents, fuels substantial growth. Technological advancements, such as the development of bio-based and high-performance surfactants, cater to the increasing demand for environmentally friendly products and enhanced cleaning efficacy. Stringent environmental regulations are driving the adoption of more sustainable and biodegradable surfactant technologies, further boosting market expansion.
Challenges in the Low Foam Surfactants Industry Sector
The industry faces challenges such as fluctuating raw material prices, impacting production costs and profitability. Competition from other cleaning agents and technologies creates pressure on pricing and market share. Stringent regulatory requirements related to environmental compliance and safety necessitate significant investments in research and development, posing a substantial hurdle for smaller players. Supply chain disruptions can lead to production delays and increased costs.
Emerging Opportunities in Low Foam Surfactants Industry
Emerging opportunities exist in developing bio-based and sustainable surfactants, aligning with the growing demand for eco-friendly products. Expansion into new and developing markets, particularly in Asia-Pacific, presents significant growth potential. Technological advancements in surfactant chemistry and formulation offer opportunities to create specialized products tailored for specific applications, enhancing both performance and market appeal.
Leading Players in the Low Foam Surfactants Industry Market
- AkzoNobel N V
- Nufarm
- Solvay
- Croda International plc
- Evonik Industries AG
- BASF SE
- Huntsman International LLC
- Dow
- KAO CORPORATION
- Oxiteno SA
- Stepan Company
- Clariant AG
Key Developments in Low Foam Surfactants Industry Industry
- February 2022: Clariant launched a 100% bio-based surfactant range, enhancing its sustainable product portfolio and responding to growing consumer demand for eco-friendly alternatives. This move significantly impacts market dynamics by increasing competition in the sustainable surfactant segment.
- April 2022: BASF SE expanded its product line with Dehypound M and Dehypound HDG, high-performance nonionic surfactant blends for multi-soil and multi-application cleaning. This strengthens BASF's position in the market by providing high-performance solutions to diverse cleaning applications.
Strategic Outlook for Low Foam Surfactants Industry Market
The low foam surfactants market is poised for continued growth, driven by increasing demand from various end-use sectors, technological innovation, and the shift towards sustainable and eco-friendly products. Companies focusing on research and development of bio-based and high-performance surfactants, coupled with strategic expansion into new markets, are well-positioned to capitalize on future growth opportunities. The market's positive trajectory is expected to continue throughout the forecast period, driven by the ongoing demand for efficient and sustainable cleaning solutions across diverse industries.
Low Foam Surfactants Industry Segmentation
-
1. Type
- 1.1. Amphoteric
- 1.2. Cationic
- 1.3. Non-ionic
-
2. End-user Industry
- 2.1. Agrochemicals
- 2.2. Food and Dairy Process Cleaners
- 2.3. Detergents and Cleaning Agents
- 2.4. Pulp and Paper
- 2.5. Metal Cleaning and Metal Working Fluids
- 2.6. Oilfield Chemicals
- 2.7. Others (Textiles, Personal care, etc.)
Low Foam Surfactants Industry Segmentation By Geography
-
1. Asia Pacific
- 1.1. China
- 1.2. India
- 1.3. Japan
- 1.4. South Korea
- 1.5. Rest of Asia Pacific
-
2. North America
- 2.1. United States
- 2.2. Canada
- 2.3. Mexico
-
3. Europe
- 3.1. Germany
- 3.2. United Kingdom
- 3.3. Italy
- 3.4. France
- 3.5. Rest of Europe
-
4. South America
- 4.1. Brazil
- 4.2. Argentina
- 4.3. Rest of South America
-
5. Middle East and Africa
- 5.1. Saudi Arabia
- 5.2. South Africa
- 5.3. Rest of Middle East and Africa
Low Foam Surfactants Industry REPORT HIGHLIGHTS
| Aspects | Details |
|---|---|
| Study Period | 2019-2033 |
| Base Year | 2024 |
| Estimated Year | 2025 |
| Forecast Period | 2025-2033 |
| Historical Period | 2019-2024 |
| Growth Rate | CAGR of > 4.00% from 2019-2033 |
| Segmentation |
|
Table of Contents
- 1. Introduction
- 1.1. Research Scope
- 1.2. Market Segmentation
- 1.3. Research Methodology
- 1.4. Definitions and Assumptions
- 2. Executive Summary
- 2.1. Introduction
- 3. Market Dynamics
- 3.1. Introduction
- 3.2. Market Drivers
- 3.2.1. Significant Growth in Detergents and Cleaning Agents; Increased Demand for Sustainable Surfactants; The rising demand for personal care products
- 3.3. Market Restrains
- 3.3.1. The Stringent Enviornmental Regulations; The Availability of Other Substitutes
- 3.4. Market Trends
- 3.4.1. Detergents and Cleaning Agents End-user Industry Segment to Dominate the Market
- 4. Market Factor Analysis
- 4.1. Porters Five Forces
- 4.2. Supply/Value Chain
- 4.3. PESTEL analysis
- 4.4. Market Entropy
- 4.5. Patent/Trademark Analysis
- 5. Global Low Foam Surfactants Industry Analysis, Insights and Forecast, 2019-2031
- 5.1. Market Analysis, Insights and Forecast - by Type
- 5.1.1. Amphoteric
- 5.1.2. Cationic
- 5.1.3. Non-ionic
- 5.2. Market Analysis, Insights and Forecast - by End-user Industry
- 5.2.1. Agrochemicals
- 5.2.2. Food and Dairy Process Cleaners
- 5.2.3. Detergents and Cleaning Agents
- 5.2.4. Pulp and Paper
- 5.2.5. Metal Cleaning and Metal Working Fluids
- 5.2.6. Oilfield Chemicals
- 5.2.7. Others (Textiles, Personal care, etc.)
- 5.3. Market Analysis, Insights and Forecast - by Region
- 5.3.1. Asia Pacific
- 5.3.2. North America
- 5.3.3. Europe
- 5.3.4. South America
- 5.3.5. Middle East and Africa
- 5.1. Market Analysis, Insights and Forecast - by Type
- 6. Asia Pacific Low Foam Surfactants Industry Analysis, Insights and Forecast, 2019-2031
- 6.1. Market Analysis, Insights and Forecast - by Type
- 6.1.1. Amphoteric
- 6.1.2. Cationic
- 6.1.3. Non-ionic
- 6.2. Market Analysis, Insights and Forecast - by End-user Industry
- 6.2.1. Agrochemicals
- 6.2.2. Food and Dairy Process Cleaners
- 6.2.3. Detergents and Cleaning Agents
- 6.2.4. Pulp and Paper
- 6.2.5. Metal Cleaning and Metal Working Fluids
- 6.2.6. Oilfield Chemicals
- 6.2.7. Others (Textiles, Personal care, etc.)
- 6.1. Market Analysis, Insights and Forecast - by Type
- 7. North America Low Foam Surfactants Industry Analysis, Insights and Forecast, 2019-2031
- 7.1. Market Analysis, Insights and Forecast - by Type
- 7.1.1. Amphoteric
- 7.1.2. Cationic
- 7.1.3. Non-ionic
- 7.2. Market Analysis, Insights and Forecast - by End-user Industry
- 7.2.1. Agrochemicals
- 7.2.2. Food and Dairy Process Cleaners
- 7.2.3. Detergents and Cleaning Agents
- 7.2.4. Pulp and Paper
- 7.2.5. Metal Cleaning and Metal Working Fluids
- 7.2.6. Oilfield Chemicals
- 7.2.7. Others (Textiles, Personal care, etc.)
- 7.1. Market Analysis, Insights and Forecast - by Type
- 8. Europe Low Foam Surfactants Industry Analysis, Insights and Forecast, 2019-2031
- 8.1. Market Analysis, Insights and Forecast - by Type
- 8.1.1. Amphoteric
- 8.1.2. Cationic
- 8.1.3. Non-ionic
- 8.2. Market Analysis, Insights and Forecast - by End-user Industry
- 8.2.1. Agrochemicals
- 8.2.2. Food and Dairy Process Cleaners
- 8.2.3. Detergents and Cleaning Agents
- 8.2.4. Pulp and Paper
- 8.2.5. Metal Cleaning and Metal Working Fluids
- 8.2.6. Oilfield Chemicals
- 8.2.7. Others (Textiles, Personal care, etc.)
- 8.1. Market Analysis, Insights and Forecast - by Type
- 9. South America Low Foam Surfactants Industry Analysis, Insights and Forecast, 2019-2031
- 9.1. Market Analysis, Insights and Forecast - by Type
- 9.1.1. Amphoteric
- 9.1.2. Cationic
- 9.1.3. Non-ionic
- 9.2. Market Analysis, Insights and Forecast - by End-user Industry
- 9.2.1. Agrochemicals
- 9.2.2. Food and Dairy Process Cleaners
- 9.2.3. Detergents and Cleaning Agents
- 9.2.4. Pulp and Paper
- 9.2.5. Metal Cleaning and Metal Working Fluids
- 9.2.6. Oilfield Chemicals
- 9.2.7. Others (Textiles, Personal care, etc.)
- 9.1. Market Analysis, Insights and Forecast - by Type
- 10. Middle East and Africa Low Foam Surfactants Industry Analysis, Insights and Forecast, 2019-2031
- 10.1. Market Analysis, Insights and Forecast - by Type
- 10.1.1. Amphoteric
- 10.1.2. Cationic
- 10.1.3. Non-ionic
- 10.2. Market Analysis, Insights and Forecast - by End-user Industry
- 10.2.1. Agrochemicals
- 10.2.2. Food and Dairy Process Cleaners
- 10.2.3. Detergents and Cleaning Agents
- 10.2.4. Pulp and Paper
- 10.2.5. Metal Cleaning and Metal Working Fluids
- 10.2.6. Oilfield Chemicals
- 10.2.7. Others (Textiles, Personal care, etc.)
- 10.1. Market Analysis, Insights and Forecast - by Type
- 11. Asia Pacific Low Foam Surfactants Industry Analysis, Insights and Forecast, 2019-2031
- 11.1. Market Analysis, Insights and Forecast - By Country/Sub-region
- 11.1.1 China
- 11.1.2 India
- 11.1.3 Japan
- 11.1.4 South Korea
- 11.1.5 Rest of Asia Pacific
- 12. North America Low Foam Surfactants Industry Analysis, Insights and Forecast, 2019-2031
- 12.1. Market Analysis, Insights and Forecast - By Country/Sub-region
- 12.1.1 United States
- 12.1.2 Canada
- 12.1.3 Mexico
- 13. Europe Low Foam Surfactants Industry Analysis, Insights and Forecast, 2019-2031
- 13.1. Market Analysis, Insights and Forecast - By Country/Sub-region
- 13.1.1 Germany
- 13.1.2 United Kingdom
- 13.1.3 Italy
- 13.1.4 France
- 13.1.5 Rest of Europe
- 14. South America Low Foam Surfactants Industry Analysis, Insights and Forecast, 2019-2031
- 14.1. Market Analysis, Insights and Forecast - By Country/Sub-region
- 14.1.1 Brazil
- 14.1.2 Argentina
- 14.1.3 Rest of South America
- 15. Middle East and Africa Low Foam Surfactants Industry Analysis, Insights and Forecast, 2019-2031
- 15.1. Market Analysis, Insights and Forecast - By Country/Sub-region
- 15.1.1 Saudi Arabia
- 15.1.2 South Africa
- 15.1.3 Rest of Middle East and Africa
- 16. Competitive Analysis
- 16.1. Global Market Share Analysis 2024
- 16.2. Company Profiles
- 16.2.1 AkzoNobel N V
- 16.2.1.1. Overview
- 16.2.1.2. Products
- 16.2.1.3. SWOT Analysis
- 16.2.1.4. Recent Developments
- 16.2.1.5. Financials (Based on Availability)
- 16.2.2 Nufarm
- 16.2.2.1. Overview
- 16.2.2.2. Products
- 16.2.2.3. SWOT Analysis
- 16.2.2.4. Recent Developments
- 16.2.2.5. Financials (Based on Availability)
- 16.2.3 Solvay
- 16.2.3.1. Overview
- 16.2.3.2. Products
- 16.2.3.3. SWOT Analysis
- 16.2.3.4. Recent Developments
- 16.2.3.5. Financials (Based on Availability)
- 16.2.4 Croda International plc
- 16.2.4.1. Overview
- 16.2.4.2. Products
- 16.2.4.3. SWOT Analysis
- 16.2.4.4. Recent Developments
- 16.2.4.5. Financials (Based on Availability)
- 16.2.5 Evonik Industries AG
- 16.2.5.1. Overview
- 16.2.5.2. Products
- 16.2.5.3. SWOT Analysis
- 16.2.5.4. Recent Developments
- 16.2.5.5. Financials (Based on Availability)
- 16.2.6 BASF SE
- 16.2.6.1. Overview
- 16.2.6.2. Products
- 16.2.6.3. SWOT Analysis
- 16.2.6.4. Recent Developments
- 16.2.6.5. Financials (Based on Availability)
- 16.2.7 Huntsman International LLC
- 16.2.7.1. Overview
- 16.2.7.2. Products
- 16.2.7.3. SWOT Analysis
- 16.2.7.4. Recent Developments
- 16.2.7.5. Financials (Based on Availability)
- 16.2.8 Dow
- 16.2.8.1. Overview
- 16.2.8.2. Products
- 16.2.8.3. SWOT Analysis
- 16.2.8.4. Recent Developments
- 16.2.8.5. Financials (Based on Availability)
- 16.2.9 KAO CORPORATION
- 16.2.9.1. Overview
- 16.2.9.2. Products
- 16.2.9.3. SWOT Analysis
- 16.2.9.4. Recent Developments
- 16.2.9.5. Financials (Based on Availability)
- 16.2.10 Oxiteno SA
- 16.2.10.1. Overview
- 16.2.10.2. Products
- 16.2.10.3. SWOT Analysis
- 16.2.10.4. Recent Developments
- 16.2.10.5. Financials (Based on Availability)
- 16.2.11 Stepan Company*List Not Exhaustive
- 16.2.11.1. Overview
- 16.2.11.2. Products
- 16.2.11.3. SWOT Analysis
- 16.2.11.4. Recent Developments
- 16.2.11.5. Financials (Based on Availability)
- 16.2.12 Clariant AG
- 16.2.12.1. Overview
- 16.2.12.2. Products
- 16.2.12.3. SWOT Analysis
- 16.2.12.4. Recent Developments
- 16.2.12.5. Financials (Based on Availability)
- 16.2.1 AkzoNobel N V
List of Figures
- Figure 1: Global Low Foam Surfactants Industry Revenue Breakdown (Million, %) by Region 2024 & 2032
- Figure 2: Global Low Foam Surfactants Industry Volume Breakdown (liter , %) by Region 2024 & 2032
- Figure 3: Asia Pacific Low Foam Surfactants Industry Revenue (Million), by Country 2024 & 2032
- Figure 4: Asia Pacific Low Foam Surfactants Industry Volume (liter ), by Country 2024 & 2032
- Figure 5: Asia Pacific Low Foam Surfactants Industry Revenue Share (%), by Country 2024 & 2032
- Figure 6: Asia Pacific Low Foam Surfactants Industry Volume Share (%), by Country 2024 & 2032
- Figure 7: North America Low Foam Surfactants Industry Revenue (Million), by Country 2024 & 2032
- Figure 8: North America Low Foam Surfactants Industry Volume (liter ), by Country 2024 & 2032
- Figure 9: North America Low Foam Surfactants Industry Revenue Share (%), by Country 2024 & 2032
- Figure 10: North America Low Foam Surfactants Industry Volume Share (%), by Country 2024 & 2032
- Figure 11: Europe Low Foam Surfactants Industry Revenue (Million), by Country 2024 & 2032
- Figure 12: Europe Low Foam Surfactants Industry Volume (liter ), by Country 2024 & 2032
- Figure 13: Europe Low Foam Surfactants Industry Revenue Share (%), by Country 2024 & 2032
- Figure 14: Europe Low Foam Surfactants Industry Volume Share (%), by Country 2024 & 2032
- Figure 15: South America Low Foam Surfactants Industry Revenue (Million), by Country 2024 & 2032
- Figure 16: South America Low Foam Surfactants Industry Volume (liter ), by Country 2024 & 2032
- Figure 17: South America Low Foam Surfactants Industry Revenue Share (%), by Country 2024 & 2032
- Figure 18: South America Low Foam Surfactants Industry Volume Share (%), by Country 2024 & 2032
- Figure 19: Middle East and Africa Low Foam Surfactants Industry Revenue (Million), by Country 2024 & 2032
- Figure 20: Middle East and Africa Low Foam Surfactants Industry Volume (liter ), by Country 2024 & 2032
- Figure 21: Middle East and Africa Low Foam Surfactants Industry Revenue Share (%), by Country 2024 & 2032
- Figure 22: Middle East and Africa Low Foam Surfactants Industry Volume Share (%), by Country 2024 & 2032
- Figure 23: Asia Pacific Low Foam Surfactants Industry Revenue (Million), by Type 2024 & 2032
- Figure 24: Asia Pacific Low Foam Surfactants Industry Volume (liter ), by Type 2024 & 2032
- Figure 25: Asia Pacific Low Foam Surfactants Industry Revenue Share (%), by Type 2024 & 2032
- Figure 26: Asia Pacific Low Foam Surfactants Industry Volume Share (%), by Type 2024 & 2032
- Figure 27: Asia Pacific Low Foam Surfactants Industry Revenue (Million), by End-user Industry 2024 & 2032
- Figure 28: Asia Pacific Low Foam Surfactants Industry Volume (liter ), by End-user Industry 2024 & 2032
- Figure 29: Asia Pacific Low Foam Surfactants Industry Revenue Share (%), by End-user Industry 2024 & 2032
- Figure 30: Asia Pacific Low Foam Surfactants Industry Volume Share (%), by End-user Industry 2024 & 2032
- Figure 31: Asia Pacific Low Foam Surfactants Industry Revenue (Million), by Country 2024 & 2032
- Figure 32: Asia Pacific Low Foam Surfactants Industry Volume (liter ), by Country 2024 & 2032
- Figure 33: Asia Pacific Low Foam Surfactants Industry Revenue Share (%), by Country 2024 & 2032
- Figure 34: Asia Pacific Low Foam Surfactants Industry Volume Share (%), by Country 2024 & 2032
- Figure 35: North America Low Foam Surfactants Industry Revenue (Million), by Type 2024 & 2032
- Figure 36: North America Low Foam Surfactants Industry Volume (liter ), by Type 2024 & 2032
- Figure 37: North America Low Foam Surfactants Industry Revenue Share (%), by Type 2024 & 2032
- Figure 38: North America Low Foam Surfactants Industry Volume Share (%), by Type 2024 & 2032
- Figure 39: North America Low Foam Surfactants Industry Revenue (Million), by End-user Industry 2024 & 2032
- Figure 40: North America Low Foam Surfactants Industry Volume (liter ), by End-user Industry 2024 & 2032
- Figure 41: North America Low Foam Surfactants Industry Revenue Share (%), by End-user Industry 2024 & 2032
- Figure 42: North America Low Foam Surfactants Industry Volume Share (%), by End-user Industry 2024 & 2032
- Figure 43: North America Low Foam Surfactants Industry Revenue (Million), by Country 2024 & 2032
- Figure 44: North America Low Foam Surfactants Industry Volume (liter ), by Country 2024 & 2032
- Figure 45: North America Low Foam Surfactants Industry Revenue Share (%), by Country 2024 & 2032
- Figure 46: North America Low Foam Surfactants Industry Volume Share (%), by Country 2024 & 2032
- Figure 47: Europe Low Foam Surfactants Industry Revenue (Million), by Type 2024 & 2032
- Figure 48: Europe Low Foam Surfactants Industry Volume (liter ), by Type 2024 & 2032
- Figure 49: Europe Low Foam Surfactants Industry Revenue Share (%), by Type 2024 & 2032
- Figure 50: Europe Low Foam Surfactants Industry Volume Share (%), by Type 2024 & 2032
- Figure 51: Europe Low Foam Surfactants Industry Revenue (Million), by End-user Industry 2024 & 2032
- Figure 52: Europe Low Foam Surfactants Industry Volume (liter ), by End-user Industry 2024 & 2032
- Figure 53: Europe Low Foam Surfactants Industry Revenue Share (%), by End-user Industry 2024 & 2032
- Figure 54: Europe Low Foam Surfactants Industry Volume Share (%), by End-user Industry 2024 & 2032
- Figure 55: Europe Low Foam Surfactants Industry Revenue (Million), by Country 2024 & 2032
- Figure 56: Europe Low Foam Surfactants Industry Volume (liter ), by Country 2024 & 2032
- Figure 57: Europe Low Foam Surfactants Industry Revenue Share (%), by Country 2024 & 2032
- Figure 58: Europe Low Foam Surfactants Industry Volume Share (%), by Country 2024 & 2032
- Figure 59: South America Low Foam Surfactants Industry Revenue (Million), by Type 2024 & 2032
- Figure 60: South America Low Foam Surfactants Industry Volume (liter ), by Type 2024 & 2032
- Figure 61: South America Low Foam Surfactants Industry Revenue Share (%), by Type 2024 & 2032
- Figure 62: South America Low Foam Surfactants Industry Volume Share (%), by Type 2024 & 2032
- Figure 63: South America Low Foam Surfactants Industry Revenue (Million), by End-user Industry 2024 & 2032
- Figure 64: South America Low Foam Surfactants Industry Volume (liter ), by End-user Industry 2024 & 2032
- Figure 65: South America Low Foam Surfactants Industry Revenue Share (%), by End-user Industry 2024 & 2032
- Figure 66: South America Low Foam Surfactants Industry Volume Share (%), by End-user Industry 2024 & 2032
- Figure 67: South America Low Foam Surfactants Industry Revenue (Million), by Country 2024 & 2032
- Figure 68: South America Low Foam Surfactants Industry Volume (liter ), by Country 2024 & 2032
- Figure 69: South America Low Foam Surfactants Industry Revenue Share (%), by Country 2024 & 2032
- Figure 70: South America Low Foam Surfactants Industry Volume Share (%), by Country 2024 & 2032
- Figure 71: Middle East and Africa Low Foam Surfactants Industry Revenue (Million), by Type 2024 & 2032
- Figure 72: Middle East and Africa Low Foam Surfactants Industry Volume (liter ), by Type 2024 & 2032
- Figure 73: Middle East and Africa Low Foam Surfactants Industry Revenue Share (%), by Type 2024 & 2032
- Figure 74: Middle East and Africa Low Foam Surfactants Industry Volume Share (%), by Type 2024 & 2032
- Figure 75: Middle East and Africa Low Foam Surfactants Industry Revenue (Million), by End-user Industry 2024 & 2032
- Figure 76: Middle East and Africa Low Foam Surfactants Industry Volume (liter ), by End-user Industry 2024 & 2032
- Figure 77: Middle East and Africa Low Foam Surfactants Industry Revenue Share (%), by End-user Industry 2024 & 2032
- Figure 78: Middle East and Africa Low Foam Surfactants Industry Volume Share (%), by End-user Industry 2024 & 2032
- Figure 79: Middle East and Africa Low Foam Surfactants Industry Revenue (Million), by Country 2024 & 2032
- Figure 80: Middle East and Africa Low Foam Surfactants Industry Volume (liter ), by Country 2024 & 2032
- Figure 81: Middle East and Africa Low Foam Surfactants Industry Revenue Share (%), by Country 2024 & 2032
- Figure 82: Middle East and Africa Low Foam Surfactants Industry Volume Share (%), by Country 2024 & 2032
List of Tables
- Table 1: Global Low Foam Surfactants Industry Revenue Million Forecast, by Region 2019 & 2032
- Table 2: Global Low Foam Surfactants Industry Volume liter Forecast, by Region 2019 & 2032
- Table 3: Global Low Foam Surfactants Industry Revenue Million Forecast, by Type 2019 & 2032
- Table 4: Global Low Foam Surfactants Industry Volume liter Forecast, by Type 2019 & 2032
- Table 5: Global Low Foam Surfactants Industry Revenue Million Forecast, by End-user Industry 2019 & 2032
- Table 6: Global Low Foam Surfactants Industry Volume liter Forecast, by End-user Industry 2019 & 2032
- Table 7: Global Low Foam Surfactants Industry Revenue Million Forecast, by Region 2019 & 2032
- Table 8: Global Low Foam Surfactants Industry Volume liter Forecast, by Region 2019 & 2032
- Table 9: Global Low Foam Surfactants Industry Revenue Million Forecast, by Country 2019 & 2032
- Table 10: Global Low Foam Surfactants Industry Volume liter Forecast, by Country 2019 & 2032
- Table 11: China Low Foam Surfactants Industry Revenue (Million) Forecast, by Application 2019 & 2032
- Table 12: China Low Foam Surfactants Industry Volume (liter ) Forecast, by Application 2019 & 2032
- Table 13: India Low Foam Surfactants Industry Revenue (Million) Forecast, by Application 2019 & 2032
- Table 14: India Low Foam Surfactants Industry Volume (liter ) Forecast, by Application 2019 & 2032
- Table 15: Japan Low Foam Surfactants Industry Revenue (Million) Forecast, by Application 2019 & 2032
- Table 16: Japan Low Foam Surfactants Industry Volume (liter ) Forecast, by Application 2019 & 2032
- Table 17: South Korea Low Foam Surfactants Industry Revenue (Million) Forecast, by Application 2019 & 2032
- Table 18: South Korea Low Foam Surfactants Industry Volume (liter ) Forecast, by Application 2019 & 2032
- Table 19: Rest of Asia Pacific Low Foam Surfactants Industry Revenue (Million) Forecast, by Application 2019 & 2032
- Table 20: Rest of Asia Pacific Low Foam Surfactants Industry Volume (liter ) Forecast, by Application 2019 & 2032
- Table 21: Global Low Foam Surfactants Industry Revenue Million Forecast, by Country 2019 & 2032
- Table 22: Global Low Foam Surfactants Industry Volume liter Forecast, by Country 2019 & 2032
- Table 23: United States Low Foam Surfactants Industry Revenue (Million) Forecast, by Application 2019 & 2032
- Table 24: United States Low Foam Surfactants Industry Volume (liter ) Forecast, by Application 2019 & 2032
- Table 25: Canada Low Foam Surfactants Industry Revenue (Million) Forecast, by Application 2019 & 2032
- Table 26: Canada Low Foam Surfactants Industry Volume (liter ) Forecast, by Application 2019 & 2032
- Table 27: Mexico Low Foam Surfactants Industry Revenue (Million) Forecast, by Application 2019 & 2032
- Table 28: Mexico Low Foam Surfactants Industry Volume (liter ) Forecast, by Application 2019 & 2032
- Table 29: Global Low Foam Surfactants Industry Revenue Million Forecast, by Country 2019 & 2032
- Table 30: Global Low Foam Surfactants Industry Volume liter Forecast, by Country 2019 & 2032
- Table 31: Germany Low Foam Surfactants Industry Revenue (Million) Forecast, by Application 2019 & 2032
- Table 32: Germany Low Foam Surfactants Industry Volume (liter ) Forecast, by Application 2019 & 2032
- Table 33: United Kingdom Low Foam Surfactants Industry Revenue (Million) Forecast, by Application 2019 & 2032
- Table 34: United Kingdom Low Foam Surfactants Industry Volume (liter ) Forecast, by Application 2019 & 2032
- Table 35: Italy Low Foam Surfactants Industry Revenue (Million) Forecast, by Application 2019 & 2032
- Table 36: Italy Low Foam Surfactants Industry Volume (liter ) Forecast, by Application 2019 & 2032
- Table 37: France Low Foam Surfactants Industry Revenue (Million) Forecast, by Application 2019 & 2032
- Table 38: France Low Foam Surfactants Industry Volume (liter ) Forecast, by Application 2019 & 2032
- Table 39: Rest of Europe Low Foam Surfactants Industry Revenue (Million) Forecast, by Application 2019 & 2032
- Table 40: Rest of Europe Low Foam Surfactants Industry Volume (liter ) Forecast, by Application 2019 & 2032
- Table 41: Global Low Foam Surfactants Industry Revenue Million Forecast, by Country 2019 & 2032
- Table 42: Global Low Foam Surfactants Industry Volume liter Forecast, by Country 2019 & 2032
- Table 43: Brazil Low Foam Surfactants Industry Revenue (Million) Forecast, by Application 2019 & 2032
- Table 44: Brazil Low Foam Surfactants Industry Volume (liter ) Forecast, by Application 2019 & 2032
- Table 45: Argentina Low Foam Surfactants Industry Revenue (Million) Forecast, by Application 2019 & 2032
- Table 46: Argentina Low Foam Surfactants Industry Volume (liter ) Forecast, by Application 2019 & 2032
- Table 47: Rest of South America Low Foam Surfactants Industry Revenue (Million) Forecast, by Application 2019 & 2032
- Table 48: Rest of South America Low Foam Surfactants Industry Volume (liter ) Forecast, by Application 2019 & 2032
- Table 49: Global Low Foam Surfactants Industry Revenue Million Forecast, by Country 2019 & 2032
- Table 50: Global Low Foam Surfactants Industry Volume liter Forecast, by Country 2019 & 2032
- Table 51: Saudi Arabia Low Foam Surfactants Industry Revenue (Million) Forecast, by Application 2019 & 2032
- Table 52: Saudi Arabia Low Foam Surfactants Industry Volume (liter ) Forecast, by Application 2019 & 2032
- Table 53: South Africa Low Foam Surfactants Industry Revenue (Million) Forecast, by Application 2019 & 2032
- Table 54: South Africa Low Foam Surfactants Industry Volume (liter ) Forecast, by Application 2019 & 2032
- Table 55: Rest of Middle East and Africa Low Foam Surfactants Industry Revenue (Million) Forecast, by Application 2019 & 2032
- Table 56: Rest of Middle East and Africa Low Foam Surfactants Industry Volume (liter ) Forecast, by Application 2019 & 2032
- Table 57: Global Low Foam Surfactants Industry Revenue Million Forecast, by Type 2019 & 2032
- Table 58: Global Low Foam Surfactants Industry Volume liter Forecast, by Type 2019 & 2032
- Table 59: Global Low Foam Surfactants Industry Revenue Million Forecast, by End-user Industry 2019 & 2032
- Table 60: Global Low Foam Surfactants Industry Volume liter Forecast, by End-user Industry 2019 & 2032
- Table 61: Global Low Foam Surfactants Industry Revenue Million Forecast, by Country 2019 & 2032
- Table 62: Global Low Foam Surfactants Industry Volume liter Forecast, by Country 2019 & 2032
- Table 63: China Low Foam Surfactants Industry Revenue (Million) Forecast, by Application 2019 & 2032
- Table 64: China Low Foam Surfactants Industry Volume (liter ) Forecast, by Application 2019 & 2032
- Table 65: India Low Foam Surfactants Industry Revenue (Million) Forecast, by Application 2019 & 2032
- Table 66: India Low Foam Surfactants Industry Volume (liter ) Forecast, by Application 2019 & 2032
- Table 67: Japan Low Foam Surfactants Industry Revenue (Million) Forecast, by Application 2019 & 2032
- Table 68: Japan Low Foam Surfactants Industry Volume (liter ) Forecast, by Application 2019 & 2032
- Table 69: South Korea Low Foam Surfactants Industry Revenue (Million) Forecast, by Application 2019 & 2032
- Table 70: South Korea Low Foam Surfactants Industry Volume (liter ) Forecast, by Application 2019 & 2032
- Table 71: Rest of Asia Pacific Low Foam Surfactants Industry Revenue (Million) Forecast, by Application 2019 & 2032
- Table 72: Rest of Asia Pacific Low Foam Surfactants Industry Volume (liter ) Forecast, by Application 2019 & 2032
- Table 73: Global Low Foam Surfactants Industry Revenue Million Forecast, by Type 2019 & 2032
- Table 74: Global Low Foam Surfactants Industry Volume liter Forecast, by Type 2019 & 2032
- Table 75: Global Low Foam Surfactants Industry Revenue Million Forecast, by End-user Industry 2019 & 2032
- Table 76: Global Low Foam Surfactants Industry Volume liter Forecast, by End-user Industry 2019 & 2032
- Table 77: Global Low Foam Surfactants Industry Revenue Million Forecast, by Country 2019 & 2032
- Table 78: Global Low Foam Surfactants Industry Volume liter Forecast, by Country 2019 & 2032
- Table 79: United States Low Foam Surfactants Industry Revenue (Million) Forecast, by Application 2019 & 2032
- Table 80: United States Low Foam Surfactants Industry Volume (liter ) Forecast, by Application 2019 & 2032
- Table 81: Canada Low Foam Surfactants Industry Revenue (Million) Forecast, by Application 2019 & 2032
- Table 82: Canada Low Foam Surfactants Industry Volume (liter ) Forecast, by Application 2019 & 2032
- Table 83: Mexico Low Foam Surfactants Industry Revenue (Million) Forecast, by Application 2019 & 2032
- Table 84: Mexico Low Foam Surfactants Industry Volume (liter ) Forecast, by Application 2019 & 2032
- Table 85: Global Low Foam Surfactants Industry Revenue Million Forecast, by Type 2019 & 2032
- Table 86: Global Low Foam Surfactants Industry Volume liter Forecast, by Type 2019 & 2032
- Table 87: Global Low Foam Surfactants Industry Revenue Million Forecast, by End-user Industry 2019 & 2032
- Table 88: Global Low Foam Surfactants Industry Volume liter Forecast, by End-user Industry 2019 & 2032
- Table 89: Global Low Foam Surfactants Industry Revenue Million Forecast, by Country 2019 & 2032
- Table 90: Global Low Foam Surfactants Industry Volume liter Forecast, by Country 2019 & 2032
- Table 91: Germany Low Foam Surfactants Industry Revenue (Million) Forecast, by Application 2019 & 2032
- Table 92: Germany Low Foam Surfactants Industry Volume (liter ) Forecast, by Application 2019 & 2032
- Table 93: United Kingdom Low Foam Surfactants Industry Revenue (Million) Forecast, by Application 2019 & 2032
- Table 94: United Kingdom Low Foam Surfactants Industry Volume (liter ) Forecast, by Application 2019 & 2032
- Table 95: Italy Low Foam Surfactants Industry Revenue (Million) Forecast, by Application 2019 & 2032
- Table 96: Italy Low Foam Surfactants Industry Volume (liter ) Forecast, by Application 2019 & 2032
- Table 97: France Low Foam Surfactants Industry Revenue (Million) Forecast, by Application 2019 & 2032
- Table 98: France Low Foam Surfactants Industry Volume (liter ) Forecast, by Application 2019 & 2032
- Table 99: Rest of Europe Low Foam Surfactants Industry Revenue (Million) Forecast, by Application 2019 & 2032
- Table 100: Rest of Europe Low Foam Surfactants Industry Volume (liter ) Forecast, by Application 2019 & 2032
- Table 101: Global Low Foam Surfactants Industry Revenue Million Forecast, by Type 2019 & 2032
- Table 102: Global Low Foam Surfactants Industry Volume liter Forecast, by Type 2019 & 2032
- Table 103: Global Low Foam Surfactants Industry Revenue Million Forecast, by End-user Industry 2019 & 2032
- Table 104: Global Low Foam Surfactants Industry Volume liter Forecast, by End-user Industry 2019 & 2032
- Table 105: Global Low Foam Surfactants Industry Revenue Million Forecast, by Country 2019 & 2032
- Table 106: Global Low Foam Surfactants Industry Volume liter Forecast, by Country 2019 & 2032
- Table 107: Brazil Low Foam Surfactants Industry Revenue (Million) Forecast, by Application 2019 & 2032
- Table 108: Brazil Low Foam Surfactants Industry Volume (liter ) Forecast, by Application 2019 & 2032
- Table 109: Argentina Low Foam Surfactants Industry Revenue (Million) Forecast, by Application 2019 & 2032
- Table 110: Argentina Low Foam Surfactants Industry Volume (liter ) Forecast, by Application 2019 & 2032
- Table 111: Rest of South America Low Foam Surfactants Industry Revenue (Million) Forecast, by Application 2019 & 2032
- Table 112: Rest of South America Low Foam Surfactants Industry Volume (liter ) Forecast, by Application 2019 & 2032
- Table 113: Global Low Foam Surfactants Industry Revenue Million Forecast, by Type 2019 & 2032
- Table 114: Global Low Foam Surfactants Industry Volume liter Forecast, by Type 2019 & 2032
- Table 115: Global Low Foam Surfactants Industry Revenue Million Forecast, by End-user Industry 2019 & 2032
- Table 116: Global Low Foam Surfactants Industry Volume liter Forecast, by End-user Industry 2019 & 2032
- Table 117: Global Low Foam Surfactants Industry Revenue Million Forecast, by Country 2019 & 2032
- Table 118: Global Low Foam Surfactants Industry Volume liter Forecast, by Country 2019 & 2032
- Table 119: Saudi Arabia Low Foam Surfactants Industry Revenue (Million) Forecast, by Application 2019 & 2032
- Table 120: Saudi Arabia Low Foam Surfactants Industry Volume (liter ) Forecast, by Application 2019 & 2032
- Table 121: South Africa Low Foam Surfactants Industry Revenue (Million) Forecast, by Application 2019 & 2032
- Table 122: South Africa Low Foam Surfactants Industry Volume (liter ) Forecast, by Application 2019 & 2032
- Table 123: Rest of Middle East and Africa Low Foam Surfactants Industry Revenue (Million) Forecast, by Application 2019 & 2032
- Table 124: Rest of Middle East and Africa Low Foam Surfactants Industry Volume (liter ) Forecast, by Application 2019 & 2032
Frequently Asked Questions
1. What is the projected Compound Annual Growth Rate (CAGR) of the Low Foam Surfactants Industry?
The projected CAGR is approximately > 4.00%.
2. Which companies are prominent players in the Low Foam Surfactants Industry?
Key companies in the market include AkzoNobel N V, Nufarm, Solvay, Croda International plc, Evonik Industries AG, BASF SE, Huntsman International LLC, Dow, KAO CORPORATION, Oxiteno SA, Stepan Company*List Not Exhaustive, Clariant AG.
3. What are the main segments of the Low Foam Surfactants Industry?
The market segments include Type, End-user Industry.
4. Can you provide details about the market size?
The market size is estimated to be USD 14.35 Million as of 2022.
5. What are some drivers contributing to market growth?
Significant Growth in Detergents and Cleaning Agents; Increased Demand for Sustainable Surfactants; The rising demand for personal care products.
6. What are the notable trends driving market growth?
Detergents and Cleaning Agents End-user Industry Segment to Dominate the Market.
7. Are there any restraints impacting market growth?
The Stringent Enviornmental Regulations; The Availability of Other Substitutes.
8. Can you provide examples of recent developments in the market?
April 2022: BASF SE announced the expansion of a new line of products, such as Dehypound M and Dehypound HDG. These high-performance nonionic surfactant blends are used for multi-soil, multi-application cleaning, and degreasing.
9. What pricing options are available for accessing the report?
Pricing options include single-user, multi-user, and enterprise licenses priced at USD 4750, USD 5250, and USD 8750 respectively.
10. Is the market size provided in terms of value or volume?
The market size is provided in terms of value, measured in Million and volume, measured in liter .
11. Are there any specific market keywords associated with the report?
Yes, the market keyword associated with the report is "Low Foam Surfactants Industry," which aids in identifying and referencing the specific market segment covered.
12. How do I determine which pricing option suits my needs best?
The pricing options vary based on user requirements and access needs. Individual users may opt for single-user licenses, while businesses requiring broader access may choose multi-user or enterprise licenses for cost-effective access to the report.
13. Are there any additional resources or data provided in the Low Foam Surfactants Industry report?
While the report offers comprehensive insights, it's advisable to review the specific contents or supplementary materials provided to ascertain if additional resources or data are available.
14. How can I stay updated on further developments or reports in the Low Foam Surfactants Industry?
To stay informed about further developments, trends, and reports in the Low Foam Surfactants Industry, consider subscribing to industry newsletters, following relevant companies and organizations, or regularly checking reputable industry news sources and publications.
Methodology
Step 1 - Identification of Relevant Samples Size from Population Database


Step 2 - Approaches for Defining Global Market Size (Value, Volume* & Price*)

Note*: In applicable scenarios
Step 3 - Data Sources
Primary Research
- Web Analytics
- Survey Reports
- Research Institute
- Latest Research Reports
- Opinion Leaders
Secondary Research
- Annual Reports
- White Paper
- Latest Press Release
- Industry Association
- Paid Database
- Investor Presentations

Step 4 - Data Triangulation
Involves using different sources of information in order to increase the validity of a study
These sources are likely to be stakeholders in a program - participants, other researchers, program staff, other community members, and so on.
Then we put all data in single framework & apply various statistical tools to find out the dynamic on the market.
During the analysis stage, feedback from the stakeholder groups would be compared to determine areas of agreement as well as areas of divergence


