
Key Insights
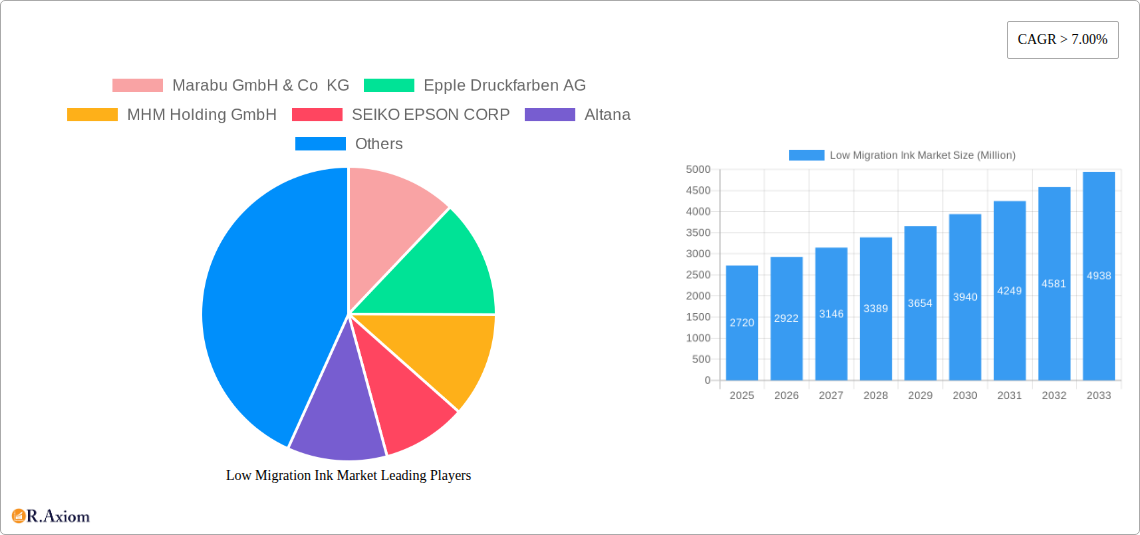
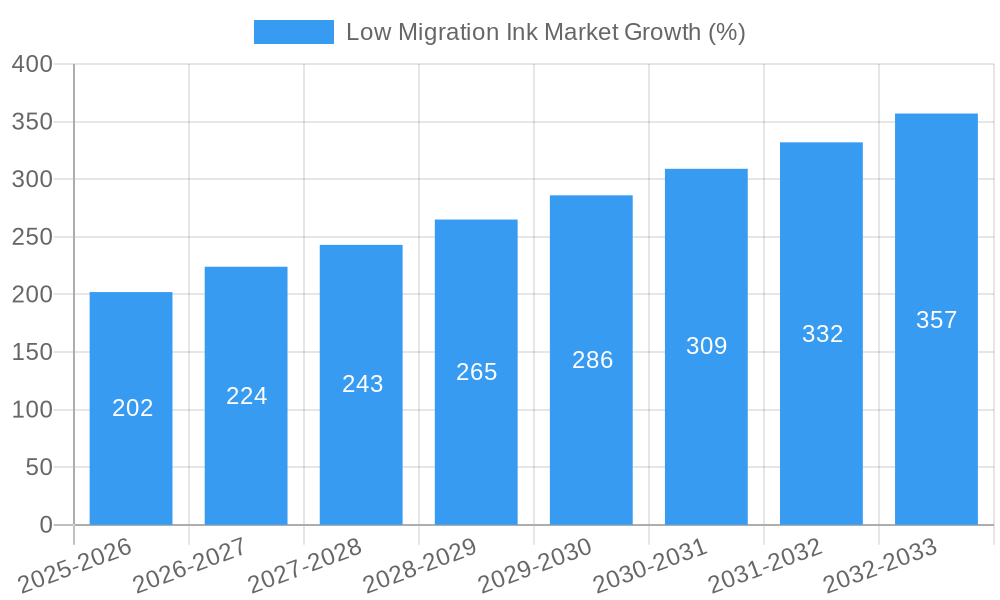
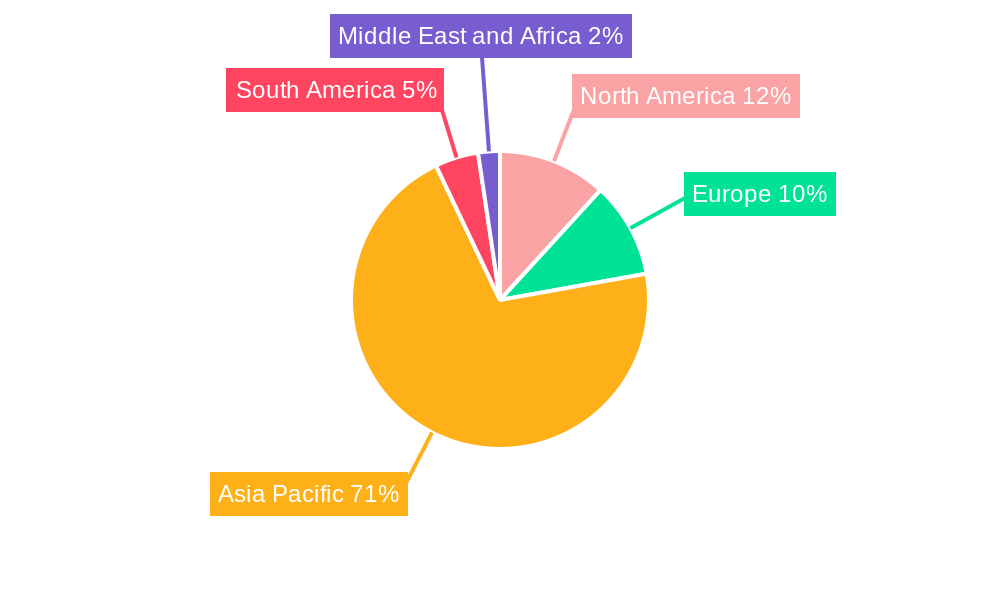
The low migration ink market, currently valued at $2720 million in 2025, is poised for robust growth, exhibiting a Compound Annual Growth Rate (CAGR) exceeding 7% from 2025 to 2033. This expansion is driven by increasing consumer demand for safer food packaging and personal care products, coupled with stringent regulatory measures concerning food contact materials. The demand for sustainable and eco-friendly packaging solutions further fuels market growth, as low migration inks align perfectly with these objectives. Key segments within the market include gravure, digital, offset, and flexographic printing processes, serving diverse end-user industries like personal care, pharmaceuticals, and food and beverage. The Asia-Pacific region, particularly China and India, is expected to dominate the market due to its burgeoning manufacturing and packaging sectors. Competition is fierce, with major players like Sun Chemical, TOYO INK, and Fujifilm vying for market share alongside regional and specialty ink manufacturers. Growth will be further influenced by technological advancements in ink formulations, including advancements in UV-curable and water-based inks offering superior performance and reduced environmental impact.
The market's future trajectory is influenced by several factors. Continued regulatory scrutiny and evolving consumer preferences towards healthier products will maintain upward pressure on demand. However, fluctuations in raw material prices and economic downturns could pose challenges. The increasing adoption of digital printing technologies offers opportunities for market expansion, particularly in areas requiring short-run printing and customized packaging. Successful players will need to focus on innovation, developing low-migration inks with superior performance characteristics, and forging strong relationships with key packaging converters and brand owners. This will require investment in research and development to create more sustainable and compliant solutions. Strategic partnerships and mergers and acquisitions are likely to shape the competitive landscape in the coming years.
Low Migration Ink Market: A Comprehensive Report (2019-2033)
This comprehensive report provides an in-depth analysis of the Low Migration Ink market, offering actionable insights for industry stakeholders. The study period spans from 2019 to 2033, with 2025 serving as the base and estimated year. The report leverages extensive market research and data analysis to forecast market trends and growth from 2025 to 2033. This report covers market size, segmentation, leading players, and key developments, enabling informed decision-making and strategic planning.
Low Migration Ink Market Concentration & Innovation
The Low Migration Ink market exhibits a moderately consolidated structure, with a few major players holding significant market share. Market concentration is driven by factors such as high barriers to entry (extensive R&D, stringent regulatory compliance), economies of scale, and strong brand recognition. The market share of the top five players in 2025 is estimated at xx%. Innovation plays a crucial role, spurred by the growing demand for sustainable and high-performance inks. Key drivers include the development of ultra-low migration inks, AI-assisted formulation technologies, and sustainable production processes. Regulatory frameworks, such as those pertaining to food contact materials, significantly influence market dynamics. Product substitutes, like UV-curable inks and water-based inks, present competitive pressures. End-user trends towards eco-friendly packaging and stringent safety standards further shape market demand. M&A activity has been relatively active in recent years, with deal values totaling approximately $xx Million in the past five years. These acquisitions often involve expanding product portfolios and geographical reach.
- Market Share (2025): Top 5 players - xx%
- M&A Deal Value (2020-2024): ~$xx Million
- Key Innovation Drivers: Ultra-low migration inks, AI-assisted formulation, sustainable production
Low Migration Ink Market Industry Trends & Insights
The Low Migration Ink market is experiencing robust growth, driven by increasing demand from various end-use industries. The market registered a CAGR of xx% during the historical period (2019-2024) and is projected to maintain a CAGR of xx% during the forecast period (2025-2033), reaching a market size of $xx Million by 2033. Technological disruptions, particularly in digital printing technologies, are reshaping the market landscape, driving the adoption of low migration inks in newer applications. Consumer preferences for sustainable and safe packaging are fueling the demand for eco-friendly inks. Competitive dynamics are characterized by intense competition among established players and the emergence of new entrants offering innovative solutions. Market penetration of low migration inks in niche segments, such as pharmaceuticals and food packaging, remains significant.
Dominant Markets & Segments in Low Migration Ink Market
The global low migration ink market is dominated by the region of [insert dominant region, e.g., Western Europe], driven by strong demand from packaging and printing industries. Within this region, [insert dominant country, e.g., Germany] holds the leading position due to its advanced printing technology sector and stringent regulatory standards.
Key Drivers for Dominant Regions/Segments:
- Western Europe: Stringent food safety regulations, advanced printing technology, strong packaging industry
- [Dominant Country]: Well-established printing industry, high consumer awareness of sustainable packaging
- Printing Process Segment: Flexography shows strong growth due to its cost-effectiveness and suitability for flexible packaging.
- End-user Industry Segment: The food and beverage segment leads the market due to increasing demand for safe and sustainable packaging solutions.
Dominance Analysis: The dominance of Western Europe and [dominant country] is attributed to a confluence of factors including mature packaging industries, stringent regulatory requirements favoring low migration inks, and a robust technology base supporting innovation in ink development. The flexography and food & beverage segments benefit from high-volume printing needs and increasing consumer focus on food safety.
Low Migration Ink Market Product Developments
Recent product innovations focus on enhancing the performance and sustainability of low migration inks. New ultra-low migration inks offer superior migration resistance and improved color gamut, catering to the demands of increasingly stringent food contact regulations. The integration of AI-assisted formulation technologies allows for faster and more efficient development of customized ink solutions. These developments have led to significant improvements in print quality, durability, and overall performance, enhancing the competitive advantage of leading players. Further advancements are expected in the area of bio-based and biodegradable inks, aligning with the broader trend towards sustainable production.
Report Scope & Segmentation Analysis
This report comprehensively segments the Low Migration Ink market based on printing processes (Gravure, Digital, Offset, Flexography) and end-user industries (Personal Care, Pharmaceuticals, Food and Beverage, Others). Each segment's market size, growth projections, and competitive dynamics are analyzed in detail.
Printing Process Segmentation:
- Gravure: [Market size in Million, Growth projection] - [Competitive dynamics summary].
- Digital: [Market size in Million, Growth projection] - [Competitive dynamics summary].
- Offset: [Market size in Million, Growth projection] - [Competitive dynamics summary].
- Flexography: [Market size in Million, Growth projection] - [Competitive dynamics summary].
End-User Industry Segmentation:
- Personal Care: [Market size in Million, Growth projection] - [Competitive dynamics summary].
- Pharmaceuticals: [Market size in Million, Growth projection] - [Competitive dynamics summary].
- Food and Beverage: [Market size in Million, Growth projection] - [Competitive dynamics summary].
- Others: [Market size in Million, Growth projection] - [Competitive dynamics summary].
Key Drivers of Low Migration Ink Market Growth
The Low Migration Ink market is experiencing growth driven by several key factors. Stringent food safety regulations globally mandate the use of low migration inks, creating significant demand. The increasing consumer awareness of food safety and packaging sustainability further fuels this demand. Technological advancements, including the development of AI-assisted ink formulation and sustainable production processes, are optimizing ink performance and reducing environmental impact. The rising demand for high-quality and visually appealing packaging across various industries creates a supportive environment for market expansion.
Challenges in the Low Migration Ink Market Sector
Several factors pose challenges to the Low Migration Ink market. High R&D costs associated with developing new, ultra-low migration inks present a barrier to entry for smaller players. Strict regulatory compliance requirements and changing regulations necessitate continuous adaptation and investment. Supply chain disruptions and fluctuations in raw material prices can impact production costs and profitability. The competitive landscape, with established players and emerging innovators, necessitates continuous innovation to maintain market share. These challenges create both opportunities and risks for existing and new market participants.
Emerging Opportunities in Low Migration Ink Market
The Low Migration Ink market presents several promising opportunities. The growing demand for sustainable packaging solutions creates a lucrative market for bio-based and biodegradable inks. Emerging markets in developing economies offer significant growth potential. Advancements in digital printing technologies are expanding the application areas for low migration inks. The increasing demand for customized and specialized ink solutions opens avenues for new entrants with innovative offerings.
Leading Players in the Low Migration Ink Market Market
- Marabu GmbH & Co KG
- Epple Druckfarben AG
- MHM Holding GmbH
- SEIKO EPSON CORP
- Altana
- Sun Chemical
- TOYO INK CO LTD
- FUJIFILM Corporation
- HAPA AG
- HP Development Company L P
- Encres Dubuit
- Wikoff Color Corporation
- Siegwerk Druckfarben AG & Co KGaA
- INX International Ink Co
- hubergroup Deutschland GmbH
- Kao Collins Corporation
- SPGPrints B V
- Flint Group
- Agfa-Gevaert Group
- RUCO Druckfarben
Key Developments in Low Migration Ink Market Industry
- 2022 Q4: Launch of new ultra-low-migration ink series by [Company Name].
- 2023 Q1: Strategic acquisition of [Company A] by [Company B], expanding product portfolio in low-migration inks.
- 2023 Q2: [Company Name] announces development of AI-assisted ink formulation technology for faster customization.
- 2024 Q3: Significant investment by [Company Name] in sustainable ink production processes, reducing environmental impact.
Strategic Outlook for Low Migration Ink Market Market
The Low Migration Ink market is poised for continued growth, driven by strong demand from various end-use sectors and technological advancements. The increasing focus on sustainability and food safety will further propel market expansion. Opportunities exist for companies offering innovative, sustainable, and high-performance low migration ink solutions. Strategic alliances and acquisitions will play a vital role in shaping the market landscape. The market is expected to experience significant growth in the coming years, presenting lucrative opportunities for both established and emerging players.
Low Migration Ink Market Segmentation
-
1. Printing Process
- 1.1. Gravure
- 1.2. Digital
- 1.3. Offset
- 1.4. Flexography
-
2. End-user Industry
- 2.1. Personal Care
- 2.2. Pharmaceuticals
- 2.3. Food and Beverage
- 2.4. Others
Low Migration Ink Market Segmentation By Geography
-
1. Asia Pacific
- 1.1. China
- 1.2. India
- 1.3. Japan
- 1.4. South Korea
- 1.5. Rest of Asia Pacific
-
2. North America
- 2.1. United States
- 2.2. Canada
- 2.3. Mexico
-
3. Europe
- 3.1. Germany
- 3.2. United Kingdom
- 3.3. France
- 3.4. Italy
- 3.5. Rest of Europe
-
4. South America
- 4.1. Brazil
- 4.2. Argentina
- 4.3. Rest of South America
-
5. Middle East and Africa
- 5.1. Saudi Arabia
- 5.2. South Africa
- 5.3. Rest of Middle East and Africa
Low Migration Ink Market REPORT HIGHLIGHTS
| Aspects | Details |
|---|---|
| Study Period | 2019-2033 |
| Base Year | 2024 |
| Estimated Year | 2025 |
| Forecast Period | 2025-2033 |
| Historical Period | 2019-2024 |
| Growth Rate | CAGR of > 7.00% from 2019-2033 |
| Segmentation |
|
Table of Contents
- 1. Introduction
- 1.1. Research Scope
- 1.2. Market Segmentation
- 1.3. Research Methodology
- 1.4. Definitions and Assumptions
- 2. Executive Summary
- 2.1. Introduction
- 3. Market Dynamics
- 3.1. Introduction
- 3.2. Market Drivers
- 3.2.1. ; Significant Growth in Food and Beverage Industry; Rise in Demand for Personal Care Products
- 3.3. Market Restrains
- 3.3.1. ; High Cost Compared to Conventional Inks; Unfavorable Conditions Arising Due to COVID-19 Outbreak
- 3.4. Market Trends
- 3.4.1. Significant Growth in Food and Beverage Industry
- 4. Market Factor Analysis
- 4.1. Porters Five Forces
- 4.2. Supply/Value Chain
- 4.3. PESTEL analysis
- 4.4. Market Entropy
- 4.5. Patent/Trademark Analysis
- 5. Global Low Migration Ink Market Analysis, Insights and Forecast, 2019-2031
- 5.1. Market Analysis, Insights and Forecast - by Printing Process
- 5.1.1. Gravure
- 5.1.2. Digital
- 5.1.3. Offset
- 5.1.4. Flexography
- 5.2. Market Analysis, Insights and Forecast - by End-user Industry
- 5.2.1. Personal Care
- 5.2.2. Pharmaceuticals
- 5.2.3. Food and Beverage
- 5.2.4. Others
- 5.3. Market Analysis, Insights and Forecast - by Region
- 5.3.1. Asia Pacific
- 5.3.2. North America
- 5.3.3. Europe
- 5.3.4. South America
- 5.3.5. Middle East and Africa
- 5.1. Market Analysis, Insights and Forecast - by Printing Process
- 6. Asia Pacific Low Migration Ink Market Analysis, Insights and Forecast, 2019-2031
- 6.1. Market Analysis, Insights and Forecast - by Printing Process
- 6.1.1. Gravure
- 6.1.2. Digital
- 6.1.3. Offset
- 6.1.4. Flexography
- 6.2. Market Analysis, Insights and Forecast - by End-user Industry
- 6.2.1. Personal Care
- 6.2.2. Pharmaceuticals
- 6.2.3. Food and Beverage
- 6.2.4. Others
- 6.1. Market Analysis, Insights and Forecast - by Printing Process
- 7. North America Low Migration Ink Market Analysis, Insights and Forecast, 2019-2031
- 7.1. Market Analysis, Insights and Forecast - by Printing Process
- 7.1.1. Gravure
- 7.1.2. Digital
- 7.1.3. Offset
- 7.1.4. Flexography
- 7.2. Market Analysis, Insights and Forecast - by End-user Industry
- 7.2.1. Personal Care
- 7.2.2. Pharmaceuticals
- 7.2.3. Food and Beverage
- 7.2.4. Others
- 7.1. Market Analysis, Insights and Forecast - by Printing Process
- 8. Europe Low Migration Ink Market Analysis, Insights and Forecast, 2019-2031
- 8.1. Market Analysis, Insights and Forecast - by Printing Process
- 8.1.1. Gravure
- 8.1.2. Digital
- 8.1.3. Offset
- 8.1.4. Flexography
- 8.2. Market Analysis, Insights and Forecast - by End-user Industry
- 8.2.1. Personal Care
- 8.2.2. Pharmaceuticals
- 8.2.3. Food and Beverage
- 8.2.4. Others
- 8.1. Market Analysis, Insights and Forecast - by Printing Process
- 9. South America Low Migration Ink Market Analysis, Insights and Forecast, 2019-2031
- 9.1. Market Analysis, Insights and Forecast - by Printing Process
- 9.1.1. Gravure
- 9.1.2. Digital
- 9.1.3. Offset
- 9.1.4. Flexography
- 9.2. Market Analysis, Insights and Forecast - by End-user Industry
- 9.2.1. Personal Care
- 9.2.2. Pharmaceuticals
- 9.2.3. Food and Beverage
- 9.2.4. Others
- 9.1. Market Analysis, Insights and Forecast - by Printing Process
- 10. Middle East and Africa Low Migration Ink Market Analysis, Insights and Forecast, 2019-2031
- 10.1. Market Analysis, Insights and Forecast - by Printing Process
- 10.1.1. Gravure
- 10.1.2. Digital
- 10.1.3. Offset
- 10.1.4. Flexography
- 10.2. Market Analysis, Insights and Forecast - by End-user Industry
- 10.2.1. Personal Care
- 10.2.2. Pharmaceuticals
- 10.2.3. Food and Beverage
- 10.2.4. Others
- 10.1. Market Analysis, Insights and Forecast - by Printing Process
- 11. Asia Pacific Low Migration Ink Market Analysis, Insights and Forecast, 2019-2031
- 11.1. Market Analysis, Insights and Forecast - By Country/Sub-region
- 11.1.1 China
- 11.1.2 India
- 11.1.3 Japan
- 11.1.4 South Korea
- 11.1.5 Rest of Asia Pacific
- 12. North America Low Migration Ink Market Analysis, Insights and Forecast, 2019-2031
- 12.1. Market Analysis, Insights and Forecast - By Country/Sub-region
- 12.1.1 United States
- 12.1.2 Canada
- 12.1.3 Mexico
- 13. Europe Low Migration Ink Market Analysis, Insights and Forecast, 2019-2031
- 13.1. Market Analysis, Insights and Forecast - By Country/Sub-region
- 13.1.1 Germany
- 13.1.2 United Kingdom
- 13.1.3 France
- 13.1.4 Italy
- 13.1.5 Rest of Europe
- 14. South America Low Migration Ink Market Analysis, Insights and Forecast, 2019-2031
- 14.1. Market Analysis, Insights and Forecast - By Country/Sub-region
- 14.1.1 Brazil
- 14.1.2 Argentina
- 14.1.3 Rest of South America
- 15. Middle East and Africa Low Migration Ink Market Analysis, Insights and Forecast, 2019-2031
- 15.1. Market Analysis, Insights and Forecast - By Country/Sub-region
- 15.1.1 Saudi Arabia
- 15.1.2 South Africa
- 15.1.3 Rest of Middle East and Africa
- 16. Competitive Analysis
- 16.1. Global Market Share Analysis 2024
- 16.2. Company Profiles
- 16.2.1 Marabu GmbH & Co KG
- 16.2.1.1. Overview
- 16.2.1.2. Products
- 16.2.1.3. SWOT Analysis
- 16.2.1.4. Recent Developments
- 16.2.1.5. Financials (Based on Availability)
- 16.2.2 Epple Druckfarben AG
- 16.2.2.1. Overview
- 16.2.2.2. Products
- 16.2.2.3. SWOT Analysis
- 16.2.2.4. Recent Developments
- 16.2.2.5. Financials (Based on Availability)
- 16.2.3 MHM Holding GmbH
- 16.2.3.1. Overview
- 16.2.3.2. Products
- 16.2.3.3. SWOT Analysis
- 16.2.3.4. Recent Developments
- 16.2.3.5. Financials (Based on Availability)
- 16.2.4 SEIKO EPSON CORP
- 16.2.4.1. Overview
- 16.2.4.2. Products
- 16.2.4.3. SWOT Analysis
- 16.2.4.4. Recent Developments
- 16.2.4.5. Financials (Based on Availability)
- 16.2.5 Altana
- 16.2.5.1. Overview
- 16.2.5.2. Products
- 16.2.5.3. SWOT Analysis
- 16.2.5.4. Recent Developments
- 16.2.5.5. Financials (Based on Availability)
- 16.2.6 Sun Chemical
- 16.2.6.1. Overview
- 16.2.6.2. Products
- 16.2.6.3. SWOT Analysis
- 16.2.6.4. Recent Developments
- 16.2.6.5. Financials (Based on Availability)
- 16.2.7 TOYO INK CO LTD
- 16.2.7.1. Overview
- 16.2.7.2. Products
- 16.2.7.3. SWOT Analysis
- 16.2.7.4. Recent Developments
- 16.2.7.5. Financials (Based on Availability)
- 16.2.8 FUJIFILM Corporation
- 16.2.8.1. Overview
- 16.2.8.2. Products
- 16.2.8.3. SWOT Analysis
- 16.2.8.4. Recent Developments
- 16.2.8.5. Financials (Based on Availability)
- 16.2.9 HAPA AG
- 16.2.9.1. Overview
- 16.2.9.2. Products
- 16.2.9.3. SWOT Analysis
- 16.2.9.4. Recent Developments
- 16.2.9.5. Financials (Based on Availability)
- 16.2.10 HP Development Company L P
- 16.2.10.1. Overview
- 16.2.10.2. Products
- 16.2.10.3. SWOT Analysis
- 16.2.10.4. Recent Developments
- 16.2.10.5. Financials (Based on Availability)
- 16.2.11 Encres Dubuit
- 16.2.11.1. Overview
- 16.2.11.2. Products
- 16.2.11.3. SWOT Analysis
- 16.2.11.4. Recent Developments
- 16.2.11.5. Financials (Based on Availability)
- 16.2.12 Wikoff Color Corporation*List Not Exhaustive
- 16.2.12.1. Overview
- 16.2.12.2. Products
- 16.2.12.3. SWOT Analysis
- 16.2.12.4. Recent Developments
- 16.2.12.5. Financials (Based on Availability)
- 16.2.13 Siegwerk Druckfarben AG & Co KGaA
- 16.2.13.1. Overview
- 16.2.13.2. Products
- 16.2.13.3. SWOT Analysis
- 16.2.13.4. Recent Developments
- 16.2.13.5. Financials (Based on Availability)
- 16.2.14 INX International Ink Co
- 16.2.14.1. Overview
- 16.2.14.2. Products
- 16.2.14.3. SWOT Analysis
- 16.2.14.4. Recent Developments
- 16.2.14.5. Financials (Based on Availability)
- 16.2.15 hubergroup Deutschland GmbH
- 16.2.15.1. Overview
- 16.2.15.2. Products
- 16.2.15.3. SWOT Analysis
- 16.2.15.4. Recent Developments
- 16.2.15.5. Financials (Based on Availability)
- 16.2.16 Kao Collins Corporation
- 16.2.16.1. Overview
- 16.2.16.2. Products
- 16.2.16.3. SWOT Analysis
- 16.2.16.4. Recent Developments
- 16.2.16.5. Financials (Based on Availability)
- 16.2.17 SPGPrints B V
- 16.2.17.1. Overview
- 16.2.17.2. Products
- 16.2.17.3. SWOT Analysis
- 16.2.17.4. Recent Developments
- 16.2.17.5. Financials (Based on Availability)
- 16.2.18 Flint Group
- 16.2.18.1. Overview
- 16.2.18.2. Products
- 16.2.18.3. SWOT Analysis
- 16.2.18.4. Recent Developments
- 16.2.18.5. Financials (Based on Availability)
- 16.2.19 Agfa-Gevaert Group
- 16.2.19.1. Overview
- 16.2.19.2. Products
- 16.2.19.3. SWOT Analysis
- 16.2.19.4. Recent Developments
- 16.2.19.5. Financials (Based on Availability)
- 16.2.20 RUCO Druckfarben
- 16.2.20.1. Overview
- 16.2.20.2. Products
- 16.2.20.3. SWOT Analysis
- 16.2.20.4. Recent Developments
- 16.2.20.5. Financials (Based on Availability)
- 16.2.1 Marabu GmbH & Co KG
List of Figures
- Figure 1: Global Low Migration Ink Market Revenue Breakdown (Million, %) by Region 2024 & 2032
- Figure 2: Global Low Migration Ink Market Volume Breakdown (liter , %) by Region 2024 & 2032
- Figure 3: Asia Pacific Low Migration Ink Market Revenue (Million), by Country 2024 & 2032
- Figure 4: Asia Pacific Low Migration Ink Market Volume (liter ), by Country 2024 & 2032
- Figure 5: Asia Pacific Low Migration Ink Market Revenue Share (%), by Country 2024 & 2032
- Figure 6: Asia Pacific Low Migration Ink Market Volume Share (%), by Country 2024 & 2032
- Figure 7: North America Low Migration Ink Market Revenue (Million), by Country 2024 & 2032
- Figure 8: North America Low Migration Ink Market Volume (liter ), by Country 2024 & 2032
- Figure 9: North America Low Migration Ink Market Revenue Share (%), by Country 2024 & 2032
- Figure 10: North America Low Migration Ink Market Volume Share (%), by Country 2024 & 2032
- Figure 11: Europe Low Migration Ink Market Revenue (Million), by Country 2024 & 2032
- Figure 12: Europe Low Migration Ink Market Volume (liter ), by Country 2024 & 2032
- Figure 13: Europe Low Migration Ink Market Revenue Share (%), by Country 2024 & 2032
- Figure 14: Europe Low Migration Ink Market Volume Share (%), by Country 2024 & 2032
- Figure 15: South America Low Migration Ink Market Revenue (Million), by Country 2024 & 2032
- Figure 16: South America Low Migration Ink Market Volume (liter ), by Country 2024 & 2032
- Figure 17: South America Low Migration Ink Market Revenue Share (%), by Country 2024 & 2032
- Figure 18: South America Low Migration Ink Market Volume Share (%), by Country 2024 & 2032
- Figure 19: Middle East and Africa Low Migration Ink Market Revenue (Million), by Country 2024 & 2032
- Figure 20: Middle East and Africa Low Migration Ink Market Volume (liter ), by Country 2024 & 2032
- Figure 21: Middle East and Africa Low Migration Ink Market Revenue Share (%), by Country 2024 & 2032
- Figure 22: Middle East and Africa Low Migration Ink Market Volume Share (%), by Country 2024 & 2032
- Figure 23: Asia Pacific Low Migration Ink Market Revenue (Million), by Printing Process 2024 & 2032
- Figure 24: Asia Pacific Low Migration Ink Market Volume (liter ), by Printing Process 2024 & 2032
- Figure 25: Asia Pacific Low Migration Ink Market Revenue Share (%), by Printing Process 2024 & 2032
- Figure 26: Asia Pacific Low Migration Ink Market Volume Share (%), by Printing Process 2024 & 2032
- Figure 27: Asia Pacific Low Migration Ink Market Revenue (Million), by End-user Industry 2024 & 2032
- Figure 28: Asia Pacific Low Migration Ink Market Volume (liter ), by End-user Industry 2024 & 2032
- Figure 29: Asia Pacific Low Migration Ink Market Revenue Share (%), by End-user Industry 2024 & 2032
- Figure 30: Asia Pacific Low Migration Ink Market Volume Share (%), by End-user Industry 2024 & 2032
- Figure 31: Asia Pacific Low Migration Ink Market Revenue (Million), by Country 2024 & 2032
- Figure 32: Asia Pacific Low Migration Ink Market Volume (liter ), by Country 2024 & 2032
- Figure 33: Asia Pacific Low Migration Ink Market Revenue Share (%), by Country 2024 & 2032
- Figure 34: Asia Pacific Low Migration Ink Market Volume Share (%), by Country 2024 & 2032
- Figure 35: North America Low Migration Ink Market Revenue (Million), by Printing Process 2024 & 2032
- Figure 36: North America Low Migration Ink Market Volume (liter ), by Printing Process 2024 & 2032
- Figure 37: North America Low Migration Ink Market Revenue Share (%), by Printing Process 2024 & 2032
- Figure 38: North America Low Migration Ink Market Volume Share (%), by Printing Process 2024 & 2032
- Figure 39: North America Low Migration Ink Market Revenue (Million), by End-user Industry 2024 & 2032
- Figure 40: North America Low Migration Ink Market Volume (liter ), by End-user Industry 2024 & 2032
- Figure 41: North America Low Migration Ink Market Revenue Share (%), by End-user Industry 2024 & 2032
- Figure 42: North America Low Migration Ink Market Volume Share (%), by End-user Industry 2024 & 2032
- Figure 43: North America Low Migration Ink Market Revenue (Million), by Country 2024 & 2032
- Figure 44: North America Low Migration Ink Market Volume (liter ), by Country 2024 & 2032
- Figure 45: North America Low Migration Ink Market Revenue Share (%), by Country 2024 & 2032
- Figure 46: North America Low Migration Ink Market Volume Share (%), by Country 2024 & 2032
- Figure 47: Europe Low Migration Ink Market Revenue (Million), by Printing Process 2024 & 2032
- Figure 48: Europe Low Migration Ink Market Volume (liter ), by Printing Process 2024 & 2032
- Figure 49: Europe Low Migration Ink Market Revenue Share (%), by Printing Process 2024 & 2032
- Figure 50: Europe Low Migration Ink Market Volume Share (%), by Printing Process 2024 & 2032
- Figure 51: Europe Low Migration Ink Market Revenue (Million), by End-user Industry 2024 & 2032
- Figure 52: Europe Low Migration Ink Market Volume (liter ), by End-user Industry 2024 & 2032
- Figure 53: Europe Low Migration Ink Market Revenue Share (%), by End-user Industry 2024 & 2032
- Figure 54: Europe Low Migration Ink Market Volume Share (%), by End-user Industry 2024 & 2032
- Figure 55: Europe Low Migration Ink Market Revenue (Million), by Country 2024 & 2032
- Figure 56: Europe Low Migration Ink Market Volume (liter ), by Country 2024 & 2032
- Figure 57: Europe Low Migration Ink Market Revenue Share (%), by Country 2024 & 2032
- Figure 58: Europe Low Migration Ink Market Volume Share (%), by Country 2024 & 2032
- Figure 59: South America Low Migration Ink Market Revenue (Million), by Printing Process 2024 & 2032
- Figure 60: South America Low Migration Ink Market Volume (liter ), by Printing Process 2024 & 2032
- Figure 61: South America Low Migration Ink Market Revenue Share (%), by Printing Process 2024 & 2032
- Figure 62: South America Low Migration Ink Market Volume Share (%), by Printing Process 2024 & 2032
- Figure 63: South America Low Migration Ink Market Revenue (Million), by End-user Industry 2024 & 2032
- Figure 64: South America Low Migration Ink Market Volume (liter ), by End-user Industry 2024 & 2032
- Figure 65: South America Low Migration Ink Market Revenue Share (%), by End-user Industry 2024 & 2032
- Figure 66: South America Low Migration Ink Market Volume Share (%), by End-user Industry 2024 & 2032
- Figure 67: South America Low Migration Ink Market Revenue (Million), by Country 2024 & 2032
- Figure 68: South America Low Migration Ink Market Volume (liter ), by Country 2024 & 2032
- Figure 69: South America Low Migration Ink Market Revenue Share (%), by Country 2024 & 2032
- Figure 70: South America Low Migration Ink Market Volume Share (%), by Country 2024 & 2032
- Figure 71: Middle East and Africa Low Migration Ink Market Revenue (Million), by Printing Process 2024 & 2032
- Figure 72: Middle East and Africa Low Migration Ink Market Volume (liter ), by Printing Process 2024 & 2032
- Figure 73: Middle East and Africa Low Migration Ink Market Revenue Share (%), by Printing Process 2024 & 2032
- Figure 74: Middle East and Africa Low Migration Ink Market Volume Share (%), by Printing Process 2024 & 2032
- Figure 75: Middle East and Africa Low Migration Ink Market Revenue (Million), by End-user Industry 2024 & 2032
- Figure 76: Middle East and Africa Low Migration Ink Market Volume (liter ), by End-user Industry 2024 & 2032
- Figure 77: Middle East and Africa Low Migration Ink Market Revenue Share (%), by End-user Industry 2024 & 2032
- Figure 78: Middle East and Africa Low Migration Ink Market Volume Share (%), by End-user Industry 2024 & 2032
- Figure 79: Middle East and Africa Low Migration Ink Market Revenue (Million), by Country 2024 & 2032
- Figure 80: Middle East and Africa Low Migration Ink Market Volume (liter ), by Country 2024 & 2032
- Figure 81: Middle East and Africa Low Migration Ink Market Revenue Share (%), by Country 2024 & 2032
- Figure 82: Middle East and Africa Low Migration Ink Market Volume Share (%), by Country 2024 & 2032
List of Tables
- Table 1: Global Low Migration Ink Market Revenue Million Forecast, by Region 2019 & 2032
- Table 2: Global Low Migration Ink Market Volume liter Forecast, by Region 2019 & 2032
- Table 3: Global Low Migration Ink Market Revenue Million Forecast, by Printing Process 2019 & 2032
- Table 4: Global Low Migration Ink Market Volume liter Forecast, by Printing Process 2019 & 2032
- Table 5: Global Low Migration Ink Market Revenue Million Forecast, by End-user Industry 2019 & 2032
- Table 6: Global Low Migration Ink Market Volume liter Forecast, by End-user Industry 2019 & 2032
- Table 7: Global Low Migration Ink Market Revenue Million Forecast, by Region 2019 & 2032
- Table 8: Global Low Migration Ink Market Volume liter Forecast, by Region 2019 & 2032
- Table 9: Global Low Migration Ink Market Revenue Million Forecast, by Country 2019 & 2032
- Table 10: Global Low Migration Ink Market Volume liter Forecast, by Country 2019 & 2032
- Table 11: China Low Migration Ink Market Revenue (Million) Forecast, by Application 2019 & 2032
- Table 12: China Low Migration Ink Market Volume (liter ) Forecast, by Application 2019 & 2032
- Table 13: India Low Migration Ink Market Revenue (Million) Forecast, by Application 2019 & 2032
- Table 14: India Low Migration Ink Market Volume (liter ) Forecast, by Application 2019 & 2032
- Table 15: Japan Low Migration Ink Market Revenue (Million) Forecast, by Application 2019 & 2032
- Table 16: Japan Low Migration Ink Market Volume (liter ) Forecast, by Application 2019 & 2032
- Table 17: South Korea Low Migration Ink Market Revenue (Million) Forecast, by Application 2019 & 2032
- Table 18: South Korea Low Migration Ink Market Volume (liter ) Forecast, by Application 2019 & 2032
- Table 19: Rest of Asia Pacific Low Migration Ink Market Revenue (Million) Forecast, by Application 2019 & 2032
- Table 20: Rest of Asia Pacific Low Migration Ink Market Volume (liter ) Forecast, by Application 2019 & 2032
- Table 21: Global Low Migration Ink Market Revenue Million Forecast, by Country 2019 & 2032
- Table 22: Global Low Migration Ink Market Volume liter Forecast, by Country 2019 & 2032
- Table 23: United States Low Migration Ink Market Revenue (Million) Forecast, by Application 2019 & 2032
- Table 24: United States Low Migration Ink Market Volume (liter ) Forecast, by Application 2019 & 2032
- Table 25: Canada Low Migration Ink Market Revenue (Million) Forecast, by Application 2019 & 2032
- Table 26: Canada Low Migration Ink Market Volume (liter ) Forecast, by Application 2019 & 2032
- Table 27: Mexico Low Migration Ink Market Revenue (Million) Forecast, by Application 2019 & 2032
- Table 28: Mexico Low Migration Ink Market Volume (liter ) Forecast, by Application 2019 & 2032
- Table 29: Global Low Migration Ink Market Revenue Million Forecast, by Country 2019 & 2032
- Table 30: Global Low Migration Ink Market Volume liter Forecast, by Country 2019 & 2032
- Table 31: Germany Low Migration Ink Market Revenue (Million) Forecast, by Application 2019 & 2032
- Table 32: Germany Low Migration Ink Market Volume (liter ) Forecast, by Application 2019 & 2032
- Table 33: United Kingdom Low Migration Ink Market Revenue (Million) Forecast, by Application 2019 & 2032
- Table 34: United Kingdom Low Migration Ink Market Volume (liter ) Forecast, by Application 2019 & 2032
- Table 35: France Low Migration Ink Market Revenue (Million) Forecast, by Application 2019 & 2032
- Table 36: France Low Migration Ink Market Volume (liter ) Forecast, by Application 2019 & 2032
- Table 37: Italy Low Migration Ink Market Revenue (Million) Forecast, by Application 2019 & 2032
- Table 38: Italy Low Migration Ink Market Volume (liter ) Forecast, by Application 2019 & 2032
- Table 39: Rest of Europe Low Migration Ink Market Revenue (Million) Forecast, by Application 2019 & 2032
- Table 40: Rest of Europe Low Migration Ink Market Volume (liter ) Forecast, by Application 2019 & 2032
- Table 41: Global Low Migration Ink Market Revenue Million Forecast, by Country 2019 & 2032
- Table 42: Global Low Migration Ink Market Volume liter Forecast, by Country 2019 & 2032
- Table 43: Brazil Low Migration Ink Market Revenue (Million) Forecast, by Application 2019 & 2032
- Table 44: Brazil Low Migration Ink Market Volume (liter ) Forecast, by Application 2019 & 2032
- Table 45: Argentina Low Migration Ink Market Revenue (Million) Forecast, by Application 2019 & 2032
- Table 46: Argentina Low Migration Ink Market Volume (liter ) Forecast, by Application 2019 & 2032
- Table 47: Rest of South America Low Migration Ink Market Revenue (Million) Forecast, by Application 2019 & 2032
- Table 48: Rest of South America Low Migration Ink Market Volume (liter ) Forecast, by Application 2019 & 2032
- Table 49: Global Low Migration Ink Market Revenue Million Forecast, by Country 2019 & 2032
- Table 50: Global Low Migration Ink Market Volume liter Forecast, by Country 2019 & 2032
- Table 51: Saudi Arabia Low Migration Ink Market Revenue (Million) Forecast, by Application 2019 & 2032
- Table 52: Saudi Arabia Low Migration Ink Market Volume (liter ) Forecast, by Application 2019 & 2032
- Table 53: South Africa Low Migration Ink Market Revenue (Million) Forecast, by Application 2019 & 2032
- Table 54: South Africa Low Migration Ink Market Volume (liter ) Forecast, by Application 2019 & 2032
- Table 55: Rest of Middle East and Africa Low Migration Ink Market Revenue (Million) Forecast, by Application 2019 & 2032
- Table 56: Rest of Middle East and Africa Low Migration Ink Market Volume (liter ) Forecast, by Application 2019 & 2032
- Table 57: Global Low Migration Ink Market Revenue Million Forecast, by Printing Process 2019 & 2032
- Table 58: Global Low Migration Ink Market Volume liter Forecast, by Printing Process 2019 & 2032
- Table 59: Global Low Migration Ink Market Revenue Million Forecast, by End-user Industry 2019 & 2032
- Table 60: Global Low Migration Ink Market Volume liter Forecast, by End-user Industry 2019 & 2032
- Table 61: Global Low Migration Ink Market Revenue Million Forecast, by Country 2019 & 2032
- Table 62: Global Low Migration Ink Market Volume liter Forecast, by Country 2019 & 2032
- Table 63: China Low Migration Ink Market Revenue (Million) Forecast, by Application 2019 & 2032
- Table 64: China Low Migration Ink Market Volume (liter ) Forecast, by Application 2019 & 2032
- Table 65: India Low Migration Ink Market Revenue (Million) Forecast, by Application 2019 & 2032
- Table 66: India Low Migration Ink Market Volume (liter ) Forecast, by Application 2019 & 2032
- Table 67: Japan Low Migration Ink Market Revenue (Million) Forecast, by Application 2019 & 2032
- Table 68: Japan Low Migration Ink Market Volume (liter ) Forecast, by Application 2019 & 2032
- Table 69: South Korea Low Migration Ink Market Revenue (Million) Forecast, by Application 2019 & 2032
- Table 70: South Korea Low Migration Ink Market Volume (liter ) Forecast, by Application 2019 & 2032
- Table 71: Rest of Asia Pacific Low Migration Ink Market Revenue (Million) Forecast, by Application 2019 & 2032
- Table 72: Rest of Asia Pacific Low Migration Ink Market Volume (liter ) Forecast, by Application 2019 & 2032
- Table 73: Global Low Migration Ink Market Revenue Million Forecast, by Printing Process 2019 & 2032
- Table 74: Global Low Migration Ink Market Volume liter Forecast, by Printing Process 2019 & 2032
- Table 75: Global Low Migration Ink Market Revenue Million Forecast, by End-user Industry 2019 & 2032
- Table 76: Global Low Migration Ink Market Volume liter Forecast, by End-user Industry 2019 & 2032
- Table 77: Global Low Migration Ink Market Revenue Million Forecast, by Country 2019 & 2032
- Table 78: Global Low Migration Ink Market Volume liter Forecast, by Country 2019 & 2032
- Table 79: United States Low Migration Ink Market Revenue (Million) Forecast, by Application 2019 & 2032
- Table 80: United States Low Migration Ink Market Volume (liter ) Forecast, by Application 2019 & 2032
- Table 81: Canada Low Migration Ink Market Revenue (Million) Forecast, by Application 2019 & 2032
- Table 82: Canada Low Migration Ink Market Volume (liter ) Forecast, by Application 2019 & 2032
- Table 83: Mexico Low Migration Ink Market Revenue (Million) Forecast, by Application 2019 & 2032
- Table 84: Mexico Low Migration Ink Market Volume (liter ) Forecast, by Application 2019 & 2032
- Table 85: Global Low Migration Ink Market Revenue Million Forecast, by Printing Process 2019 & 2032
- Table 86: Global Low Migration Ink Market Volume liter Forecast, by Printing Process 2019 & 2032
- Table 87: Global Low Migration Ink Market Revenue Million Forecast, by End-user Industry 2019 & 2032
- Table 88: Global Low Migration Ink Market Volume liter Forecast, by End-user Industry 2019 & 2032
- Table 89: Global Low Migration Ink Market Revenue Million Forecast, by Country 2019 & 2032
- Table 90: Global Low Migration Ink Market Volume liter Forecast, by Country 2019 & 2032
- Table 91: Germany Low Migration Ink Market Revenue (Million) Forecast, by Application 2019 & 2032
- Table 92: Germany Low Migration Ink Market Volume (liter ) Forecast, by Application 2019 & 2032
- Table 93: United Kingdom Low Migration Ink Market Revenue (Million) Forecast, by Application 2019 & 2032
- Table 94: United Kingdom Low Migration Ink Market Volume (liter ) Forecast, by Application 2019 & 2032
- Table 95: France Low Migration Ink Market Revenue (Million) Forecast, by Application 2019 & 2032
- Table 96: France Low Migration Ink Market Volume (liter ) Forecast, by Application 2019 & 2032
- Table 97: Italy Low Migration Ink Market Revenue (Million) Forecast, by Application 2019 & 2032
- Table 98: Italy Low Migration Ink Market Volume (liter ) Forecast, by Application 2019 & 2032
- Table 99: Rest of Europe Low Migration Ink Market Revenue (Million) Forecast, by Application 2019 & 2032
- Table 100: Rest of Europe Low Migration Ink Market Volume (liter ) Forecast, by Application 2019 & 2032
- Table 101: Global Low Migration Ink Market Revenue Million Forecast, by Printing Process 2019 & 2032
- Table 102: Global Low Migration Ink Market Volume liter Forecast, by Printing Process 2019 & 2032
- Table 103: Global Low Migration Ink Market Revenue Million Forecast, by End-user Industry 2019 & 2032
- Table 104: Global Low Migration Ink Market Volume liter Forecast, by End-user Industry 2019 & 2032
- Table 105: Global Low Migration Ink Market Revenue Million Forecast, by Country 2019 & 2032
- Table 106: Global Low Migration Ink Market Volume liter Forecast, by Country 2019 & 2032
- Table 107: Brazil Low Migration Ink Market Revenue (Million) Forecast, by Application 2019 & 2032
- Table 108: Brazil Low Migration Ink Market Volume (liter ) Forecast, by Application 2019 & 2032
- Table 109: Argentina Low Migration Ink Market Revenue (Million) Forecast, by Application 2019 & 2032
- Table 110: Argentina Low Migration Ink Market Volume (liter ) Forecast, by Application 2019 & 2032
- Table 111: Rest of South America Low Migration Ink Market Revenue (Million) Forecast, by Application 2019 & 2032
- Table 112: Rest of South America Low Migration Ink Market Volume (liter ) Forecast, by Application 2019 & 2032
- Table 113: Global Low Migration Ink Market Revenue Million Forecast, by Printing Process 2019 & 2032
- Table 114: Global Low Migration Ink Market Volume liter Forecast, by Printing Process 2019 & 2032
- Table 115: Global Low Migration Ink Market Revenue Million Forecast, by End-user Industry 2019 & 2032
- Table 116: Global Low Migration Ink Market Volume liter Forecast, by End-user Industry 2019 & 2032
- Table 117: Global Low Migration Ink Market Revenue Million Forecast, by Country 2019 & 2032
- Table 118: Global Low Migration Ink Market Volume liter Forecast, by Country 2019 & 2032
- Table 119: Saudi Arabia Low Migration Ink Market Revenue (Million) Forecast, by Application 2019 & 2032
- Table 120: Saudi Arabia Low Migration Ink Market Volume (liter ) Forecast, by Application 2019 & 2032
- Table 121: South Africa Low Migration Ink Market Revenue (Million) Forecast, by Application 2019 & 2032
- Table 122: South Africa Low Migration Ink Market Volume (liter ) Forecast, by Application 2019 & 2032
- Table 123: Rest of Middle East and Africa Low Migration Ink Market Revenue (Million) Forecast, by Application 2019 & 2032
- Table 124: Rest of Middle East and Africa Low Migration Ink Market Volume (liter ) Forecast, by Application 2019 & 2032
Frequently Asked Questions
1. What is the projected Compound Annual Growth Rate (CAGR) of the Low Migration Ink Market?
The projected CAGR is approximately > 7.00%.
2. Which companies are prominent players in the Low Migration Ink Market?
Key companies in the market include Marabu GmbH & Co KG, Epple Druckfarben AG, MHM Holding GmbH, SEIKO EPSON CORP, Altana, Sun Chemical, TOYO INK CO LTD, FUJIFILM Corporation, HAPA AG, HP Development Company L P, Encres Dubuit, Wikoff Color Corporation*List Not Exhaustive, Siegwerk Druckfarben AG & Co KGaA, INX International Ink Co, hubergroup Deutschland GmbH, Kao Collins Corporation, SPGPrints B V, Flint Group, Agfa-Gevaert Group, RUCO Druckfarben.
3. What are the main segments of the Low Migration Ink Market?
The market segments include Printing Process, End-user Industry.
4. Can you provide details about the market size?
The market size is estimated to be USD 2720 Million as of 2022.
5. What are some drivers contributing to market growth?
; Significant Growth in Food and Beverage Industry; Rise in Demand for Personal Care Products.
6. What are the notable trends driving market growth?
Significant Growth in Food and Beverage Industry.
7. Are there any restraints impacting market growth?
; High Cost Compared to Conventional Inks; Unfavorable Conditions Arising Due to COVID-19 Outbreak.
8. Can you provide examples of recent developments in the market?
The Low Migration Ink Market has witnessed several significant developments in recent years: Launch of new ultra-low-migration inks by leading players Strategic acquisitions and partnerships to expand product portfolios Development of AI-assisted ink formulation technologies Growing investment in sustainable ink production processes
9. What pricing options are available for accessing the report?
Pricing options include single-user, multi-user, and enterprise licenses priced at USD 4750, USD 5250, and USD 8750 respectively.
10. Is the market size provided in terms of value or volume?
The market size is provided in terms of value, measured in Million and volume, measured in liter .
11. Are there any specific market keywords associated with the report?
Yes, the market keyword associated with the report is "Low Migration Ink Market," which aids in identifying and referencing the specific market segment covered.
12. How do I determine which pricing option suits my needs best?
The pricing options vary based on user requirements and access needs. Individual users may opt for single-user licenses, while businesses requiring broader access may choose multi-user or enterprise licenses for cost-effective access to the report.
13. Are there any additional resources or data provided in the Low Migration Ink Market report?
While the report offers comprehensive insights, it's advisable to review the specific contents or supplementary materials provided to ascertain if additional resources or data are available.
14. How can I stay updated on further developments or reports in the Low Migration Ink Market?
To stay informed about further developments, trends, and reports in the Low Migration Ink Market, consider subscribing to industry newsletters, following relevant companies and organizations, or regularly checking reputable industry news sources and publications.
Methodology
Step 1 - Identification of Relevant Samples Size from Population Database


Step 2 - Approaches for Defining Global Market Size (Value, Volume* & Price*)

Note*: In applicable scenarios
Step 3 - Data Sources
Primary Research
- Web Analytics
- Survey Reports
- Research Institute
- Latest Research Reports
- Opinion Leaders
Secondary Research
- Annual Reports
- White Paper
- Latest Press Release
- Industry Association
- Paid Database
- Investor Presentations

Step 4 - Data Triangulation
Involves using different sources of information in order to increase the validity of a study
These sources are likely to be stakeholders in a program - participants, other researchers, program staff, other community members, and so on.
Then we put all data in single framework & apply various statistical tools to find out the dynamic on the market.
During the analysis stage, feedback from the stakeholder groups would be compared to determine areas of agreement as well as areas of divergence


