
Key Insights
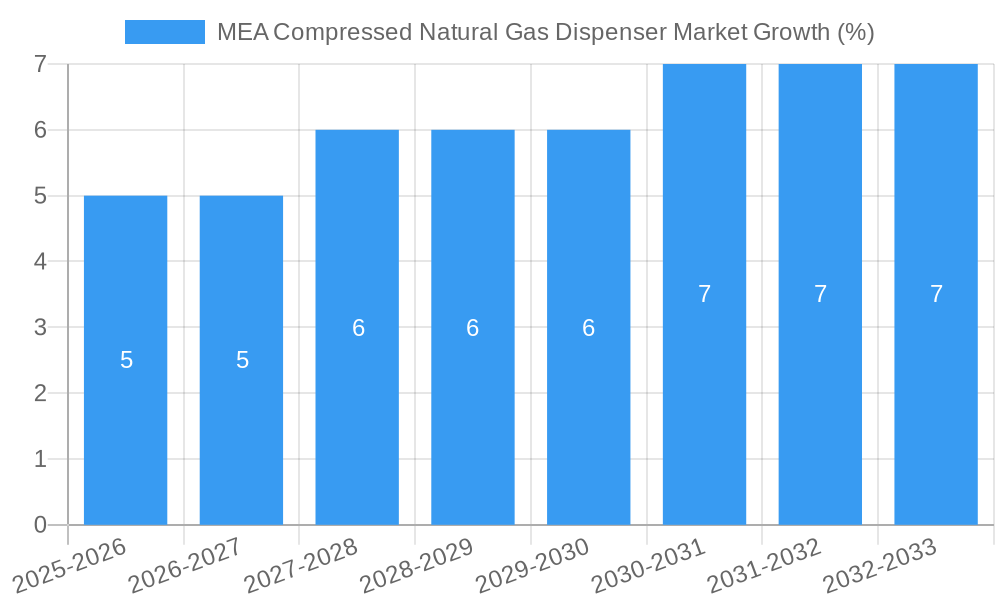
The Middle East and Africa (MEA) Compressed Natural Gas (CNG) Dispenser market is experiencing robust growth, driven by increasing government initiatives promoting CNG as a cleaner alternative fuel and the expansion of public transportation networks in the region. Several factors contribute to this upward trajectory. Firstly, the rising fuel prices and environmental concerns are compelling governments to invest heavily in CNG infrastructure, including the installation of dispensers at strategic locations. Secondly, the burgeoning commercial fleet sector, particularly in the transportation and logistics industries, is driving demand for efficient and cost-effective refueling solutions like CNG dispensers. This is further amplified by the commitment of several countries in the region to diversify their energy mix and reduce reliance on traditional fossil fuels. The market is segmented by dispenser type (fast-fill, slow-fill), number of nozzles, and end-user (commercial fleets, public transportation, retail), with the commercial fleet segment currently holding the largest market share due to the high volume of CNG-powered vehicles in operation. However, the public transportation segment shows significant growth potential as more cities integrate CNG buses and taxis into their fleets. While challenges such as initial infrastructure investment costs and the need for skilled technicians exist, the overall market outlook for CNG dispensers in the MEA region remains positive, projected to maintain a CAGR exceeding 3% throughout the forecast period (2025-2033).
The competitive landscape within the MEA CNG dispenser market is characterized by a mix of international and regional players. Established global companies with extensive experience in fuel dispensing technology are competing with local players who possess regional expertise and understanding of the market dynamics. The market’s expansion is attracting new entrants, especially those offering innovative dispenser technologies, such as those incorporating advanced safety features and remote monitoring capabilities. However, competition is also intensifying, forcing companies to focus on enhancing their product offerings, improving after-sales services, and developing strategic partnerships to gain a stronger foothold in the market. The long-term success of players will depend on their ability to adapt to evolving technological advancements and the changing regulatory landscape governing CNG infrastructure development in the region. Furthermore, the success of individual companies will be influenced by their ability to cater to the specific needs of different customer segments and deliver efficient and reliable CNG dispensing solutions.
MEA Compressed Natural Gas Dispenser Market: A Comprehensive Report (2019-2033)
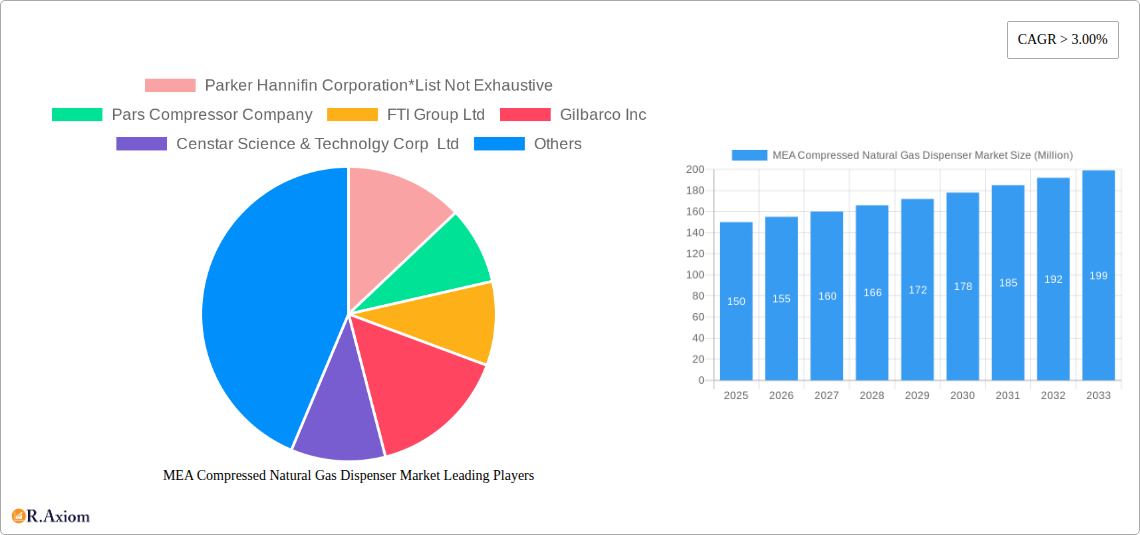
This comprehensive report provides a detailed analysis of the Middle East and Africa (MEA) Compressed Natural Gas (CNG) Dispenser market, offering invaluable insights for industry stakeholders, investors, and strategic decision-makers. The report covers the period from 2019 to 2033, with 2025 as the base year and a forecast period extending to 2033. The market is segmented by type (fast-fill and slow-fill dispensers), number of nozzles (single, two, and four-nozzle), end-user (commercial fleets, public transportation, and retail), and application (transportation, industrial, and commercial). Key players analyzed include Parker Hannifin Corporation, Pars Compressor Company, FTI Group Ltd, Gilbarco Inc, Censtar Science & Technology Corp Ltd, Compressor Sazi Tabriz, Galileo Technologies SA, and Dover Fuelling Solutions. The report's findings are based on extensive primary and secondary research, delivering actionable insights into market dynamics, growth drivers, challenges, and opportunities. The total market size is projected to reach xx Million by 2033.
MEA Compressed Natural Gas Dispenser Market Concentration & Innovation
The MEA CNG dispenser market exhibits a moderately concentrated landscape, with a few major players holding significant market share. However, the presence of several regional and smaller players contributes to a competitive dynamic. Market share data for 2024 indicates that Parker Hannifin Corporation holds approximately xx% market share, followed by Gilbarco Inc with xx% and Dover Fuelling Solutions with xx%. The remaining share is distributed among other players. Innovation is driven by increasing demand for faster dispensing speeds, enhanced safety features, and improved efficiency. Regulatory frameworks, such as emission standards and safety regulations, significantly impact market growth and product development. Product substitutes, such as liquefied natural gas (LNG) and electric vehicles, pose challenges but also drive innovation in CNG dispenser technology. End-user trends towards fleet electrification are creating both opportunities and threats, pushing manufacturers to develop more efficient and cost-effective solutions. M&A activity in the sector has been relatively moderate in recent years, with deal values averaging approximately xx Million per transaction. Key examples include the acquisition of [Company Name] by [Acquiring Company] in [Year], which expanded the acquirer’s reach in the MEA region.
MEA Compressed Natural Gas Dispenser Market Industry Trends & Insights
The MEA CNG dispenser market is experiencing significant growth, driven primarily by increasing government support for CNG infrastructure development, the rising adoption of CNG vehicles in the transportation sector, and stringent emission control regulations across several MEA countries. The market is projected to register a CAGR of xx% during the forecast period (2025-2033). Technological disruptions, such as the adoption of smart dispensing technologies and the integration of IoT (Internet of Things) capabilities, are driving efficiency and improving the overall user experience. Consumer preferences are shifting towards faster dispensing speeds and increased convenience, leading to the rising popularity of fast-fill dispensers. Competitive dynamics are characterized by intense rivalry among established players and the emergence of new entrants offering innovative solutions. Market penetration of CNG dispensers in the transportation sector is estimated at xx% in 2024 and is expected to increase to xx% by 2033.
Dominant Markets & Segments in MEA Compressed Natural Gas Dispenser Market
Leading Region: The [Country Name] region is currently the dominant market for CNG dispensers in the MEA region, driven by robust government support for CNG infrastructure development, significant investments in public transportation systems and a high concentration of commercial fleets.
Dominant Segment (Type): Fast-fill dispensers are experiencing higher growth compared to slow-fill dispensers due to their enhanced speed and efficiency, which significantly reduces vehicle downtime.
Dominant Segment (Number of Nozzles): The demand for two-nozzle dispensers is currently the highest across different end users, providing a balance between efficiency and cost-effectiveness.
Dominant Segment (End-User): Commercial fleets represent the largest end-user segment for CNG dispensers, driven by high vehicle volumes and the benefits of cost-effective fuel.
Dominant Segment (Application): Transportation sector dominates the CNG dispenser market due to the increasing adoption of CNG-fueled vehicles.
Key drivers for the dominance of these segments include supportive government policies (subsidies, tax breaks, infrastructure development), favorable economic conditions, expanding CNG vehicle fleets and proactive measures to reduce carbon emissions. The [Country Name] region’s dominance can be attributed to its strong government initiatives to promote CNG as a cleaner fuel alternative and its proactive investments in developing CNG infrastructure.
MEA Compressed Natural Gas Dispenser Market Product Developments
Recent product innovations have focused on improving dispensing speed, enhancing safety features, and integrating smart technologies. Fast-fill dispensers are becoming increasingly popular due to their time-saving benefits. New models incorporate advanced safety mechanisms to prevent leaks and explosions. The integration of IoT technologies is enabling remote monitoring and diagnostics, improving operational efficiency and reducing maintenance costs. These developments cater to the growing demand for efficient, safe, and technologically advanced CNG dispensing solutions. The competitive advantage lies in offering faster dispensing times, superior safety features, and cost-effective solutions.
Report Scope & Segmentation Analysis
This report segments the MEA CNG dispenser market based on type (fast-fill and slow-fill dispensers), number of nozzles (single, two, and four-nozzle), end-user (commercial fleets, public transportation, and retail), and application (transportation, industrial, and commercial). Each segment's market size, growth projections, and competitive dynamics are analyzed in detail. For instance, the fast-fill dispensers segment is projected to witness significant growth due to its superior efficiency, while the commercial fleets segment is expected to be the largest end-user segment throughout the forecast period. The competitive landscape within each segment is assessed, providing insights into the strategies employed by key players to gain market share.
Key Drivers of MEA Compressed Natural Gas Dispenser Market Growth
Several factors contribute to the market's growth. Government initiatives promoting CNG as a cleaner fuel alternative, coupled with supportive policies like subsidies and tax breaks, stimulate market expansion. The rising adoption of CNG-powered vehicles across various sectors, particularly transportation and public transport, boosts demand. Furthermore, stringent emission control regulations in several countries within the MEA region compel businesses and individuals to shift towards cleaner fuel options. The continuous expansion of CNG infrastructure including filling stations further accelerates market growth.
Challenges in the MEA Compressed Natural Gas Dispenser Market Sector
Despite the market's growth potential, several challenges exist. High initial investment costs associated with CNG infrastructure development can hinder market penetration. The limited availability of skilled labor for installation and maintenance of CNG dispensers poses a constraint. Furthermore, the existing competition from alternative fuels like LNG and the growing adoption of electric vehicles present a challenge to the long-term growth trajectory. Supply chain disruptions, especially during periods of geopolitical instability, can impact the availability of critical components needed to manufacture CNG dispensers.
Emerging Opportunities in MEA Compressed Natural Gas Dispenser Market
Emerging opportunities lie in the expansion into new markets with untapped potential for CNG adoption. Technological advancements, such as the development of high-capacity, fast-fill dispensers and the integration of smart technologies, present significant opportunities for innovation and market penetration. Growing consumer awareness of environmental concerns and a preference for sustainable transportation options creates a favorable market environment. Furthermore, collaborative partnerships between governments, private sector players, and technology providers can accelerate the deployment of CNG infrastructure and drive market growth.
Leading Players in the MEA Compressed Natural Gas Dispenser Market
- Parker Hannifin Corporation
- Pars Compressor Company
- FTI Group Ltd
- Gilbarco Inc
- Censtar Science & Technology Corp Ltd
- Compressor Sazi Tabriz
- Galileo Technologies SA
- Dover Fuelling Solutions
Key Developments in MEA Compressed Natural Gas Dispenser Market Industry
- July 2022: Dover Fuelling Solutions launched a new four-nozzle Wayne Helix CNG dispenser and hydrogen dispenser for the EMEA region, highlighting technological advancements and expansion into new markets. This launch signifies a significant step towards enhancing CNG infrastructure and promoting the adoption of cleaner fuels.
Strategic Outlook for MEA Compressed Natural Gas Dispenser Market
The MEA CNG dispenser market presents a promising outlook, driven by supportive government policies, the growing adoption of CNG vehicles, and the increasing focus on reducing carbon emissions. Continued investments in infrastructure development, technological advancements in dispensing technology, and strategic partnerships will be key factors in shaping the market's future. The market is poised for sustained growth, with opportunities for both established players and new entrants to capitalize on the rising demand for efficient and environmentally friendly CNG dispensing solutions. The focus on smart technology integration and the development of high-capacity dispensers will play a key role in enhancing market dynamics and driving further growth in the years to come.
MEA Compressed Natural Gas Dispenser Market Segmentation
-
1. Geography
- 1.1. United Arab Emirates
- 1.2. Saudi Arabia
- 1.3. Egypt
- 1.4. Tanzania
- 1.5. Rest of Middle-East and Africa
MEA Compressed Natural Gas Dispenser Market Segmentation By Geography
- 1. United Arab Emirates
- 2. Saudi Arabia
- 3. Egypt
- 4. Tanzania
- 5. Rest of Middle East and Africa
MEA Compressed Natural Gas Dispenser Market REPORT HIGHLIGHTS
| Aspects | Details |
|---|---|
| Study Period | 2019-2033 |
| Base Year | 2024 |
| Estimated Year | 2025 |
| Forecast Period | 2025-2033 |
| Historical Period | 2019-2024 |
| Growth Rate | CAGR of > 3.00% from 2019-2033 |
| Segmentation |
|
Table of Contents
- 1. Introduction
- 1.1. Research Scope
- 1.2. Market Segmentation
- 1.3. Research Methodology
- 1.4. Definitions and Assumptions
- 2. Executive Summary
- 2.1. Introduction
- 3. Market Dynamics
- 3.1. Introduction
- 3.2. Market Drivers
- 3.2.1. Increasing Offshore Oil and Gas Exploration and Production Activities4.; Growing Demand for Energy
- 3.3. Market Restrains
- 3.3.1. High Upfront Costs
- 3.4. Market Trends
- 3.4.1. Growing Demand of CNG vehicles Expected to Drive the Market
- 4. Market Factor Analysis
- 4.1. Porters Five Forces
- 4.2. Supply/Value Chain
- 4.3. PESTEL analysis
- 4.4. Market Entropy
- 4.5. Patent/Trademark Analysis
- 5. Global MEA Compressed Natural Gas Dispenser Market Analysis, Insights and Forecast, 2019-2031
- 5.1. Market Analysis, Insights and Forecast - by Geography
- 5.1.1. United Arab Emirates
- 5.1.2. Saudi Arabia
- 5.1.3. Egypt
- 5.1.4. Tanzania
- 5.1.5. Rest of Middle-East and Africa
- 5.2. Market Analysis, Insights and Forecast - by Region
- 5.2.1. United Arab Emirates
- 5.2.2. Saudi Arabia
- 5.2.3. Egypt
- 5.2.4. Tanzania
- 5.2.5. Rest of Middle East and Africa
- 5.1. Market Analysis, Insights and Forecast - by Geography
- 6. United Arab Emirates MEA Compressed Natural Gas Dispenser Market Analysis, Insights and Forecast, 2019-2031
- 6.1. Market Analysis, Insights and Forecast - by Geography
- 6.1.1. United Arab Emirates
- 6.1.2. Saudi Arabia
- 6.1.3. Egypt
- 6.1.4. Tanzania
- 6.1.5. Rest of Middle-East and Africa
- 6.1. Market Analysis, Insights and Forecast - by Geography
- 7. Saudi Arabia MEA Compressed Natural Gas Dispenser Market Analysis, Insights and Forecast, 2019-2031
- 7.1. Market Analysis, Insights and Forecast - by Geography
- 7.1.1. United Arab Emirates
- 7.1.2. Saudi Arabia
- 7.1.3. Egypt
- 7.1.4. Tanzania
- 7.1.5. Rest of Middle-East and Africa
- 7.1. Market Analysis, Insights and Forecast - by Geography
- 8. Egypt MEA Compressed Natural Gas Dispenser Market Analysis, Insights and Forecast, 2019-2031
- 8.1. Market Analysis, Insights and Forecast - by Geography
- 8.1.1. United Arab Emirates
- 8.1.2. Saudi Arabia
- 8.1.3. Egypt
- 8.1.4. Tanzania
- 8.1.5. Rest of Middle-East and Africa
- 8.1. Market Analysis, Insights and Forecast - by Geography
- 9. Tanzania MEA Compressed Natural Gas Dispenser Market Analysis, Insights and Forecast, 2019-2031
- 9.1. Market Analysis, Insights and Forecast - by Geography
- 9.1.1. United Arab Emirates
- 9.1.2. Saudi Arabia
- 9.1.3. Egypt
- 9.1.4. Tanzania
- 9.1.5. Rest of Middle-East and Africa
- 9.1. Market Analysis, Insights and Forecast - by Geography
- 10. Rest of Middle East and Africa MEA Compressed Natural Gas Dispenser Market Analysis, Insights and Forecast, 2019-2031
- 10.1. Market Analysis, Insights and Forecast - by Geography
- 10.1.1. United Arab Emirates
- 10.1.2. Saudi Arabia
- 10.1.3. Egypt
- 10.1.4. Tanzania
- 10.1.5. Rest of Middle-East and Africa
- 10.1. Market Analysis, Insights and Forecast - by Geography
- 11. North America MEA Compressed Natural Gas Dispenser Market Analysis, Insights and Forecast, 2019-2031
- 11.1. Market Analysis, Insights and Forecast - By Country/Sub-region
- 11.1.1 United States
- 11.1.2 Canada
- 11.1.3 Mexico
- 12. Europe MEA Compressed Natural Gas Dispenser Market Analysis, Insights and Forecast, 2019-2031
- 12.1. Market Analysis, Insights and Forecast - By Country/Sub-region
- 12.1.1 Germany
- 12.1.2 United Kingdom
- 12.1.3 France
- 12.1.4 Spain
- 12.1.5 Italy
- 12.1.6 Spain
- 12.1.7 Belgium
- 12.1.8 Netherland
- 12.1.9 Nordics
- 12.1.10 Rest of Europe
- 13. Asia Pacific MEA Compressed Natural Gas Dispenser Market Analysis, Insights and Forecast, 2019-2031
- 13.1. Market Analysis, Insights and Forecast - By Country/Sub-region
- 13.1.1 China
- 13.1.2 Japan
- 13.1.3 India
- 13.1.4 South Korea
- 13.1.5 Southeast Asia
- 13.1.6 Australia
- 13.1.7 Indonesia
- 13.1.8 Phillipes
- 13.1.9 Singapore
- 13.1.10 Thailandc
- 13.1.11 Rest of Asia Pacific
- 14. South America MEA Compressed Natural Gas Dispenser Market Analysis, Insights and Forecast, 2019-2031
- 14.1. Market Analysis, Insights and Forecast - By Country/Sub-region
- 14.1.1 Brazil
- 14.1.2 Argentina
- 14.1.3 Peru
- 14.1.4 Chile
- 14.1.5 Colombia
- 14.1.6 Ecuador
- 14.1.7 Venezuela
- 14.1.8 Rest of South America
- 15. MEA MEA Compressed Natural Gas Dispenser Market Analysis, Insights and Forecast, 2019-2031
- 15.1. Market Analysis, Insights and Forecast - By Country/Sub-region
- 15.1.1 United Arab Emirates
- 15.1.2 Saudi Arabia
- 15.1.3 South Africa
- 15.1.4 Rest of Middle East and Africa
- 16. Competitive Analysis
- 16.1. Global Market Share Analysis 2024
- 16.2. Company Profiles
- 16.2.1 Parker Hannifin Corporation*List Not Exhaustive
- 16.2.1.1. Overview
- 16.2.1.2. Products
- 16.2.1.3. SWOT Analysis
- 16.2.1.4. Recent Developments
- 16.2.1.5. Financials (Based on Availability)
- 16.2.2 Pars Compressor Company
- 16.2.2.1. Overview
- 16.2.2.2. Products
- 16.2.2.3. SWOT Analysis
- 16.2.2.4. Recent Developments
- 16.2.2.5. Financials (Based on Availability)
- 16.2.3 FTI Group Ltd
- 16.2.3.1. Overview
- 16.2.3.2. Products
- 16.2.3.3. SWOT Analysis
- 16.2.3.4. Recent Developments
- 16.2.3.5. Financials (Based on Availability)
- 16.2.4 Gilbarco Inc
- 16.2.4.1. Overview
- 16.2.4.2. Products
- 16.2.4.3. SWOT Analysis
- 16.2.4.4. Recent Developments
- 16.2.4.5. Financials (Based on Availability)
- 16.2.5 Censtar Science & Technolgy Corp Ltd
- 16.2.5.1. Overview
- 16.2.5.2. Products
- 16.2.5.3. SWOT Analysis
- 16.2.5.4. Recent Developments
- 16.2.5.5. Financials (Based on Availability)
- 16.2.6 Compressor Sazi Tabriz
- 16.2.6.1. Overview
- 16.2.6.2. Products
- 16.2.6.3. SWOT Analysis
- 16.2.6.4. Recent Developments
- 16.2.6.5. Financials (Based on Availability)
- 16.2.7 Galileo Technologies SA
- 16.2.7.1. Overview
- 16.2.7.2. Products
- 16.2.7.3. SWOT Analysis
- 16.2.7.4. Recent Developments
- 16.2.7.5. Financials (Based on Availability)
- 16.2.8 Dover Fuelling Solutions
- 16.2.8.1. Overview
- 16.2.8.2. Products
- 16.2.8.3. SWOT Analysis
- 16.2.8.4. Recent Developments
- 16.2.8.5. Financials (Based on Availability)
- 16.2.1 Parker Hannifin Corporation*List Not Exhaustive
List of Figures
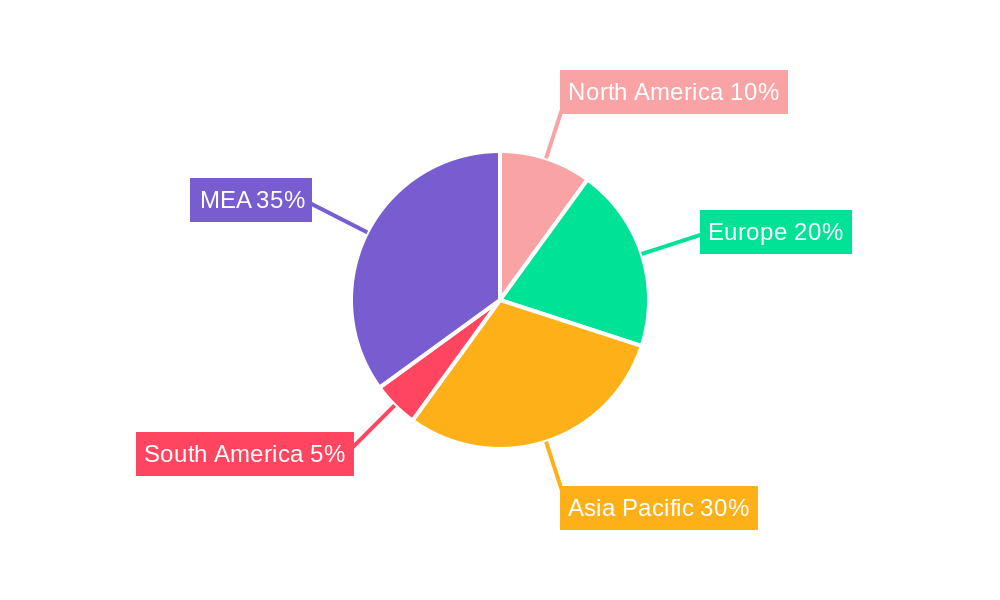
- Figure 1: Global MEA Compressed Natural Gas Dispenser Market Revenue Breakdown (Million, %) by Region 2024 & 2032
- Figure 2: Global MEA Compressed Natural Gas Dispenser Market Volume Breakdown (K Unit, %) by Region 2024 & 2032
- Figure 3: North America MEA Compressed Natural Gas Dispenser Market Revenue (Million), by Country 2024 & 2032
- Figure 4: North America MEA Compressed Natural Gas Dispenser Market Volume (K Unit), by Country 2024 & 2032
- Figure 5: North America MEA Compressed Natural Gas Dispenser Market Revenue Share (%), by Country 2024 & 2032
- Figure 6: North America MEA Compressed Natural Gas Dispenser Market Volume Share (%), by Country 2024 & 2032
- Figure 7: Europe MEA Compressed Natural Gas Dispenser Market Revenue (Million), by Country 2024 & 2032
- Figure 8: Europe MEA Compressed Natural Gas Dispenser Market Volume (K Unit), by Country 2024 & 2032
- Figure 9: Europe MEA Compressed Natural Gas Dispenser Market Revenue Share (%), by Country 2024 & 2032
- Figure 10: Europe MEA Compressed Natural Gas Dispenser Market Volume Share (%), by Country 2024 & 2032
- Figure 11: Asia Pacific MEA Compressed Natural Gas Dispenser Market Revenue (Million), by Country 2024 & 2032
- Figure 12: Asia Pacific MEA Compressed Natural Gas Dispenser Market Volume (K Unit), by Country 2024 & 2032
- Figure 13: Asia Pacific MEA Compressed Natural Gas Dispenser Market Revenue Share (%), by Country 2024 & 2032
- Figure 14: Asia Pacific MEA Compressed Natural Gas Dispenser Market Volume Share (%), by Country 2024 & 2032
- Figure 15: South America MEA Compressed Natural Gas Dispenser Market Revenue (Million), by Country 2024 & 2032
- Figure 16: South America MEA Compressed Natural Gas Dispenser Market Volume (K Unit), by Country 2024 & 2032
- Figure 17: South America MEA Compressed Natural Gas Dispenser Market Revenue Share (%), by Country 2024 & 2032
- Figure 18: South America MEA Compressed Natural Gas Dispenser Market Volume Share (%), by Country 2024 & 2032
- Figure 19: MEA MEA Compressed Natural Gas Dispenser Market Revenue (Million), by Country 2024 & 2032
- Figure 20: MEA MEA Compressed Natural Gas Dispenser Market Volume (K Unit), by Country 2024 & 2032
- Figure 21: MEA MEA Compressed Natural Gas Dispenser Market Revenue Share (%), by Country 2024 & 2032
- Figure 22: MEA MEA Compressed Natural Gas Dispenser Market Volume Share (%), by Country 2024 & 2032
- Figure 23: United Arab Emirates MEA Compressed Natural Gas Dispenser Market Revenue (Million), by Geography 2024 & 2032
- Figure 24: United Arab Emirates MEA Compressed Natural Gas Dispenser Market Volume (K Unit), by Geography 2024 & 2032
- Figure 25: United Arab Emirates MEA Compressed Natural Gas Dispenser Market Revenue Share (%), by Geography 2024 & 2032
- Figure 26: United Arab Emirates MEA Compressed Natural Gas Dispenser Market Volume Share (%), by Geography 2024 & 2032
- Figure 27: United Arab Emirates MEA Compressed Natural Gas Dispenser Market Revenue (Million), by Country 2024 & 2032
- Figure 28: United Arab Emirates MEA Compressed Natural Gas Dispenser Market Volume (K Unit), by Country 2024 & 2032
- Figure 29: United Arab Emirates MEA Compressed Natural Gas Dispenser Market Revenue Share (%), by Country 2024 & 2032
- Figure 30: United Arab Emirates MEA Compressed Natural Gas Dispenser Market Volume Share (%), by Country 2024 & 2032
- Figure 31: Saudi Arabia MEA Compressed Natural Gas Dispenser Market Revenue (Million), by Geography 2024 & 2032
- Figure 32: Saudi Arabia MEA Compressed Natural Gas Dispenser Market Volume (K Unit), by Geography 2024 & 2032
- Figure 33: Saudi Arabia MEA Compressed Natural Gas Dispenser Market Revenue Share (%), by Geography 2024 & 2032
- Figure 34: Saudi Arabia MEA Compressed Natural Gas Dispenser Market Volume Share (%), by Geography 2024 & 2032
- Figure 35: Saudi Arabia MEA Compressed Natural Gas Dispenser Market Revenue (Million), by Country 2024 & 2032
- Figure 36: Saudi Arabia MEA Compressed Natural Gas Dispenser Market Volume (K Unit), by Country 2024 & 2032
- Figure 37: Saudi Arabia MEA Compressed Natural Gas Dispenser Market Revenue Share (%), by Country 2024 & 2032
- Figure 38: Saudi Arabia MEA Compressed Natural Gas Dispenser Market Volume Share (%), by Country 2024 & 2032
- Figure 39: Egypt MEA Compressed Natural Gas Dispenser Market Revenue (Million), by Geography 2024 & 2032
- Figure 40: Egypt MEA Compressed Natural Gas Dispenser Market Volume (K Unit), by Geography 2024 & 2032
- Figure 41: Egypt MEA Compressed Natural Gas Dispenser Market Revenue Share (%), by Geography 2024 & 2032
- Figure 42: Egypt MEA Compressed Natural Gas Dispenser Market Volume Share (%), by Geography 2024 & 2032
- Figure 43: Egypt MEA Compressed Natural Gas Dispenser Market Revenue (Million), by Country 2024 & 2032
- Figure 44: Egypt MEA Compressed Natural Gas Dispenser Market Volume (K Unit), by Country 2024 & 2032
- Figure 45: Egypt MEA Compressed Natural Gas Dispenser Market Revenue Share (%), by Country 2024 & 2032
- Figure 46: Egypt MEA Compressed Natural Gas Dispenser Market Volume Share (%), by Country 2024 & 2032
- Figure 47: Tanzania MEA Compressed Natural Gas Dispenser Market Revenue (Million), by Geography 2024 & 2032
- Figure 48: Tanzania MEA Compressed Natural Gas Dispenser Market Volume (K Unit), by Geography 2024 & 2032
- Figure 49: Tanzania MEA Compressed Natural Gas Dispenser Market Revenue Share (%), by Geography 2024 & 2032
- Figure 50: Tanzania MEA Compressed Natural Gas Dispenser Market Volume Share (%), by Geography 2024 & 2032
- Figure 51: Tanzania MEA Compressed Natural Gas Dispenser Market Revenue (Million), by Country 2024 & 2032
- Figure 52: Tanzania MEA Compressed Natural Gas Dispenser Market Volume (K Unit), by Country 2024 & 2032
- Figure 53: Tanzania MEA Compressed Natural Gas Dispenser Market Revenue Share (%), by Country 2024 & 2032
- Figure 54: Tanzania MEA Compressed Natural Gas Dispenser Market Volume Share (%), by Country 2024 & 2032
- Figure 55: Rest of Middle East and Africa MEA Compressed Natural Gas Dispenser Market Revenue (Million), by Geography 2024 & 2032
- Figure 56: Rest of Middle East and Africa MEA Compressed Natural Gas Dispenser Market Volume (K Unit), by Geography 2024 & 2032
- Figure 57: Rest of Middle East and Africa MEA Compressed Natural Gas Dispenser Market Revenue Share (%), by Geography 2024 & 2032
- Figure 58: Rest of Middle East and Africa MEA Compressed Natural Gas Dispenser Market Volume Share (%), by Geography 2024 & 2032
- Figure 59: Rest of Middle East and Africa MEA Compressed Natural Gas Dispenser Market Revenue (Million), by Country 2024 & 2032
- Figure 60: Rest of Middle East and Africa MEA Compressed Natural Gas Dispenser Market Volume (K Unit), by Country 2024 & 2032
- Figure 61: Rest of Middle East and Africa MEA Compressed Natural Gas Dispenser Market Revenue Share (%), by Country 2024 & 2032
- Figure 62: Rest of Middle East and Africa MEA Compressed Natural Gas Dispenser Market Volume Share (%), by Country 2024 & 2032
List of Tables
- Table 1: Global MEA Compressed Natural Gas Dispenser Market Revenue Million Forecast, by Region 2019 & 2032
- Table 2: Global MEA Compressed Natural Gas Dispenser Market Volume K Unit Forecast, by Region 2019 & 2032
- Table 3: Global MEA Compressed Natural Gas Dispenser Market Revenue Million Forecast, by Geography 2019 & 2032
- Table 4: Global MEA Compressed Natural Gas Dispenser Market Volume K Unit Forecast, by Geography 2019 & 2032
- Table 5: Global MEA Compressed Natural Gas Dispenser Market Revenue Million Forecast, by Region 2019 & 2032
- Table 6: Global MEA Compressed Natural Gas Dispenser Market Volume K Unit Forecast, by Region 2019 & 2032
- Table 7: Global MEA Compressed Natural Gas Dispenser Market Revenue Million Forecast, by Country 2019 & 2032
- Table 8: Global MEA Compressed Natural Gas Dispenser Market Volume K Unit Forecast, by Country 2019 & 2032
- Table 9: United States MEA Compressed Natural Gas Dispenser Market Revenue (Million) Forecast, by Application 2019 & 2032
- Table 10: United States MEA Compressed Natural Gas Dispenser Market Volume (K Unit) Forecast, by Application 2019 & 2032
- Table 11: Canada MEA Compressed Natural Gas Dispenser Market Revenue (Million) Forecast, by Application 2019 & 2032
- Table 12: Canada MEA Compressed Natural Gas Dispenser Market Volume (K Unit) Forecast, by Application 2019 & 2032
- Table 13: Mexico MEA Compressed Natural Gas Dispenser Market Revenue (Million) Forecast, by Application 2019 & 2032
- Table 14: Mexico MEA Compressed Natural Gas Dispenser Market Volume (K Unit) Forecast, by Application 2019 & 2032
- Table 15: Global MEA Compressed Natural Gas Dispenser Market Revenue Million Forecast, by Country 2019 & 2032
- Table 16: Global MEA Compressed Natural Gas Dispenser Market Volume K Unit Forecast, by Country 2019 & 2032
- Table 17: Germany MEA Compressed Natural Gas Dispenser Market Revenue (Million) Forecast, by Application 2019 & 2032
- Table 18: Germany MEA Compressed Natural Gas Dispenser Market Volume (K Unit) Forecast, by Application 2019 & 2032
- Table 19: United Kingdom MEA Compressed Natural Gas Dispenser Market Revenue (Million) Forecast, by Application 2019 & 2032
- Table 20: United Kingdom MEA Compressed Natural Gas Dispenser Market Volume (K Unit) Forecast, by Application 2019 & 2032
- Table 21: France MEA Compressed Natural Gas Dispenser Market Revenue (Million) Forecast, by Application 2019 & 2032
- Table 22: France MEA Compressed Natural Gas Dispenser Market Volume (K Unit) Forecast, by Application 2019 & 2032
- Table 23: Spain MEA Compressed Natural Gas Dispenser Market Revenue (Million) Forecast, by Application 2019 & 2032
- Table 24: Spain MEA Compressed Natural Gas Dispenser Market Volume (K Unit) Forecast, by Application 2019 & 2032
- Table 25: Italy MEA Compressed Natural Gas Dispenser Market Revenue (Million) Forecast, by Application 2019 & 2032
- Table 26: Italy MEA Compressed Natural Gas Dispenser Market Volume (K Unit) Forecast, by Application 2019 & 2032
- Table 27: Spain MEA Compressed Natural Gas Dispenser Market Revenue (Million) Forecast, by Application 2019 & 2032
- Table 28: Spain MEA Compressed Natural Gas Dispenser Market Volume (K Unit) Forecast, by Application 2019 & 2032
- Table 29: Belgium MEA Compressed Natural Gas Dispenser Market Revenue (Million) Forecast, by Application 2019 & 2032
- Table 30: Belgium MEA Compressed Natural Gas Dispenser Market Volume (K Unit) Forecast, by Application 2019 & 2032
- Table 31: Netherland MEA Compressed Natural Gas Dispenser Market Revenue (Million) Forecast, by Application 2019 & 2032
- Table 32: Netherland MEA Compressed Natural Gas Dispenser Market Volume (K Unit) Forecast, by Application 2019 & 2032
- Table 33: Nordics MEA Compressed Natural Gas Dispenser Market Revenue (Million) Forecast, by Application 2019 & 2032
- Table 34: Nordics MEA Compressed Natural Gas Dispenser Market Volume (K Unit) Forecast, by Application 2019 & 2032
- Table 35: Rest of Europe MEA Compressed Natural Gas Dispenser Market Revenue (Million) Forecast, by Application 2019 & 2032
- Table 36: Rest of Europe MEA Compressed Natural Gas Dispenser Market Volume (K Unit) Forecast, by Application 2019 & 2032
- Table 37: Global MEA Compressed Natural Gas Dispenser Market Revenue Million Forecast, by Country 2019 & 2032
- Table 38: Global MEA Compressed Natural Gas Dispenser Market Volume K Unit Forecast, by Country 2019 & 2032
- Table 39: China MEA Compressed Natural Gas Dispenser Market Revenue (Million) Forecast, by Application 2019 & 2032
- Table 40: China MEA Compressed Natural Gas Dispenser Market Volume (K Unit) Forecast, by Application 2019 & 2032
- Table 41: Japan MEA Compressed Natural Gas Dispenser Market Revenue (Million) Forecast, by Application 2019 & 2032
- Table 42: Japan MEA Compressed Natural Gas Dispenser Market Volume (K Unit) Forecast, by Application 2019 & 2032
- Table 43: India MEA Compressed Natural Gas Dispenser Market Revenue (Million) Forecast, by Application 2019 & 2032
- Table 44: India MEA Compressed Natural Gas Dispenser Market Volume (K Unit) Forecast, by Application 2019 & 2032
- Table 45: South Korea MEA Compressed Natural Gas Dispenser Market Revenue (Million) Forecast, by Application 2019 & 2032
- Table 46: South Korea MEA Compressed Natural Gas Dispenser Market Volume (K Unit) Forecast, by Application 2019 & 2032
- Table 47: Southeast Asia MEA Compressed Natural Gas Dispenser Market Revenue (Million) Forecast, by Application 2019 & 2032
- Table 48: Southeast Asia MEA Compressed Natural Gas Dispenser Market Volume (K Unit) Forecast, by Application 2019 & 2032
- Table 49: Australia MEA Compressed Natural Gas Dispenser Market Revenue (Million) Forecast, by Application 2019 & 2032
- Table 50: Australia MEA Compressed Natural Gas Dispenser Market Volume (K Unit) Forecast, by Application 2019 & 2032
- Table 51: Indonesia MEA Compressed Natural Gas Dispenser Market Revenue (Million) Forecast, by Application 2019 & 2032
- Table 52: Indonesia MEA Compressed Natural Gas Dispenser Market Volume (K Unit) Forecast, by Application 2019 & 2032
- Table 53: Phillipes MEA Compressed Natural Gas Dispenser Market Revenue (Million) Forecast, by Application 2019 & 2032
- Table 54: Phillipes MEA Compressed Natural Gas Dispenser Market Volume (K Unit) Forecast, by Application 2019 & 2032
- Table 55: Singapore MEA Compressed Natural Gas Dispenser Market Revenue (Million) Forecast, by Application 2019 & 2032
- Table 56: Singapore MEA Compressed Natural Gas Dispenser Market Volume (K Unit) Forecast, by Application 2019 & 2032
- Table 57: Thailandc MEA Compressed Natural Gas Dispenser Market Revenue (Million) Forecast, by Application 2019 & 2032
- Table 58: Thailandc MEA Compressed Natural Gas Dispenser Market Volume (K Unit) Forecast, by Application 2019 & 2032
- Table 59: Rest of Asia Pacific MEA Compressed Natural Gas Dispenser Market Revenue (Million) Forecast, by Application 2019 & 2032
- Table 60: Rest of Asia Pacific MEA Compressed Natural Gas Dispenser Market Volume (K Unit) Forecast, by Application 2019 & 2032
- Table 61: Global MEA Compressed Natural Gas Dispenser Market Revenue Million Forecast, by Country 2019 & 2032
- Table 62: Global MEA Compressed Natural Gas Dispenser Market Volume K Unit Forecast, by Country 2019 & 2032
- Table 63: Brazil MEA Compressed Natural Gas Dispenser Market Revenue (Million) Forecast, by Application 2019 & 2032
- Table 64: Brazil MEA Compressed Natural Gas Dispenser Market Volume (K Unit) Forecast, by Application 2019 & 2032
- Table 65: Argentina MEA Compressed Natural Gas Dispenser Market Revenue (Million) Forecast, by Application 2019 & 2032
- Table 66: Argentina MEA Compressed Natural Gas Dispenser Market Volume (K Unit) Forecast, by Application 2019 & 2032
- Table 67: Peru MEA Compressed Natural Gas Dispenser Market Revenue (Million) Forecast, by Application 2019 & 2032
- Table 68: Peru MEA Compressed Natural Gas Dispenser Market Volume (K Unit) Forecast, by Application 2019 & 2032
- Table 69: Chile MEA Compressed Natural Gas Dispenser Market Revenue (Million) Forecast, by Application 2019 & 2032
- Table 70: Chile MEA Compressed Natural Gas Dispenser Market Volume (K Unit) Forecast, by Application 2019 & 2032
- Table 71: Colombia MEA Compressed Natural Gas Dispenser Market Revenue (Million) Forecast, by Application 2019 & 2032
- Table 72: Colombia MEA Compressed Natural Gas Dispenser Market Volume (K Unit) Forecast, by Application 2019 & 2032
- Table 73: Ecuador MEA Compressed Natural Gas Dispenser Market Revenue (Million) Forecast, by Application 2019 & 2032
- Table 74: Ecuador MEA Compressed Natural Gas Dispenser Market Volume (K Unit) Forecast, by Application 2019 & 2032
- Table 75: Venezuela MEA Compressed Natural Gas Dispenser Market Revenue (Million) Forecast, by Application 2019 & 2032
- Table 76: Venezuela MEA Compressed Natural Gas Dispenser Market Volume (K Unit) Forecast, by Application 2019 & 2032
- Table 77: Rest of South America MEA Compressed Natural Gas Dispenser Market Revenue (Million) Forecast, by Application 2019 & 2032
- Table 78: Rest of South America MEA Compressed Natural Gas Dispenser Market Volume (K Unit) Forecast, by Application 2019 & 2032
- Table 79: Global MEA Compressed Natural Gas Dispenser Market Revenue Million Forecast, by Country 2019 & 2032
- Table 80: Global MEA Compressed Natural Gas Dispenser Market Volume K Unit Forecast, by Country 2019 & 2032
- Table 81: United Arab Emirates MEA Compressed Natural Gas Dispenser Market Revenue (Million) Forecast, by Application 2019 & 2032
- Table 82: United Arab Emirates MEA Compressed Natural Gas Dispenser Market Volume (K Unit) Forecast, by Application 2019 & 2032
- Table 83: Saudi Arabia MEA Compressed Natural Gas Dispenser Market Revenue (Million) Forecast, by Application 2019 & 2032
- Table 84: Saudi Arabia MEA Compressed Natural Gas Dispenser Market Volume (K Unit) Forecast, by Application 2019 & 2032
- Table 85: South Africa MEA Compressed Natural Gas Dispenser Market Revenue (Million) Forecast, by Application 2019 & 2032
- Table 86: South Africa MEA Compressed Natural Gas Dispenser Market Volume (K Unit) Forecast, by Application 2019 & 2032
- Table 87: Rest of Middle East and Africa MEA Compressed Natural Gas Dispenser Market Revenue (Million) Forecast, by Application 2019 & 2032
- Table 88: Rest of Middle East and Africa MEA Compressed Natural Gas Dispenser Market Volume (K Unit) Forecast, by Application 2019 & 2032
- Table 89: Global MEA Compressed Natural Gas Dispenser Market Revenue Million Forecast, by Geography 2019 & 2032
- Table 90: Global MEA Compressed Natural Gas Dispenser Market Volume K Unit Forecast, by Geography 2019 & 2032
- Table 91: Global MEA Compressed Natural Gas Dispenser Market Revenue Million Forecast, by Country 2019 & 2032
- Table 92: Global MEA Compressed Natural Gas Dispenser Market Volume K Unit Forecast, by Country 2019 & 2032
- Table 93: Global MEA Compressed Natural Gas Dispenser Market Revenue Million Forecast, by Geography 2019 & 2032
- Table 94: Global MEA Compressed Natural Gas Dispenser Market Volume K Unit Forecast, by Geography 2019 & 2032
- Table 95: Global MEA Compressed Natural Gas Dispenser Market Revenue Million Forecast, by Country 2019 & 2032
- Table 96: Global MEA Compressed Natural Gas Dispenser Market Volume K Unit Forecast, by Country 2019 & 2032
- Table 97: Global MEA Compressed Natural Gas Dispenser Market Revenue Million Forecast, by Geography 2019 & 2032
- Table 98: Global MEA Compressed Natural Gas Dispenser Market Volume K Unit Forecast, by Geography 2019 & 2032
- Table 99: Global MEA Compressed Natural Gas Dispenser Market Revenue Million Forecast, by Country 2019 & 2032
- Table 100: Global MEA Compressed Natural Gas Dispenser Market Volume K Unit Forecast, by Country 2019 & 2032
- Table 101: Global MEA Compressed Natural Gas Dispenser Market Revenue Million Forecast, by Geography 2019 & 2032
- Table 102: Global MEA Compressed Natural Gas Dispenser Market Volume K Unit Forecast, by Geography 2019 & 2032
- Table 103: Global MEA Compressed Natural Gas Dispenser Market Revenue Million Forecast, by Country 2019 & 2032
- Table 104: Global MEA Compressed Natural Gas Dispenser Market Volume K Unit Forecast, by Country 2019 & 2032
- Table 105: Global MEA Compressed Natural Gas Dispenser Market Revenue Million Forecast, by Geography 2019 & 2032
- Table 106: Global MEA Compressed Natural Gas Dispenser Market Volume K Unit Forecast, by Geography 2019 & 2032
- Table 107: Global MEA Compressed Natural Gas Dispenser Market Revenue Million Forecast, by Country 2019 & 2032
- Table 108: Global MEA Compressed Natural Gas Dispenser Market Volume K Unit Forecast, by Country 2019 & 2032
Frequently Asked Questions
1. What is the projected Compound Annual Growth Rate (CAGR) of the MEA Compressed Natural Gas Dispenser Market?
The projected CAGR is approximately > 3.00%.
2. Which companies are prominent players in the MEA Compressed Natural Gas Dispenser Market?
Key companies in the market include Parker Hannifin Corporation*List Not Exhaustive, Pars Compressor Company, FTI Group Ltd, Gilbarco Inc, Censtar Science & Technolgy Corp Ltd, Compressor Sazi Tabriz, Galileo Technologies SA, Dover Fuelling Solutions.
3. What are the main segments of the MEA Compressed Natural Gas Dispenser Market?
The market segments include Geography.
4. Can you provide details about the market size?
The market size is estimated to be USD XX Million as of 2022.
5. What are some drivers contributing to market growth?
Increasing Offshore Oil and Gas Exploration and Production Activities4.; Growing Demand for Energy.
6. What are the notable trends driving market growth?
Growing Demand of CNG vehicles Expected to Drive the Market.
7. Are there any restraints impacting market growth?
High Upfront Costs.
8. Can you provide examples of recent developments in the market?
July 2022: Dover Fuelling Solutions (DFS), the global provider of technologies and services for the fuel industry, announced the launch of a new technologically advanced four-nozzle Wayne Helix CNG dispenser and hydrogen dispenser for EMEA (Europe, Middle-East, and Africa) region.
9. What pricing options are available for accessing the report?
Pricing options include single-user, multi-user, and enterprise licenses priced at USD 4750, USD 5250, and USD 8750 respectively.
10. Is the market size provided in terms of value or volume?
The market size is provided in terms of value, measured in Million and volume, measured in K Unit.
11. Are there any specific market keywords associated with the report?
Yes, the market keyword associated with the report is "MEA Compressed Natural Gas Dispenser Market," which aids in identifying and referencing the specific market segment covered.
12. How do I determine which pricing option suits my needs best?
The pricing options vary based on user requirements and access needs. Individual users may opt for single-user licenses, while businesses requiring broader access may choose multi-user or enterprise licenses for cost-effective access to the report.
13. Are there any additional resources or data provided in the MEA Compressed Natural Gas Dispenser Market report?
While the report offers comprehensive insights, it's advisable to review the specific contents or supplementary materials provided to ascertain if additional resources or data are available.
14. How can I stay updated on further developments or reports in the MEA Compressed Natural Gas Dispenser Market?
To stay informed about further developments, trends, and reports in the MEA Compressed Natural Gas Dispenser Market, consider subscribing to industry newsletters, following relevant companies and organizations, or regularly checking reputable industry news sources and publications.
Methodology
Step 1 - Identification of Relevant Samples Size from Population Database


Step 2 - Approaches for Defining Global Market Size (Value, Volume* & Price*)

Note*: In applicable scenarios
Step 3 - Data Sources
Primary Research
- Web Analytics
- Survey Reports
- Research Institute
- Latest Research Reports
- Opinion Leaders
Secondary Research
- Annual Reports
- White Paper
- Latest Press Release
- Industry Association
- Paid Database
- Investor Presentations

Step 4 - Data Triangulation
Involves using different sources of information in order to increase the validity of a study
These sources are likely to be stakeholders in a program - participants, other researchers, program staff, other community members, and so on.
Then we put all data in single framework & apply various statistical tools to find out the dynamic on the market.
During the analysis stage, feedback from the stakeholder groups would be compared to determine areas of agreement as well as areas of divergence


