
Key Insights
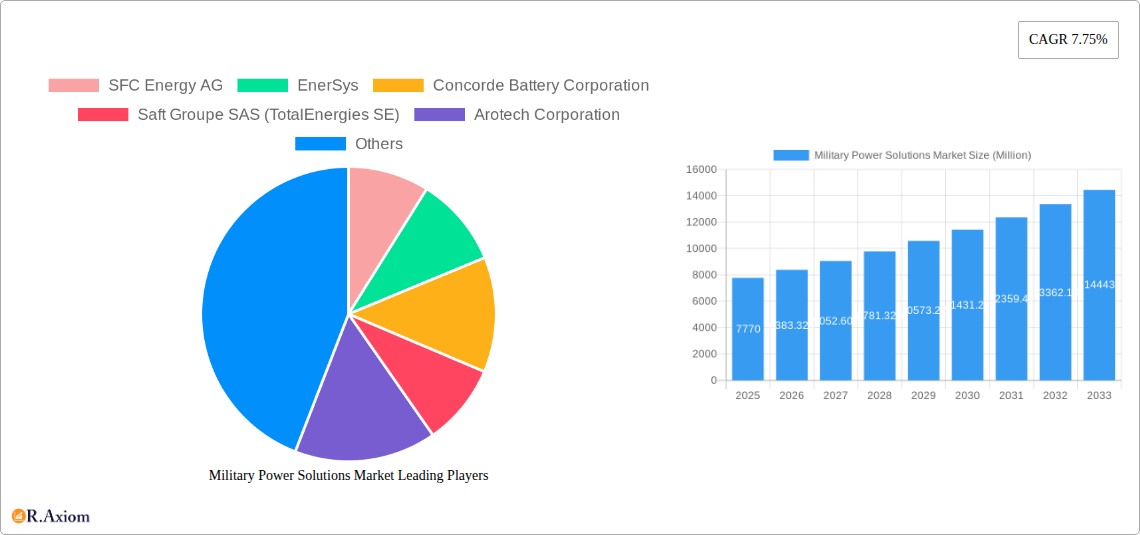
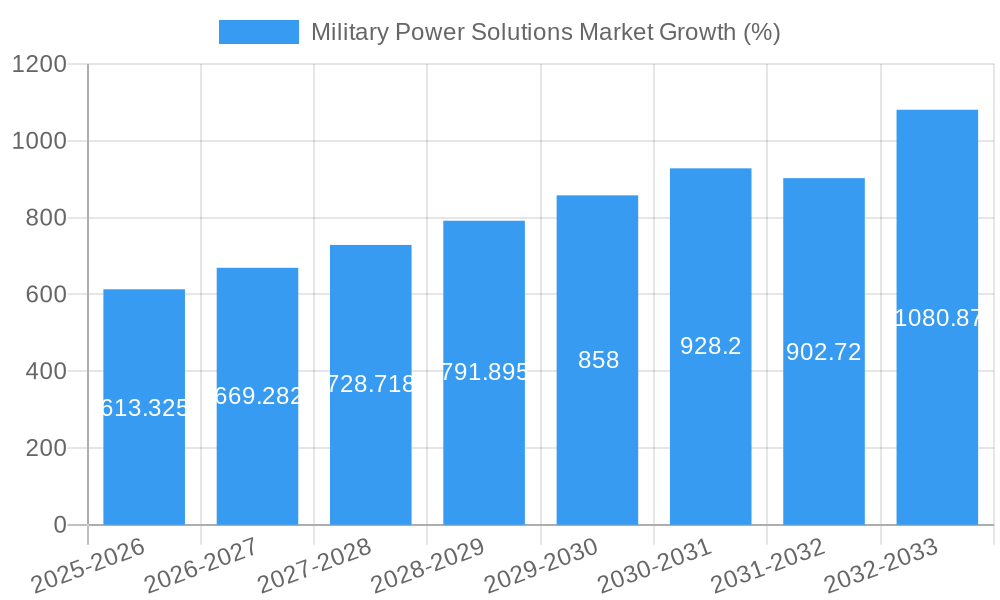
The Military Power Solutions market, valued at $7.77 billion in 2025, is projected to experience robust growth, driven by increasing defense budgets globally and the escalating demand for advanced, reliable power systems in military operations. A Compound Annual Growth Rate (CAGR) of 7.75% from 2025 to 2033 indicates a significant expansion of this market. Key drivers include the modernization of military equipment, the adoption of electric and hybrid vehicles within defense forces, and the growing need for portable power solutions in diverse terrains and operational environments. The market is segmented by type (portable and non-portable), source (batteries, generators, and other sources), and platform (air, land, and sea). Portable power solutions are witnessing strong demand due to their adaptability and portability, crucial for special operations and remote deployments. The increasing reliance on batteries, particularly advanced lithium-ion technologies, reflects a shift towards lighter, more efficient, and environmentally friendly power sources. However, challenges remain, including the high initial cost of advanced technologies, concerns regarding battery lifespan and safety, and the need for robust power management systems to optimize energy consumption. The Asia-Pacific region, particularly China and India, is expected to be a significant growth driver due to substantial investments in defense modernization and expanding military capabilities. North America and Europe will continue to hold considerable market shares, driven by ongoing upgrades to existing military infrastructure and equipment.
The competitive landscape is characterized by established players like SFC Energy AG, EnerSys, and Saft Groupe SAS, alongside emerging companies focusing on innovative power solutions. These companies are constantly striving to enhance the power density, lifespan, and safety features of their products to meet the evolving needs of the military. The market's growth trajectory is influenced by geopolitical factors, technological advancements, and evolving defense strategies. Ongoing research and development efforts focusing on fuel cells, advanced battery chemistries, and efficient power management systems will significantly shape the future of this market. The integration of smart grid technologies and improved power distribution networks will also play a crucial role in optimizing power utilization within military operations, contributing to enhanced operational efficiency and improved sustainability.
This in-depth report provides a comprehensive analysis of the Military Power Solutions market, encompassing market size, growth drivers, challenges, competitive landscape, and future outlook. The study period covers 2019-2033, with 2025 as the base year and forecast period spanning 2025-2033. This report is invaluable for industry stakeholders, investors, and strategists seeking actionable insights into this dynamic market.
Military Power Solutions Market Concentration & Innovation
The Military Power Solutions market exhibits a moderately concentrated landscape, with a few key players holding significant market share. However, the market is characterized by continuous innovation, driven by the need for enhanced power efficiency, durability, and miniaturization in military applications. Stringent regulatory frameworks, particularly concerning safety and environmental impact, influence product development and market entry. The rise of alternative energy sources, including fuel cells and advanced battery technologies, presents both opportunities and challenges to established players. Mergers and acquisitions (M&A) activities are frequent, reflecting the competitive dynamics and consolidation trends within the industry. For instance, EnerSys’ acquisition of IBCS in April 2023 strengthened its service offerings and market presence, demonstrating strategic expansion in the sector. While precise market share data for individual players is proprietary, analysis suggests that the top 5 companies collectively account for approximately xx% of the global market. M&A deal values over the past five years have averaged around USD xx Million annually, indicating significant investment in market consolidation and technological advancement. Further, government regulations regarding emissions and sustainability are pushing the industry to innovate with cleaner and more efficient power solutions. This is driving research and development in areas like advanced battery technologies and hybrid power systems. End-user trends toward increased autonomy and reliance on sophisticated electronics are increasing demand for reliable and robust power solutions, creating lucrative opportunities for innovators.
Military Power Solutions Market Industry Trends & Insights
The Military Power Solutions market is experiencing robust growth, driven by increasing defense budgets globally, modernization of military equipment, and heightened demand for advanced power systems. The Compound Annual Growth Rate (CAGR) for the forecast period (2025-2033) is projected to be xx%, propelled by technological advancements like improved battery chemistries, lighter weight generators, and more energy-efficient power management systems. Market penetration of advanced power solutions is steadily increasing, particularly in land-based platforms, reflecting the transition towards more technologically advanced military vehicles and equipment. However, the market dynamics are shaped by evolving consumer preferences for increased portability, reliability, and reduced operational costs. The competitive landscape is highly dynamic, characterized by both established players and emerging innovators. Existing companies are actively engaging in product diversification and strategic partnerships to sustain their competitive edge. This includes strategic acquisitions, joint ventures, and licensing agreements to enhance their product portfolio and broaden their reach. The increasing focus on sustainability and reducing carbon footprint is influencing technological disruptions with the adoption of renewable energy sources becoming more prevalent. This shift necessitates adjustments to existing technologies and manufacturing processes.
Dominant Markets & Segments in Military Power Solutions Market
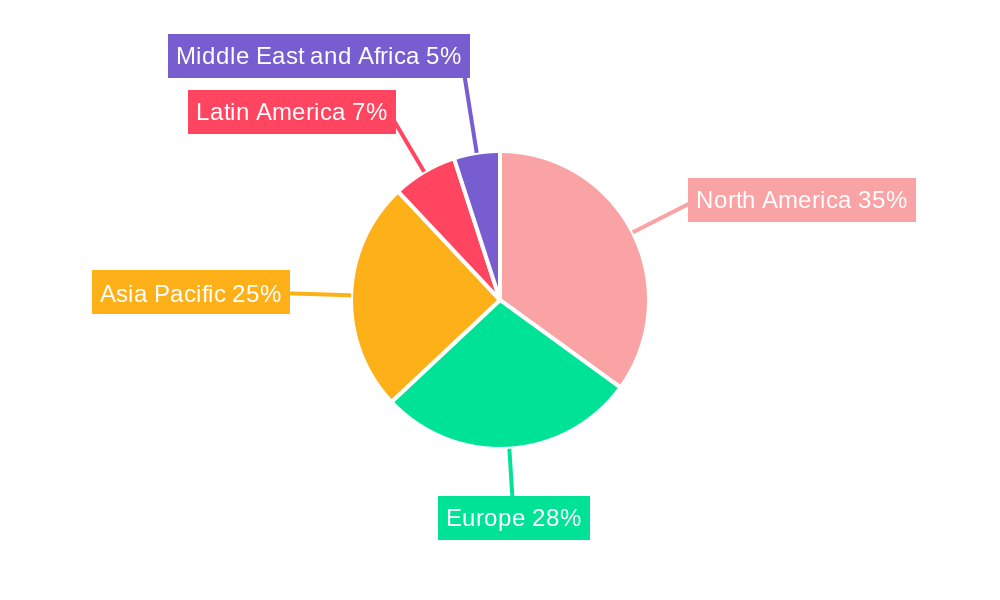
The North American region currently dominates the Military Power Solutions market, driven by significant defense spending, technological advancements, and robust domestic manufacturing capabilities. However, the Asia-Pacific region is projected to witness the fastest growth during the forecast period due to increasing military modernization efforts in several key countries. Within the segment analysis:
- By Type: The Non-portable segment holds the largest market share due to the high demand for power solutions in heavier military equipment such as tanks and ships. However, the portable segment is expected to show significant growth, fuelled by the increasing adoption of smaller, lighter, and more efficient power systems for individual soldiers and smaller units.
- By Source: Batteries currently dominate the market due to their reliability and portability, although generators retain a significant share particularly in larger applications. Other sources (fuel cells, etc.) are emerging but their market penetration remains limited for now.
- By Platform: The Land segment is the largest, primarily due to the extensive use of power solutions in ground vehicles and equipment. However, significant growth is expected in the Air and Sea segments driven by the increasing demand for advanced power systems in aerial and naval platforms. Key drivers for these segments include increased technological sophistication, autonomous systems development, and upgrades to legacy systems. For example, the increasing complexity of military aircraft and the growing adoption of electric and hybrid propulsion systems are impacting demand dynamics in the Air segment. Similarly, modernization efforts in naval fleets are driving demand for high-capacity power solutions in the Sea segment. This trend reflects the expanding capabilities and operational requirements of modern naval forces.
Military Power Solutions Market Product Developments
Significant product innovations are shaping the Military Power Solutions market, with a focus on enhancing energy density, efficiency, and lifespan. New battery technologies, such as lithium-ion batteries and solid-state batteries, offer higher energy storage capacity and faster charging times. Similarly, advancements in generator technologies are leading to smaller, lighter, and more fuel-efficient models. These developments are improving the performance, durability, and sustainability of military power solutions. The emphasis is on developing solutions that are compatible with various platforms and mission requirements, addressing the need for seamless integration and enhanced battlefield adaptability.
Report Scope & Segmentation Analysis
This report segments the Military Power Solutions market by Type (Portable, Non-portable), Source (Batteries, Generators, Other Sources), and Platform (Air, Land, Sea). Each segment is analyzed in detail, providing market size, growth projections, and competitive dynamics. The Portable segment is characterized by a focus on lightweight and compact designs, catering to individual soldiers and smaller units, while the Non-portable segment addresses larger platforms like tanks and ships. The Battery segment is expected to dominate due to advancements in energy density and reliability. The Generator segment focuses on larger-scale power requirements and often incorporates hybrid designs to enhance efficiency. Other Sources are expected to grow at a higher rate, though they currently represent a smaller market share. The Land segment currently holds a majority share but the Air and Sea segments are projected to experience significant growth driven by modernization initiatives and increased demands for high-performance systems.
Key Drivers of Military Power Solutions Market Growth
The Military Power Solutions market is driven by several factors. Firstly, escalating defense budgets across the globe are fueling demand for advanced power systems. Secondly, the increasing reliance on advanced technologies in military operations requires reliable and high-capacity power solutions. Thirdly, the ongoing modernization of military equipment necessitates upgrades to existing power systems or the adoption of entirely new ones. Finally, regulatory requirements mandating the use of more environmentally friendly power sources are creating opportunities for innovative solutions such as fuel cells and next-generation batteries.
Challenges in the Military Power Solutions Market Sector
The Military Power Solutions market faces challenges such as high manufacturing costs associated with advanced technologies and stringent quality standards. Supply chain disruptions due to geopolitical events or resource scarcity can impact production and delivery timelines. Furthermore, intense competition from established players and emerging innovators can pressure profit margins. Lastly, maintaining compliance with evolving regulatory requirements and environmental concerns may pose a considerable challenge. These factors can impact market profitability and stability.
Emerging Opportunities in Military Power Solutions Market
Emerging opportunities lie in the development of next-generation battery technologies offering significantly improved energy density, and lightweight designs which are more efficient and sustainable. Expanding into new markets, particularly those with increasing defense budgets, holds significant potential. The development of hybrid and electric power solutions for military vehicles, aircraft and naval platforms offers significant opportunities. Growing emphasis on improving soldier portability and capabilities provides further opportunities in the area of smaller, more efficient portable power systems.
Leading Players in the Military Power Solutions Market Market
- SFC Energy AG
- EnerSys
- Concorde Battery Corporation
- Saft Groupe SAS (TotalEnergies SE)
- Arotech Corporation
- RTX Corporation
- Denchi Group Ltd
- Eniquest
- HIMOINSA S
- Cummins Inc
- EaglePicher Technologies LLC
Key Developments in Military Power Solutions Market Industry
- August 2023: Collins Aerospace (RTX Corporation) awarded a USD 24 Million contract for electric generators for the US Army's Abrams M1A2 tank. This signals significant investment in advanced power solutions for key military platforms.
- April 2023: EnerSys acquired Industrial Battery and Charger Services Limited (IBCS), expanding its service capabilities and market presence in the UK. This signifies strategic consolidation within the market.
Strategic Outlook for Military Power Solutions Market Market
The Military Power Solutions market is poised for sustained growth, driven by technological advancements, increasing defense spending, and the need for reliable and efficient power systems in military applications. Future market potential lies in the development of more sustainable, efficient, and compact power solutions. The focus on hybrid and electric systems, combined with advances in battery technology, will significantly shape the future of this market. The continued adoption of autonomous and increasingly sophisticated military systems will drive the demand for reliable, robust power solutions, creating substantial opportunities for innovative companies in the sector.
Military Power Solutions Market Segmentation
-
1. Type
- 1.1. Portable
- 1.2. Non-portable
-
2. Source
- 2.1. Batteries
- 2.2. Generators
- 2.3. Other Sources
-
3. Platform
- 3.1. Air
- 3.2. Land
- 3.3. Sea
Military Power Solutions Market Segmentation By Geography
-
1. North America
- 1.1. United States
- 1.2. Canada
-
2. Europe
- 2.1. United Kingdom
- 2.2. Germany
- 2.3. France
- 2.4. Russia
- 2.5. Rest of Europe
-
3. Asia Pacific
- 3.1. China
- 3.2. India
- 3.3. Japan
- 3.4. South Korea
- 3.5. Rest of Asia Pacific
-
4. Latin America
- 4.1. Brazil
- 4.2. Rest of Latin America
-
5. Middle East and Africa
- 5.1. United Arab Emirates
- 5.2. Saudi Arabia
- 5.3. Israel
- 5.4. Rest of Middle East and Africa
Military Power Solutions Market REPORT HIGHLIGHTS
| Aspects | Details |
|---|---|
| Study Period | 2019-2033 |
| Base Year | 2024 |
| Estimated Year | 2025 |
| Forecast Period | 2025-2033 |
| Historical Period | 2019-2024 |
| Growth Rate | CAGR of 7.75% from 2019-2033 |
| Segmentation |
|
Table of Contents
- 1. Introduction
- 1.1. Research Scope
- 1.2. Market Segmentation
- 1.3. Research Methodology
- 1.4. Definitions and Assumptions
- 2. Executive Summary
- 2.1. Introduction
- 3. Market Dynamics
- 3.1. Introduction
- 3.2. Market Drivers
- 3.3. Market Restrains
- 3.4. Market Trends
- 3.4.1. Generators Segment to Continue Market Share Domination
- 4. Market Factor Analysis
- 4.1. Porters Five Forces
- 4.2. Supply/Value Chain
- 4.3. PESTEL analysis
- 4.4. Market Entropy
- 4.5. Patent/Trademark Analysis
- 5. Global Military Power Solutions Market Analysis, Insights and Forecast, 2019-2031
- 5.1. Market Analysis, Insights and Forecast - by Type
- 5.1.1. Portable
- 5.1.2. Non-portable
- 5.2. Market Analysis, Insights and Forecast - by Source
- 5.2.1. Batteries
- 5.2.2. Generators
- 5.2.3. Other Sources
- 5.3. Market Analysis, Insights and Forecast - by Platform
- 5.3.1. Air
- 5.3.2. Land
- 5.3.3. Sea
- 5.4. Market Analysis, Insights and Forecast - by Region
- 5.4.1. North America
- 5.4.2. Europe
- 5.4.3. Asia Pacific
- 5.4.4. Latin America
- 5.4.5. Middle East and Africa
- 5.1. Market Analysis, Insights and Forecast - by Type
- 6. North America Military Power Solutions Market Analysis, Insights and Forecast, 2019-2031
- 6.1. Market Analysis, Insights and Forecast - by Type
- 6.1.1. Portable
- 6.1.2. Non-portable
- 6.2. Market Analysis, Insights and Forecast - by Source
- 6.2.1. Batteries
- 6.2.2. Generators
- 6.2.3. Other Sources
- 6.3. Market Analysis, Insights and Forecast - by Platform
- 6.3.1. Air
- 6.3.2. Land
- 6.3.3. Sea
- 6.1. Market Analysis, Insights and Forecast - by Type
- 7. Europe Military Power Solutions Market Analysis, Insights and Forecast, 2019-2031
- 7.1. Market Analysis, Insights and Forecast - by Type
- 7.1.1. Portable
- 7.1.2. Non-portable
- 7.2. Market Analysis, Insights and Forecast - by Source
- 7.2.1. Batteries
- 7.2.2. Generators
- 7.2.3. Other Sources
- 7.3. Market Analysis, Insights and Forecast - by Platform
- 7.3.1. Air
- 7.3.2. Land
- 7.3.3. Sea
- 7.1. Market Analysis, Insights and Forecast - by Type
- 8. Asia Pacific Military Power Solutions Market Analysis, Insights and Forecast, 2019-2031
- 8.1. Market Analysis, Insights and Forecast - by Type
- 8.1.1. Portable
- 8.1.2. Non-portable
- 8.2. Market Analysis, Insights and Forecast - by Source
- 8.2.1. Batteries
- 8.2.2. Generators
- 8.2.3. Other Sources
- 8.3. Market Analysis, Insights and Forecast - by Platform
- 8.3.1. Air
- 8.3.2. Land
- 8.3.3. Sea
- 8.1. Market Analysis, Insights and Forecast - by Type
- 9. Latin America Military Power Solutions Market Analysis, Insights and Forecast, 2019-2031
- 9.1. Market Analysis, Insights and Forecast - by Type
- 9.1.1. Portable
- 9.1.2. Non-portable
- 9.2. Market Analysis, Insights and Forecast - by Source
- 9.2.1. Batteries
- 9.2.2. Generators
- 9.2.3. Other Sources
- 9.3. Market Analysis, Insights and Forecast - by Platform
- 9.3.1. Air
- 9.3.2. Land
- 9.3.3. Sea
- 9.1. Market Analysis, Insights and Forecast - by Type
- 10. Middle East and Africa Military Power Solutions Market Analysis, Insights and Forecast, 2019-2031
- 10.1. Market Analysis, Insights and Forecast - by Type
- 10.1.1. Portable
- 10.1.2. Non-portable
- 10.2. Market Analysis, Insights and Forecast - by Source
- 10.2.1. Batteries
- 10.2.2. Generators
- 10.2.3. Other Sources
- 10.3. Market Analysis, Insights and Forecast - by Platform
- 10.3.1. Air
- 10.3.2. Land
- 10.3.3. Sea
- 10.1. Market Analysis, Insights and Forecast - by Type
- 11. North America Military Power Solutions Market Analysis, Insights and Forecast, 2019-2031
- 11.1. Market Analysis, Insights and Forecast - By Country/Sub-region
- 11.1.1 United States
- 11.1.2 Canada
- 12. Europe Military Power Solutions Market Analysis, Insights and Forecast, 2019-2031
- 12.1. Market Analysis, Insights and Forecast - By Country/Sub-region
- 12.1.1 United Kingdom
- 12.1.2 Germany
- 12.1.3 France
- 12.1.4 Russia
- 12.1.5 Rest of Europe
- 13. Asia Pacific Military Power Solutions Market Analysis, Insights and Forecast, 2019-2031
- 13.1. Market Analysis, Insights and Forecast - By Country/Sub-region
- 13.1.1 China
- 13.1.2 India
- 13.1.3 Japan
- 13.1.4 South Korea
- 13.1.5 Rest of Asia Pacific
- 14. Latin America Military Power Solutions Market Analysis, Insights and Forecast, 2019-2031
- 14.1. Market Analysis, Insights and Forecast - By Country/Sub-region
- 14.1.1 Brazil
- 14.1.2 Rest of Latin America
- 15. Middle East and Africa Military Power Solutions Market Analysis, Insights and Forecast, 2019-2031
- 15.1. Market Analysis, Insights and Forecast - By Country/Sub-region
- 15.1.1 United Arab Emirates
- 15.1.2 Saudi Arabia
- 15.1.3 Israel
- 15.1.4 Rest of Middle East and Africa
- 16. Competitive Analysis
- 16.1. Global Market Share Analysis 2024
- 16.2. Company Profiles
- 16.2.1 SFC Energy AG
- 16.2.1.1. Overview
- 16.2.1.2. Products
- 16.2.1.3. SWOT Analysis
- 16.2.1.4. Recent Developments
- 16.2.1.5. Financials (Based on Availability)
- 16.2.2 EnerSys
- 16.2.2.1. Overview
- 16.2.2.2. Products
- 16.2.2.3. SWOT Analysis
- 16.2.2.4. Recent Developments
- 16.2.2.5. Financials (Based on Availability)
- 16.2.3 Concorde Battery Corporation
- 16.2.3.1. Overview
- 16.2.3.2. Products
- 16.2.3.3. SWOT Analysis
- 16.2.3.4. Recent Developments
- 16.2.3.5. Financials (Based on Availability)
- 16.2.4 Saft Groupe SAS (TotalEnergies SE)
- 16.2.4.1. Overview
- 16.2.4.2. Products
- 16.2.4.3. SWOT Analysis
- 16.2.4.4. Recent Developments
- 16.2.4.5. Financials (Based on Availability)
- 16.2.5 Arotech Corporation
- 16.2.5.1. Overview
- 16.2.5.2. Products
- 16.2.5.3. SWOT Analysis
- 16.2.5.4. Recent Developments
- 16.2.5.5. Financials (Based on Availability)
- 16.2.6 RTX Corporation
- 16.2.6.1. Overview
- 16.2.6.2. Products
- 16.2.6.3. SWOT Analysis
- 16.2.6.4. Recent Developments
- 16.2.6.5. Financials (Based on Availability)
- 16.2.7 Denchi Group Ltd
- 16.2.7.1. Overview
- 16.2.7.2. Products
- 16.2.7.3. SWOT Analysis
- 16.2.7.4. Recent Developments
- 16.2.7.5. Financials (Based on Availability)
- 16.2.8 Eniquest
- 16.2.8.1. Overview
- 16.2.8.2. Products
- 16.2.8.3. SWOT Analysis
- 16.2.8.4. Recent Developments
- 16.2.8.5. Financials (Based on Availability)
- 16.2.9 HIMOINSA S
- 16.2.9.1. Overview
- 16.2.9.2. Products
- 16.2.9.3. SWOT Analysis
- 16.2.9.4. Recent Developments
- 16.2.9.5. Financials (Based on Availability)
- 16.2.10 Cummins Inc
- 16.2.10.1. Overview
- 16.2.10.2. Products
- 16.2.10.3. SWOT Analysis
- 16.2.10.4. Recent Developments
- 16.2.10.5. Financials (Based on Availability)
- 16.2.11 EaglePicher Technologies LLC
- 16.2.11.1. Overview
- 16.2.11.2. Products
- 16.2.11.3. SWOT Analysis
- 16.2.11.4. Recent Developments
- 16.2.11.5. Financials (Based on Availability)
- 16.2.1 SFC Energy AG
List of Figures
- Figure 1: Global Military Power Solutions Market Revenue Breakdown (Million, %) by Region 2024 & 2032
- Figure 2: North America Military Power Solutions Market Revenue (Million), by Country 2024 & 2032
- Figure 3: North America Military Power Solutions Market Revenue Share (%), by Country 2024 & 2032
- Figure 4: Europe Military Power Solutions Market Revenue (Million), by Country 2024 & 2032
- Figure 5: Europe Military Power Solutions Market Revenue Share (%), by Country 2024 & 2032
- Figure 6: Asia Pacific Military Power Solutions Market Revenue (Million), by Country 2024 & 2032
- Figure 7: Asia Pacific Military Power Solutions Market Revenue Share (%), by Country 2024 & 2032
- Figure 8: Latin America Military Power Solutions Market Revenue (Million), by Country 2024 & 2032
- Figure 9: Latin America Military Power Solutions Market Revenue Share (%), by Country 2024 & 2032
- Figure 10: Middle East and Africa Military Power Solutions Market Revenue (Million), by Country 2024 & 2032
- Figure 11: Middle East and Africa Military Power Solutions Market Revenue Share (%), by Country 2024 & 2032
- Figure 12: North America Military Power Solutions Market Revenue (Million), by Type 2024 & 2032
- Figure 13: North America Military Power Solutions Market Revenue Share (%), by Type 2024 & 2032
- Figure 14: North America Military Power Solutions Market Revenue (Million), by Source 2024 & 2032
- Figure 15: North America Military Power Solutions Market Revenue Share (%), by Source 2024 & 2032
- Figure 16: North America Military Power Solutions Market Revenue (Million), by Platform 2024 & 2032
- Figure 17: North America Military Power Solutions Market Revenue Share (%), by Platform 2024 & 2032
- Figure 18: North America Military Power Solutions Market Revenue (Million), by Country 2024 & 2032
- Figure 19: North America Military Power Solutions Market Revenue Share (%), by Country 2024 & 2032
- Figure 20: Europe Military Power Solutions Market Revenue (Million), by Type 2024 & 2032
- Figure 21: Europe Military Power Solutions Market Revenue Share (%), by Type 2024 & 2032
- Figure 22: Europe Military Power Solutions Market Revenue (Million), by Source 2024 & 2032
- Figure 23: Europe Military Power Solutions Market Revenue Share (%), by Source 2024 & 2032
- Figure 24: Europe Military Power Solutions Market Revenue (Million), by Platform 2024 & 2032
- Figure 25: Europe Military Power Solutions Market Revenue Share (%), by Platform 2024 & 2032
- Figure 26: Europe Military Power Solutions Market Revenue (Million), by Country 2024 & 2032
- Figure 27: Europe Military Power Solutions Market Revenue Share (%), by Country 2024 & 2032
- Figure 28: Asia Pacific Military Power Solutions Market Revenue (Million), by Type 2024 & 2032
- Figure 29: Asia Pacific Military Power Solutions Market Revenue Share (%), by Type 2024 & 2032
- Figure 30: Asia Pacific Military Power Solutions Market Revenue (Million), by Source 2024 & 2032
- Figure 31: Asia Pacific Military Power Solutions Market Revenue Share (%), by Source 2024 & 2032
- Figure 32: Asia Pacific Military Power Solutions Market Revenue (Million), by Platform 2024 & 2032
- Figure 33: Asia Pacific Military Power Solutions Market Revenue Share (%), by Platform 2024 & 2032
- Figure 34: Asia Pacific Military Power Solutions Market Revenue (Million), by Country 2024 & 2032
- Figure 35: Asia Pacific Military Power Solutions Market Revenue Share (%), by Country 2024 & 2032
- Figure 36: Latin America Military Power Solutions Market Revenue (Million), by Type 2024 & 2032
- Figure 37: Latin America Military Power Solutions Market Revenue Share (%), by Type 2024 & 2032
- Figure 38: Latin America Military Power Solutions Market Revenue (Million), by Source 2024 & 2032
- Figure 39: Latin America Military Power Solutions Market Revenue Share (%), by Source 2024 & 2032
- Figure 40: Latin America Military Power Solutions Market Revenue (Million), by Platform 2024 & 2032
- Figure 41: Latin America Military Power Solutions Market Revenue Share (%), by Platform 2024 & 2032
- Figure 42: Latin America Military Power Solutions Market Revenue (Million), by Country 2024 & 2032
- Figure 43: Latin America Military Power Solutions Market Revenue Share (%), by Country 2024 & 2032
- Figure 44: Middle East and Africa Military Power Solutions Market Revenue (Million), by Type 2024 & 2032
- Figure 45: Middle East and Africa Military Power Solutions Market Revenue Share (%), by Type 2024 & 2032
- Figure 46: Middle East and Africa Military Power Solutions Market Revenue (Million), by Source 2024 & 2032
- Figure 47: Middle East and Africa Military Power Solutions Market Revenue Share (%), by Source 2024 & 2032
- Figure 48: Middle East and Africa Military Power Solutions Market Revenue (Million), by Platform 2024 & 2032
- Figure 49: Middle East and Africa Military Power Solutions Market Revenue Share (%), by Platform 2024 & 2032
- Figure 50: Middle East and Africa Military Power Solutions Market Revenue (Million), by Country 2024 & 2032
- Figure 51: Middle East and Africa Military Power Solutions Market Revenue Share (%), by Country 2024 & 2032
List of Tables
- Table 1: Global Military Power Solutions Market Revenue Million Forecast, by Region 2019 & 2032
- Table 2: Global Military Power Solutions Market Revenue Million Forecast, by Type 2019 & 2032
- Table 3: Global Military Power Solutions Market Revenue Million Forecast, by Source 2019 & 2032
- Table 4: Global Military Power Solutions Market Revenue Million Forecast, by Platform 2019 & 2032
- Table 5: Global Military Power Solutions Market Revenue Million Forecast, by Region 2019 & 2032
- Table 6: Global Military Power Solutions Market Revenue Million Forecast, by Country 2019 & 2032
- Table 7: United States Military Power Solutions Market Revenue (Million) Forecast, by Application 2019 & 2032
- Table 8: Canada Military Power Solutions Market Revenue (Million) Forecast, by Application 2019 & 2032
- Table 9: Global Military Power Solutions Market Revenue Million Forecast, by Country 2019 & 2032
- Table 10: United Kingdom Military Power Solutions Market Revenue (Million) Forecast, by Application 2019 & 2032
- Table 11: Germany Military Power Solutions Market Revenue (Million) Forecast, by Application 2019 & 2032
- Table 12: France Military Power Solutions Market Revenue (Million) Forecast, by Application 2019 & 2032
- Table 13: Russia Military Power Solutions Market Revenue (Million) Forecast, by Application 2019 & 2032
- Table 14: Rest of Europe Military Power Solutions Market Revenue (Million) Forecast, by Application 2019 & 2032
- Table 15: Global Military Power Solutions Market Revenue Million Forecast, by Country 2019 & 2032
- Table 16: China Military Power Solutions Market Revenue (Million) Forecast, by Application 2019 & 2032
- Table 17: India Military Power Solutions Market Revenue (Million) Forecast, by Application 2019 & 2032
- Table 18: Japan Military Power Solutions Market Revenue (Million) Forecast, by Application 2019 & 2032
- Table 19: South Korea Military Power Solutions Market Revenue (Million) Forecast, by Application 2019 & 2032
- Table 20: Rest of Asia Pacific Military Power Solutions Market Revenue (Million) Forecast, by Application 2019 & 2032
- Table 21: Global Military Power Solutions Market Revenue Million Forecast, by Country 2019 & 2032
- Table 22: Brazil Military Power Solutions Market Revenue (Million) Forecast, by Application 2019 & 2032
- Table 23: Rest of Latin America Military Power Solutions Market Revenue (Million) Forecast, by Application 2019 & 2032
- Table 24: Global Military Power Solutions Market Revenue Million Forecast, by Country 2019 & 2032
- Table 25: United Arab Emirates Military Power Solutions Market Revenue (Million) Forecast, by Application 2019 & 2032
- Table 26: Saudi Arabia Military Power Solutions Market Revenue (Million) Forecast, by Application 2019 & 2032
- Table 27: Israel Military Power Solutions Market Revenue (Million) Forecast, by Application 2019 & 2032
- Table 28: Rest of Middle East and Africa Military Power Solutions Market Revenue (Million) Forecast, by Application 2019 & 2032
- Table 29: Global Military Power Solutions Market Revenue Million Forecast, by Type 2019 & 2032
- Table 30: Global Military Power Solutions Market Revenue Million Forecast, by Source 2019 & 2032
- Table 31: Global Military Power Solutions Market Revenue Million Forecast, by Platform 2019 & 2032
- Table 32: Global Military Power Solutions Market Revenue Million Forecast, by Country 2019 & 2032
- Table 33: United States Military Power Solutions Market Revenue (Million) Forecast, by Application 2019 & 2032
- Table 34: Canada Military Power Solutions Market Revenue (Million) Forecast, by Application 2019 & 2032
- Table 35: Global Military Power Solutions Market Revenue Million Forecast, by Type 2019 & 2032
- Table 36: Global Military Power Solutions Market Revenue Million Forecast, by Source 2019 & 2032
- Table 37: Global Military Power Solutions Market Revenue Million Forecast, by Platform 2019 & 2032
- Table 38: Global Military Power Solutions Market Revenue Million Forecast, by Country 2019 & 2032
- Table 39: United Kingdom Military Power Solutions Market Revenue (Million) Forecast, by Application 2019 & 2032
- Table 40: Germany Military Power Solutions Market Revenue (Million) Forecast, by Application 2019 & 2032
- Table 41: France Military Power Solutions Market Revenue (Million) Forecast, by Application 2019 & 2032
- Table 42: Russia Military Power Solutions Market Revenue (Million) Forecast, by Application 2019 & 2032
- Table 43: Rest of Europe Military Power Solutions Market Revenue (Million) Forecast, by Application 2019 & 2032
- Table 44: Global Military Power Solutions Market Revenue Million Forecast, by Type 2019 & 2032
- Table 45: Global Military Power Solutions Market Revenue Million Forecast, by Source 2019 & 2032
- Table 46: Global Military Power Solutions Market Revenue Million Forecast, by Platform 2019 & 2032
- Table 47: Global Military Power Solutions Market Revenue Million Forecast, by Country 2019 & 2032
- Table 48: China Military Power Solutions Market Revenue (Million) Forecast, by Application 2019 & 2032
- Table 49: India Military Power Solutions Market Revenue (Million) Forecast, by Application 2019 & 2032
- Table 50: Japan Military Power Solutions Market Revenue (Million) Forecast, by Application 2019 & 2032
- Table 51: South Korea Military Power Solutions Market Revenue (Million) Forecast, by Application 2019 & 2032
- Table 52: Rest of Asia Pacific Military Power Solutions Market Revenue (Million) Forecast, by Application 2019 & 2032
- Table 53: Global Military Power Solutions Market Revenue Million Forecast, by Type 2019 & 2032
- Table 54: Global Military Power Solutions Market Revenue Million Forecast, by Source 2019 & 2032
- Table 55: Global Military Power Solutions Market Revenue Million Forecast, by Platform 2019 & 2032
- Table 56: Global Military Power Solutions Market Revenue Million Forecast, by Country 2019 & 2032
- Table 57: Brazil Military Power Solutions Market Revenue (Million) Forecast, by Application 2019 & 2032
- Table 58: Rest of Latin America Military Power Solutions Market Revenue (Million) Forecast, by Application 2019 & 2032
- Table 59: Global Military Power Solutions Market Revenue Million Forecast, by Type 2019 & 2032
- Table 60: Global Military Power Solutions Market Revenue Million Forecast, by Source 2019 & 2032
- Table 61: Global Military Power Solutions Market Revenue Million Forecast, by Platform 2019 & 2032
- Table 62: Global Military Power Solutions Market Revenue Million Forecast, by Country 2019 & 2032
- Table 63: United Arab Emirates Military Power Solutions Market Revenue (Million) Forecast, by Application 2019 & 2032
- Table 64: Saudi Arabia Military Power Solutions Market Revenue (Million) Forecast, by Application 2019 & 2032
- Table 65: Israel Military Power Solutions Market Revenue (Million) Forecast, by Application 2019 & 2032
- Table 66: Rest of Middle East and Africa Military Power Solutions Market Revenue (Million) Forecast, by Application 2019 & 2032
Frequently Asked Questions
1. What is the projected Compound Annual Growth Rate (CAGR) of the Military Power Solutions Market?
The projected CAGR is approximately 7.75%.
2. Which companies are prominent players in the Military Power Solutions Market?
Key companies in the market include SFC Energy AG, EnerSys, Concorde Battery Corporation, Saft Groupe SAS (TotalEnergies SE), Arotech Corporation, RTX Corporation, Denchi Group Ltd, Eniquest, HIMOINSA S, Cummins Inc, EaglePicher Technologies LLC.
3. What are the main segments of the Military Power Solutions Market?
The market segments include Type, Source, Platform.
4. Can you provide details about the market size?
The market size is estimated to be USD 7.77 Million as of 2022.
5. What are some drivers contributing to market growth?
N/A
6. What are the notable trends driving market growth?
Generators Segment to Continue Market Share Domination.
7. Are there any restraints impacting market growth?
N/A
8. Can you provide examples of recent developments in the market?
August 2023: Collins Aerospace, a part of RTX Corporation, was awarded a USD 24 million contract for producing and delivering electric generators with containers to the USArmy Anniston Depot to support its Abrams M1A2 Main Battle Tank.
9. What pricing options are available for accessing the report?
Pricing options include single-user, multi-user, and enterprise licenses priced at USD 4750, USD 5250, and USD 8750 respectively.
10. Is the market size provided in terms of value or volume?
The market size is provided in terms of value, measured in Million.
11. Are there any specific market keywords associated with the report?
Yes, the market keyword associated with the report is "Military Power Solutions Market," which aids in identifying and referencing the specific market segment covered.
12. How do I determine which pricing option suits my needs best?
The pricing options vary based on user requirements and access needs. Individual users may opt for single-user licenses, while businesses requiring broader access may choose multi-user or enterprise licenses for cost-effective access to the report.
13. Are there any additional resources or data provided in the Military Power Solutions Market report?
While the report offers comprehensive insights, it's advisable to review the specific contents or supplementary materials provided to ascertain if additional resources or data are available.
14. How can I stay updated on further developments or reports in the Military Power Solutions Market?
To stay informed about further developments, trends, and reports in the Military Power Solutions Market, consider subscribing to industry newsletters, following relevant companies and organizations, or regularly checking reputable industry news sources and publications.
Methodology
Step 1 - Identification of Relevant Samples Size from Population Database


Step 2 - Approaches for Defining Global Market Size (Value, Volume* & Price*)

Note*: In applicable scenarios
Step 3 - Data Sources
Primary Research
- Web Analytics
- Survey Reports
- Research Institute
- Latest Research Reports
- Opinion Leaders
Secondary Research
- Annual Reports
- White Paper
- Latest Press Release
- Industry Association
- Paid Database
- Investor Presentations

Step 4 - Data Triangulation
Involves using different sources of information in order to increase the validity of a study
These sources are likely to be stakeholders in a program - participants, other researchers, program staff, other community members, and so on.
Then we put all data in single framework & apply various statistical tools to find out the dynamic on the market.
During the analysis stage, feedback from the stakeholder groups would be compared to determine areas of agreement as well as areas of divergence


