
Key Insights
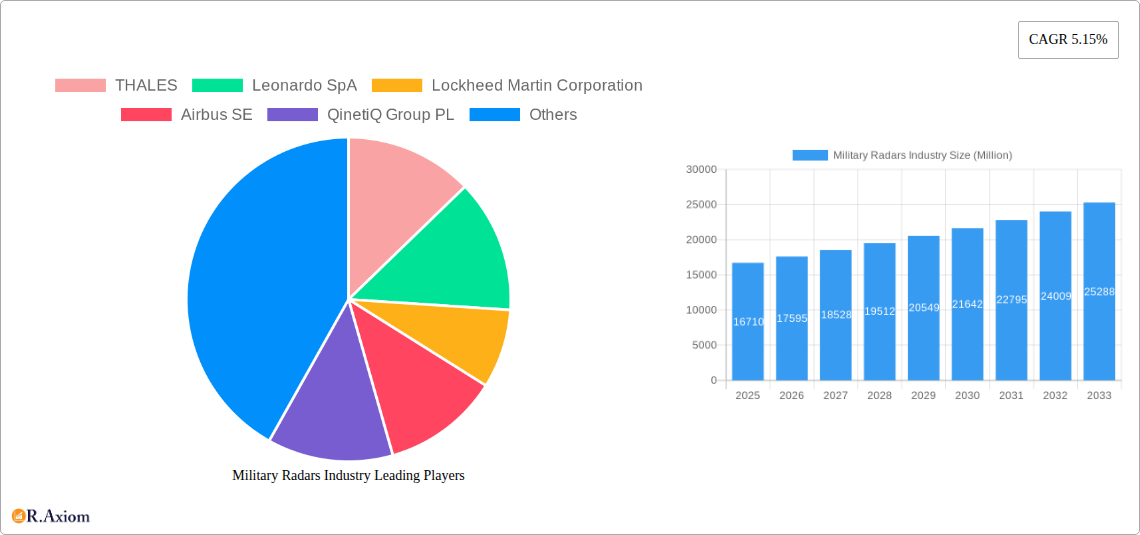
The Military Radars market, valued at $16.71 billion in 2025, is projected to experience robust growth, driven by escalating geopolitical tensions, the increasing demand for advanced surveillance and air defense systems, and the modernization of existing military infrastructure globally. A Compound Annual Growth Rate (CAGR) of 5.15% is anticipated from 2025 to 2033, indicating a significant expansion of the market. Key growth drivers include the rising adoption of advanced technologies such as AESA (Active Electronically Scanned Array) radars offering improved accuracy, range, and multi-target tracking capabilities. Furthermore, the increasing integration of radar systems with other defense platforms, including unmanned aerial vehicles (UAVs) and satellites, is contributing to market expansion. The demand is particularly strong in regions experiencing heightened security concerns, such as North America, Europe, and the Asia-Pacific region, where significant investments in defense modernization are underway. Market segmentation reveals robust demand across various applications, including air and missile defense, ISR (Intelligence, Surveillance, and Reconnaissance), navigation and weapon guidance, and space situational awareness. Ground-based radars currently dominate the market due to their widespread deployment and versatility, although airborne and naval radar systems are experiencing rapid growth due to technological advancements. Competition in the market is intense, with major players such as Thales, Lockheed Martin, and Raytheon Technologies continually investing in R&D to maintain their market share and introduce innovative radar technologies.
The market’s growth trajectory is influenced by several factors. Technological advancements, particularly in the development of miniaturized, high-performance components, are enabling the integration of advanced radar functionalities into smaller platforms. However, the market also faces restraints such as high initial investment costs associated with developing and deploying sophisticated radar systems and the need for continuous maintenance and upgrades to ensure operational effectiveness. Despite these challenges, the long-term outlook for the Military Radars market remains positive, fuelled by sustained defense spending and the continuous need for enhanced surveillance and defensive capabilities in a complex geopolitical environment. The increasing focus on cybersecurity for critical defense systems also represents both a challenge and an opportunity for market growth.
Military Radars Industry: A Comprehensive Market Report (2019-2033)
This in-depth report provides a comprehensive analysis of the Military Radars industry, offering valuable insights into market dynamics, key players, and future growth prospects. Covering the period from 2019 to 2033, with a focus on 2025, this report is essential for industry stakeholders, investors, and strategic decision-makers seeking a clear understanding of this dynamic sector. The report utilizes a robust methodology, combining primary and secondary research to deliver precise market sizing and forecasting.
Military Radars Industry Market Concentration & Innovation
The Military Radars industry exhibits a moderately concentrated market structure, with a handful of major players holding significant market share. THALES, Leonardo SpA, Lockheed Martin Corporation, and Airbus SE are among the leading companies, collectively accounting for an estimated xx% of the global market in 2025. Market concentration is influenced by high barriers to entry, including substantial R&D investments, stringent regulatory approvals, and the need for specialized expertise.
Innovation Drivers:
- Advancements in Active Electronically Scanned Array (AESA) technology.
- Integration of Artificial Intelligence (AI) and Machine Learning (ML) for enhanced target detection and tracking.
- Development of miniaturized and lightweight radar systems for unmanned aerial vehicles (UAVs).
Regulatory Frameworks: Stringent export controls and national security regulations significantly impact market dynamics. Mergers and acquisitions (M&A) activity has been moderate, with deal values totaling approximately $xx Million in the last five years. Notable acquisitions include [Insert Specific M&A examples with values if available, otherwise state "Specific details unavailable due to data limitations."]. End-user trends favor increased adoption of sophisticated radar systems with advanced capabilities, driving innovation and technological advancements within the sector. Product substitutes, such as advanced optical sensors and electronic warfare systems, pose a limited competitive threat currently, but this could change with future technological advancements.
Military Radars Industry Industry Trends & Insights
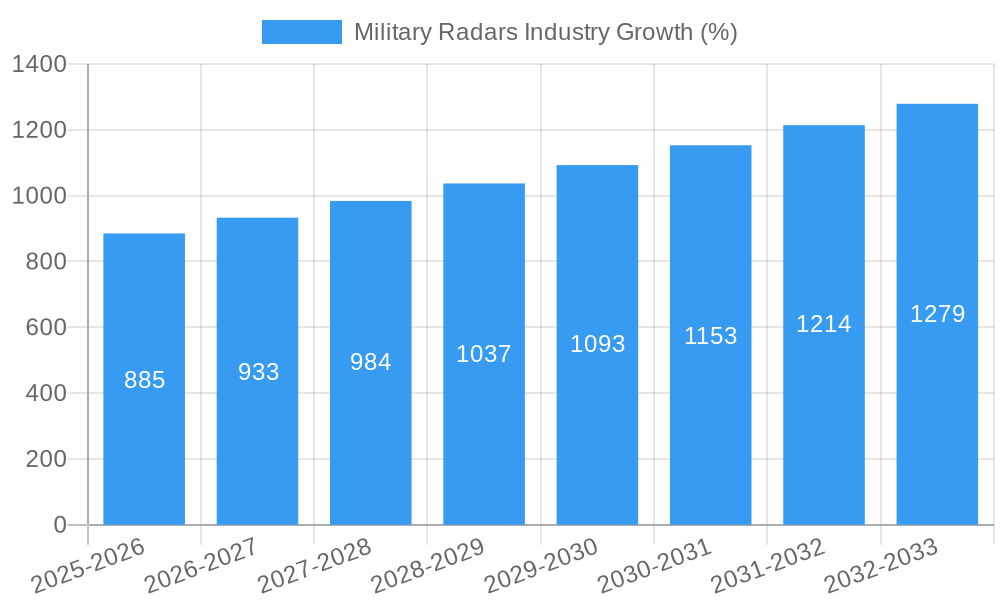
The Military Radars market is experiencing robust growth, driven by increasing geopolitical instability and the rising demand for advanced defense systems. The global market size reached $xx Million in 2025 and is projected to grow at a Compound Annual Growth Rate (CAGR) of xx% from 2025 to 2033, reaching $xx Million by the end of the forecast period. This growth is fueled by several factors:
- Increased defense budgets globally.
- Modernization of existing radar infrastructure.
- Growing adoption of UAVs and other unmanned systems.
- Demand for improved situational awareness and enhanced threat detection capabilities.
- Technological advancements leading to improved radar performance and functionalities.
Market penetration of advanced radar technologies such as AESA and multi-function radars is increasing steadily, indicating a shift towards sophisticated and integrated systems. Competitive dynamics are characterized by intense competition among leading players, focusing on technological innovation, cost optimization, and strategic partnerships to secure market share.
Dominant Markets & Segments in Military Radars Industry
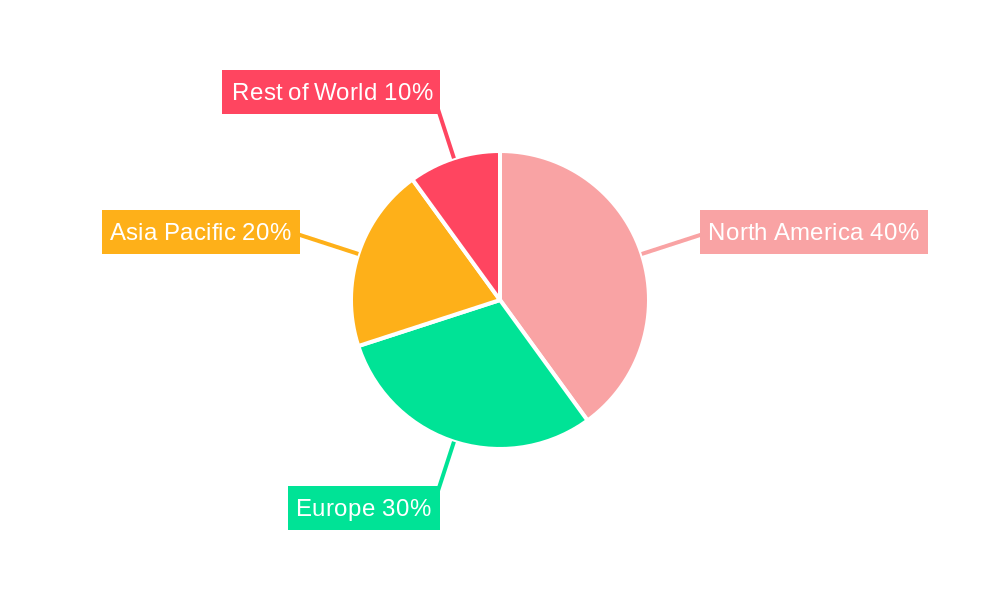
The North American region dominates the global military radars market, accounting for approximately xx% of the market share in 2025. This dominance is attributable to significant defense budgets, technological advancements, and the presence of major radar manufacturers. However, the Asia-Pacific region is expected to witness the highest growth rate during the forecast period, driven by rising defense expenditure and increasing modernization efforts.
Dominant Segments:
- Platform: Airborne radars hold the largest market share due to their crucial role in air superiority and surveillance operations.
- Application: Air and Missile Defense systems represent a significant segment, owing to the heightened need for effective defense against evolving threats. ISR (Intelligence, Surveillance, and Reconnaissance) applications also contribute substantially to market growth.
- Component: Antennas and Digital Signal Processors (DSPs) are major revenue-generating components, with continued demand for advanced features such as high resolution and improved signal processing capabilities.
Key Drivers: Strong government support for defense programs, technological advancements (e.g., AESA, AI), and a growing need for enhanced security are key growth drivers in the dominant regions and segments. Development of robust infrastructure and favorable economic policies further contribute to market expansion.
Military Radars Industry Product Developments
Recent product innovations focus on enhancing radar performance through increased range, accuracy, and target discrimination. The integration of AI and ML enables improved threat assessment and automated decision-making. Miniaturization and improved power efficiency are key features driving the adoption of military radars in diverse platforms, including UAVs and smaller naval vessels. These advancements offer significant competitive advantages, enabling manufacturers to cater to evolving operational requirements and maintain a leading position in the market.
Report Scope & Segmentation Analysis
This report provides a granular analysis of the Military Radars market, segmented by platform (Ground-based, Naval, Airborne, Space), application (Air and Missile Defense, ISR, Navigation and Weapon Guidance, Space Situational Awareness, Other Applications), and component (Antennas, Transmitters, Receivers, Power Amplifiers, Duplexers, Digital Signal Processors, Stabilization Systems, Graphical User Interfaces). Each segment is analyzed based on its market size, growth projections, and competitive dynamics. Growth projections vary by segment, reflecting the unique market drivers and challenges. For instance, the airborne segment is expected to experience significant growth driven by increased demand for UAVs.
Key Drivers of Military Radars Industry Growth
Technological advancements such as AESA technology, AI integration, and miniaturization are primary growth drivers. Increased defense spending by governments worldwide, coupled with modernization programs, significantly impacts market expansion. Furthermore, the rise of asymmetric warfare and the need for improved situational awareness provide further impetus for industry growth. The growing adoption of UAVs and other unmanned systems also contributes significantly to the market's expansion.
Challenges in the Military Radars Industry Sector
The Military Radars industry faces challenges such as the high cost of R&D, stringent regulatory approvals, and complex supply chains that can be susceptible to disruptions. Intense competition among established players, coupled with the emergence of new technologies, creates pressure on pricing and profit margins. Supply chain vulnerabilities, particularly related to the sourcing of critical components, pose a significant risk to production and delivery schedules. Estimated impacts on market growth are difficult to quantify precisely but are expected to be significant in certain periods.
Emerging Opportunities in Military Radars Industry
Emerging opportunities lie in the development of advanced radar systems with improved capabilities, such as multi-function radars and hyperspectral imaging integration. The increasing integration of AI and ML offers significant potential for enhancing radar performance and efficiency. Expansion into new markets, particularly in developing nations with growing defense budgets, presents significant growth opportunities. New applications, such as space-based radars and advanced air traffic management systems, are also driving market expansion.
Leading Players in the Military Radars Industry Market
- THALES
- Leonardo SpA
- Lockheed Martin Corporation
- Airbus SE
- QinetiQ Group PL
- Teledyne Technologies Incorporated
- BAE Systems PLC
- RTX Corporation
- HENSOLDT Holding Germany GmbH
- Israel Aerospace Industries Ltd
- Northrop Grumman Corporation
- Saab AB
Key Developments in Military Radars Industry Industry
- January 2023: Lockheed Martin announces the successful testing of a new AESA radar system.
- June 2022: THALES and Leonardo SpA form a strategic partnership for the development of a next-generation radar technology.
- October 2021: Airbus SE launches a new compact radar system for UAV applications.
- [Add more key developments with dates as available]
Strategic Outlook for Military Radars Industry Market
The Military Radars market is poised for continued growth, driven by technological innovation, increased defense spending, and the growing demand for sophisticated defense systems. Emerging technologies such as AI and ML will play a critical role in shaping the future of the industry. Opportunities exist in the development of advanced radar systems for diverse platforms and applications, including UAVs, space-based platforms, and advanced air traffic management systems. The market’s future potential is significant, offering substantial opportunities for innovation and growth for companies positioned to capitalize on these trends.
Military Radars Industry Segmentation
- 1. Production Analysis
- 2. Consumption Analysis
- 3. Import Market Analysis (Value & Volume)
- 4. Export Market Analysis (Value & Volume)
- 5. Price Trend Analysis
Military Radars Industry Segmentation By Geography
-
1. North America
- 1.1. United States
- 1.2. Canada
- 1.3. Mexico
-
2. South America
- 2.1. Brazil
- 2.2. Argentina
- 2.3. Rest of South America
-
3. Europe
- 3.1. United Kingdom
- 3.2. Germany
- 3.3. France
- 3.4. Italy
- 3.5. Spain
- 3.6. Russia
- 3.7. Benelux
- 3.8. Nordics
- 3.9. Rest of Europe
-
4. Middle East & Africa
- 4.1. Turkey
- 4.2. Israel
- 4.3. GCC
- 4.4. North Africa
- 4.5. South Africa
- 4.6. Rest of Middle East & Africa
-
5. Asia Pacific
- 5.1. China
- 5.2. India
- 5.3. Japan
- 5.4. South Korea
- 5.5. ASEAN
- 5.6. Oceania
- 5.7. Rest of Asia Pacific
Military Radars Industry REPORT HIGHLIGHTS
| Aspects | Details |
|---|---|
| Study Period | 2019-2033 |
| Base Year | 2024 |
| Estimated Year | 2025 |
| Forecast Period | 2025-2033 |
| Historical Period | 2019-2024 |
| Growth Rate | CAGR of 5.15% from 2019-2033 |
| Segmentation |
|
Table of Contents
- 1. Introduction
- 1.1. Research Scope
- 1.2. Market Segmentation
- 1.3. Research Methodology
- 1.4. Definitions and Assumptions
- 2. Executive Summary
- 2.1. Introduction
- 3. Market Dynamics
- 3.1. Introduction
- 3.2. Market Drivers
- 3.2.1. Increase in Internet of Things (IoT) and Autonomous Systems; Rise in Demand for Military and Defense Satellite Communication Solutions
- 3.3. Market Restrains
- 3.3.1. Cybersecurity Threats to Satellite Communication; Interference in Transmission of Data
- 3.4. Market Trends
- 3.4.1. Airborne Segment Expected to Register the Highest CAGR During the Forecast Period
- 4. Market Factor Analysis
- 4.1. Porters Five Forces
- 4.2. Supply/Value Chain
- 4.3. PESTEL analysis
- 4.4. Market Entropy
- 4.5. Patent/Trademark Analysis
- 5. Global Military Radars Industry Analysis, Insights and Forecast, 2019-2031
- 5.1. Market Analysis, Insights and Forecast - by Production Analysis
- 5.2. Market Analysis, Insights and Forecast - by Consumption Analysis
- 5.3. Market Analysis, Insights and Forecast - by Import Market Analysis (Value & Volume)
- 5.4. Market Analysis, Insights and Forecast - by Export Market Analysis (Value & Volume)
- 5.5. Market Analysis, Insights and Forecast - by Price Trend Analysis
- 5.6. Market Analysis, Insights and Forecast - by Region
- 5.6.1. North America
- 5.6.2. South America
- 5.6.3. Europe
- 5.6.4. Middle East & Africa
- 5.6.5. Asia Pacific
- 5.1. Market Analysis, Insights and Forecast - by Production Analysis
- 6. North America Military Radars Industry Analysis, Insights and Forecast, 2019-2031
- 6.1. Market Analysis, Insights and Forecast - by Production Analysis
- 6.2. Market Analysis, Insights and Forecast - by Consumption Analysis
- 6.3. Market Analysis, Insights and Forecast - by Import Market Analysis (Value & Volume)
- 6.4. Market Analysis, Insights and Forecast - by Export Market Analysis (Value & Volume)
- 6.5. Market Analysis, Insights and Forecast - by Price Trend Analysis
- 6.1. Market Analysis, Insights and Forecast - by Production Analysis
- 7. South America Military Radars Industry Analysis, Insights and Forecast, 2019-2031
- 7.1. Market Analysis, Insights and Forecast - by Production Analysis
- 7.2. Market Analysis, Insights and Forecast - by Consumption Analysis
- 7.3. Market Analysis, Insights and Forecast - by Import Market Analysis (Value & Volume)
- 7.4. Market Analysis, Insights and Forecast - by Export Market Analysis (Value & Volume)
- 7.5. Market Analysis, Insights and Forecast - by Price Trend Analysis
- 7.1. Market Analysis, Insights and Forecast - by Production Analysis
- 8. Europe Military Radars Industry Analysis, Insights and Forecast, 2019-2031
- 8.1. Market Analysis, Insights and Forecast - by Production Analysis
- 8.2. Market Analysis, Insights and Forecast - by Consumption Analysis
- 8.3. Market Analysis, Insights and Forecast - by Import Market Analysis (Value & Volume)
- 8.4. Market Analysis, Insights and Forecast - by Export Market Analysis (Value & Volume)
- 8.5. Market Analysis, Insights and Forecast - by Price Trend Analysis
- 8.1. Market Analysis, Insights and Forecast - by Production Analysis
- 9. Middle East & Africa Military Radars Industry Analysis, Insights and Forecast, 2019-2031
- 9.1. Market Analysis, Insights and Forecast - by Production Analysis
- 9.2. Market Analysis, Insights and Forecast - by Consumption Analysis
- 9.3. Market Analysis, Insights and Forecast - by Import Market Analysis (Value & Volume)
- 9.4. Market Analysis, Insights and Forecast - by Export Market Analysis (Value & Volume)
- 9.5. Market Analysis, Insights and Forecast - by Price Trend Analysis
- 9.1. Market Analysis, Insights and Forecast - by Production Analysis
- 10. Asia Pacific Military Radars Industry Analysis, Insights and Forecast, 2019-2031
- 10.1. Market Analysis, Insights and Forecast - by Production Analysis
- 10.2. Market Analysis, Insights and Forecast - by Consumption Analysis
- 10.3. Market Analysis, Insights and Forecast - by Import Market Analysis (Value & Volume)
- 10.4. Market Analysis, Insights and Forecast - by Export Market Analysis (Value & Volume)
- 10.5. Market Analysis, Insights and Forecast - by Price Trend Analysis
- 10.1. Market Analysis, Insights and Forecast - by Production Analysis
- 11. North America Military Radars Industry Analysis, Insights and Forecast, 2019-2031
- 11.1. Market Analysis, Insights and Forecast - By Country/Sub-region
- 11.1.1 United States
- 11.1.2 Canada
- 12. Europe Military Radars Industry Analysis, Insights and Forecast, 2019-2031
- 12.1. Market Analysis, Insights and Forecast - By Country/Sub-region
- 12.1.1 United Kingdom
- 12.1.2 Germany
- 12.1.3 France
- 12.1.4 Russia
- 12.1.5 Rest of Europe
- 13. Asia Pacific Military Radars Industry Analysis, Insights and Forecast, 2019-2031
- 13.1. Market Analysis, Insights and Forecast - By Country/Sub-region
- 13.1.1 China
- 13.1.2 India
- 13.1.3 Japan
- 13.1.4 South Korea
- 13.1.5 Rest of Asia Pacific
- 14. Latin America Military Radars Industry Analysis, Insights and Forecast, 2019-2031
- 14.1. Market Analysis, Insights and Forecast - By Country/Sub-region
- 14.1.1 Brazil
- 14.1.2 Rest of Latin America
- 15. Middle East and Africa Military Radars Industry Analysis, Insights and Forecast, 2019-2031
- 15.1. Market Analysis, Insights and Forecast - By Country/Sub-region
- 15.1.1 United Arab Emirates
- 15.1.2 Saudi Arabia
- 15.1.3 Egypt
- 15.1.4 Rest of Middle East and Africa
- 16. Competitive Analysis
- 16.1. Global Market Share Analysis 2024
- 16.2. Company Profiles
- 16.2.1 THALES
- 16.2.1.1. Overview
- 16.2.1.2. Products
- 16.2.1.3. SWOT Analysis
- 16.2.1.4. Recent Developments
- 16.2.1.5. Financials (Based on Availability)
- 16.2.2 Leonardo SpA
- 16.2.2.1. Overview
- 16.2.2.2. Products
- 16.2.2.3. SWOT Analysis
- 16.2.2.4. Recent Developments
- 16.2.2.5. Financials (Based on Availability)
- 16.2.3 Lockheed Martin Corporation
- 16.2.3.1. Overview
- 16.2.3.2. Products
- 16.2.3.3. SWOT Analysis
- 16.2.3.4. Recent Developments
- 16.2.3.5. Financials (Based on Availability)
- 16.2.4 Airbus SE
- 16.2.4.1. Overview
- 16.2.4.2. Products
- 16.2.4.3. SWOT Analysis
- 16.2.4.4. Recent Developments
- 16.2.4.5. Financials (Based on Availability)
- 16.2.5 QinetiQ Group PL
- 16.2.5.1. Overview
- 16.2.5.2. Products
- 16.2.5.3. SWOT Analysis
- 16.2.5.4. Recent Developments
- 16.2.5.5. Financials (Based on Availability)
- 16.2.6 Teledyne Technologies Incorporated
- 16.2.6.1. Overview
- 16.2.6.2. Products
- 16.2.6.3. SWOT Analysis
- 16.2.6.4. Recent Developments
- 16.2.6.5. Financials (Based on Availability)
- 16.2.7 BAE Systems PLC
- 16.2.7.1. Overview
- 16.2.7.2. Products
- 16.2.7.3. SWOT Analysis
- 16.2.7.4. Recent Developments
- 16.2.7.5. Financials (Based on Availability)
- 16.2.8 RTX Corporation
- 16.2.8.1. Overview
- 16.2.8.2. Products
- 16.2.8.3. SWOT Analysis
- 16.2.8.4. Recent Developments
- 16.2.8.5. Financials (Based on Availability)
- 16.2.9 HENSOLDT Holding Germany GmbH
- 16.2.9.1. Overview
- 16.2.9.2. Products
- 16.2.9.3. SWOT Analysis
- 16.2.9.4. Recent Developments
- 16.2.9.5. Financials (Based on Availability)
- 16.2.10 Israel Aerospace Industries Ltd
- 16.2.10.1. Overview
- 16.2.10.2. Products
- 16.2.10.3. SWOT Analysis
- 16.2.10.4. Recent Developments
- 16.2.10.5. Financials (Based on Availability)
- 16.2.11 Northrop Grumman Corporation
- 16.2.11.1. Overview
- 16.2.11.2. Products
- 16.2.11.3. SWOT Analysis
- 16.2.11.4. Recent Developments
- 16.2.11.5. Financials (Based on Availability)
- 16.2.12 Saab AB
- 16.2.12.1. Overview
- 16.2.12.2. Products
- 16.2.12.3. SWOT Analysis
- 16.2.12.4. Recent Developments
- 16.2.12.5. Financials (Based on Availability)
- 16.2.1 THALES
List of Figures
- Figure 1: Global Military Radars Industry Revenue Breakdown (Million, %) by Region 2024 & 2032
- Figure 2: North America Military Radars Industry Revenue (Million), by Country 2024 & 2032
- Figure 3: North America Military Radars Industry Revenue Share (%), by Country 2024 & 2032
- Figure 4: Europe Military Radars Industry Revenue (Million), by Country 2024 & 2032
- Figure 5: Europe Military Radars Industry Revenue Share (%), by Country 2024 & 2032
- Figure 6: Asia Pacific Military Radars Industry Revenue (Million), by Country 2024 & 2032
- Figure 7: Asia Pacific Military Radars Industry Revenue Share (%), by Country 2024 & 2032
- Figure 8: Latin America Military Radars Industry Revenue (Million), by Country 2024 & 2032
- Figure 9: Latin America Military Radars Industry Revenue Share (%), by Country 2024 & 2032
- Figure 10: Middle East and Africa Military Radars Industry Revenue (Million), by Country 2024 & 2032
- Figure 11: Middle East and Africa Military Radars Industry Revenue Share (%), by Country 2024 & 2032
- Figure 12: North America Military Radars Industry Revenue (Million), by Production Analysis 2024 & 2032
- Figure 13: North America Military Radars Industry Revenue Share (%), by Production Analysis 2024 & 2032
- Figure 14: North America Military Radars Industry Revenue (Million), by Consumption Analysis 2024 & 2032
- Figure 15: North America Military Radars Industry Revenue Share (%), by Consumption Analysis 2024 & 2032
- Figure 16: North America Military Radars Industry Revenue (Million), by Import Market Analysis (Value & Volume) 2024 & 2032
- Figure 17: North America Military Radars Industry Revenue Share (%), by Import Market Analysis (Value & Volume) 2024 & 2032
- Figure 18: North America Military Radars Industry Revenue (Million), by Export Market Analysis (Value & Volume) 2024 & 2032
- Figure 19: North America Military Radars Industry Revenue Share (%), by Export Market Analysis (Value & Volume) 2024 & 2032
- Figure 20: North America Military Radars Industry Revenue (Million), by Price Trend Analysis 2024 & 2032
- Figure 21: North America Military Radars Industry Revenue Share (%), by Price Trend Analysis 2024 & 2032
- Figure 22: North America Military Radars Industry Revenue (Million), by Country 2024 & 2032
- Figure 23: North America Military Radars Industry Revenue Share (%), by Country 2024 & 2032
- Figure 24: South America Military Radars Industry Revenue (Million), by Production Analysis 2024 & 2032
- Figure 25: South America Military Radars Industry Revenue Share (%), by Production Analysis 2024 & 2032
- Figure 26: South America Military Radars Industry Revenue (Million), by Consumption Analysis 2024 & 2032
- Figure 27: South America Military Radars Industry Revenue Share (%), by Consumption Analysis 2024 & 2032
- Figure 28: South America Military Radars Industry Revenue (Million), by Import Market Analysis (Value & Volume) 2024 & 2032
- Figure 29: South America Military Radars Industry Revenue Share (%), by Import Market Analysis (Value & Volume) 2024 & 2032
- Figure 30: South America Military Radars Industry Revenue (Million), by Export Market Analysis (Value & Volume) 2024 & 2032
- Figure 31: South America Military Radars Industry Revenue Share (%), by Export Market Analysis (Value & Volume) 2024 & 2032
- Figure 32: South America Military Radars Industry Revenue (Million), by Price Trend Analysis 2024 & 2032
- Figure 33: South America Military Radars Industry Revenue Share (%), by Price Trend Analysis 2024 & 2032
- Figure 34: South America Military Radars Industry Revenue (Million), by Country 2024 & 2032
- Figure 35: South America Military Radars Industry Revenue Share (%), by Country 2024 & 2032
- Figure 36: Europe Military Radars Industry Revenue (Million), by Production Analysis 2024 & 2032
- Figure 37: Europe Military Radars Industry Revenue Share (%), by Production Analysis 2024 & 2032
- Figure 38: Europe Military Radars Industry Revenue (Million), by Consumption Analysis 2024 & 2032
- Figure 39: Europe Military Radars Industry Revenue Share (%), by Consumption Analysis 2024 & 2032
- Figure 40: Europe Military Radars Industry Revenue (Million), by Import Market Analysis (Value & Volume) 2024 & 2032
- Figure 41: Europe Military Radars Industry Revenue Share (%), by Import Market Analysis (Value & Volume) 2024 & 2032
- Figure 42: Europe Military Radars Industry Revenue (Million), by Export Market Analysis (Value & Volume) 2024 & 2032
- Figure 43: Europe Military Radars Industry Revenue Share (%), by Export Market Analysis (Value & Volume) 2024 & 2032
- Figure 44: Europe Military Radars Industry Revenue (Million), by Price Trend Analysis 2024 & 2032
- Figure 45: Europe Military Radars Industry Revenue Share (%), by Price Trend Analysis 2024 & 2032
- Figure 46: Europe Military Radars Industry Revenue (Million), by Country 2024 & 2032
- Figure 47: Europe Military Radars Industry Revenue Share (%), by Country 2024 & 2032
- Figure 48: Middle East & Africa Military Radars Industry Revenue (Million), by Production Analysis 2024 & 2032
- Figure 49: Middle East & Africa Military Radars Industry Revenue Share (%), by Production Analysis 2024 & 2032
- Figure 50: Middle East & Africa Military Radars Industry Revenue (Million), by Consumption Analysis 2024 & 2032
- Figure 51: Middle East & Africa Military Radars Industry Revenue Share (%), by Consumption Analysis 2024 & 2032
- Figure 52: Middle East & Africa Military Radars Industry Revenue (Million), by Import Market Analysis (Value & Volume) 2024 & 2032
- Figure 53: Middle East & Africa Military Radars Industry Revenue Share (%), by Import Market Analysis (Value & Volume) 2024 & 2032
- Figure 54: Middle East & Africa Military Radars Industry Revenue (Million), by Export Market Analysis (Value & Volume) 2024 & 2032
- Figure 55: Middle East & Africa Military Radars Industry Revenue Share (%), by Export Market Analysis (Value & Volume) 2024 & 2032
- Figure 56: Middle East & Africa Military Radars Industry Revenue (Million), by Price Trend Analysis 2024 & 2032
- Figure 57: Middle East & Africa Military Radars Industry Revenue Share (%), by Price Trend Analysis 2024 & 2032
- Figure 58: Middle East & Africa Military Radars Industry Revenue (Million), by Country 2024 & 2032
- Figure 59: Middle East & Africa Military Radars Industry Revenue Share (%), by Country 2024 & 2032
- Figure 60: Asia Pacific Military Radars Industry Revenue (Million), by Production Analysis 2024 & 2032
- Figure 61: Asia Pacific Military Radars Industry Revenue Share (%), by Production Analysis 2024 & 2032
- Figure 62: Asia Pacific Military Radars Industry Revenue (Million), by Consumption Analysis 2024 & 2032
- Figure 63: Asia Pacific Military Radars Industry Revenue Share (%), by Consumption Analysis 2024 & 2032
- Figure 64: Asia Pacific Military Radars Industry Revenue (Million), by Import Market Analysis (Value & Volume) 2024 & 2032
- Figure 65: Asia Pacific Military Radars Industry Revenue Share (%), by Import Market Analysis (Value & Volume) 2024 & 2032
- Figure 66: Asia Pacific Military Radars Industry Revenue (Million), by Export Market Analysis (Value & Volume) 2024 & 2032
- Figure 67: Asia Pacific Military Radars Industry Revenue Share (%), by Export Market Analysis (Value & Volume) 2024 & 2032
- Figure 68: Asia Pacific Military Radars Industry Revenue (Million), by Price Trend Analysis 2024 & 2032
- Figure 69: Asia Pacific Military Radars Industry Revenue Share (%), by Price Trend Analysis 2024 & 2032
- Figure 70: Asia Pacific Military Radars Industry Revenue (Million), by Country 2024 & 2032
- Figure 71: Asia Pacific Military Radars Industry Revenue Share (%), by Country 2024 & 2032
List of Tables
- Table 1: Global Military Radars Industry Revenue Million Forecast, by Region 2019 & 2032
- Table 2: Global Military Radars Industry Revenue Million Forecast, by Production Analysis 2019 & 2032
- Table 3: Global Military Radars Industry Revenue Million Forecast, by Consumption Analysis 2019 & 2032
- Table 4: Global Military Radars Industry Revenue Million Forecast, by Import Market Analysis (Value & Volume) 2019 & 2032
- Table 5: Global Military Radars Industry Revenue Million Forecast, by Export Market Analysis (Value & Volume) 2019 & 2032
- Table 6: Global Military Radars Industry Revenue Million Forecast, by Price Trend Analysis 2019 & 2032
- Table 7: Global Military Radars Industry Revenue Million Forecast, by Region 2019 & 2032
- Table 8: Global Military Radars Industry Revenue Million Forecast, by Country 2019 & 2032
- Table 9: United States Military Radars Industry Revenue (Million) Forecast, by Application 2019 & 2032
- Table 10: Canada Military Radars Industry Revenue (Million) Forecast, by Application 2019 & 2032
- Table 11: Global Military Radars Industry Revenue Million Forecast, by Country 2019 & 2032
- Table 12: United Kingdom Military Radars Industry Revenue (Million) Forecast, by Application 2019 & 2032
- Table 13: Germany Military Radars Industry Revenue (Million) Forecast, by Application 2019 & 2032
- Table 14: France Military Radars Industry Revenue (Million) Forecast, by Application 2019 & 2032
- Table 15: Russia Military Radars Industry Revenue (Million) Forecast, by Application 2019 & 2032
- Table 16: Rest of Europe Military Radars Industry Revenue (Million) Forecast, by Application 2019 & 2032
- Table 17: Global Military Radars Industry Revenue Million Forecast, by Country 2019 & 2032
- Table 18: China Military Radars Industry Revenue (Million) Forecast, by Application 2019 & 2032
- Table 19: India Military Radars Industry Revenue (Million) Forecast, by Application 2019 & 2032
- Table 20: Japan Military Radars Industry Revenue (Million) Forecast, by Application 2019 & 2032
- Table 21: South Korea Military Radars Industry Revenue (Million) Forecast, by Application 2019 & 2032
- Table 22: Rest of Asia Pacific Military Radars Industry Revenue (Million) Forecast, by Application 2019 & 2032
- Table 23: Global Military Radars Industry Revenue Million Forecast, by Country 2019 & 2032
- Table 24: Brazil Military Radars Industry Revenue (Million) Forecast, by Application 2019 & 2032
- Table 25: Rest of Latin America Military Radars Industry Revenue (Million) Forecast, by Application 2019 & 2032
- Table 26: Global Military Radars Industry Revenue Million Forecast, by Country 2019 & 2032
- Table 27: United Arab Emirates Military Radars Industry Revenue (Million) Forecast, by Application 2019 & 2032
- Table 28: Saudi Arabia Military Radars Industry Revenue (Million) Forecast, by Application 2019 & 2032
- Table 29: Egypt Military Radars Industry Revenue (Million) Forecast, by Application 2019 & 2032
- Table 30: Rest of Middle East and Africa Military Radars Industry Revenue (Million) Forecast, by Application 2019 & 2032
- Table 31: Global Military Radars Industry Revenue Million Forecast, by Production Analysis 2019 & 2032
- Table 32: Global Military Radars Industry Revenue Million Forecast, by Consumption Analysis 2019 & 2032
- Table 33: Global Military Radars Industry Revenue Million Forecast, by Import Market Analysis (Value & Volume) 2019 & 2032
- Table 34: Global Military Radars Industry Revenue Million Forecast, by Export Market Analysis (Value & Volume) 2019 & 2032
- Table 35: Global Military Radars Industry Revenue Million Forecast, by Price Trend Analysis 2019 & 2032
- Table 36: Global Military Radars Industry Revenue Million Forecast, by Country 2019 & 2032
- Table 37: United States Military Radars Industry Revenue (Million) Forecast, by Application 2019 & 2032
- Table 38: Canada Military Radars Industry Revenue (Million) Forecast, by Application 2019 & 2032
- Table 39: Mexico Military Radars Industry Revenue (Million) Forecast, by Application 2019 & 2032
- Table 40: Global Military Radars Industry Revenue Million Forecast, by Production Analysis 2019 & 2032
- Table 41: Global Military Radars Industry Revenue Million Forecast, by Consumption Analysis 2019 & 2032
- Table 42: Global Military Radars Industry Revenue Million Forecast, by Import Market Analysis (Value & Volume) 2019 & 2032
- Table 43: Global Military Radars Industry Revenue Million Forecast, by Export Market Analysis (Value & Volume) 2019 & 2032
- Table 44: Global Military Radars Industry Revenue Million Forecast, by Price Trend Analysis 2019 & 2032
- Table 45: Global Military Radars Industry Revenue Million Forecast, by Country 2019 & 2032
- Table 46: Brazil Military Radars Industry Revenue (Million) Forecast, by Application 2019 & 2032
- Table 47: Argentina Military Radars Industry Revenue (Million) Forecast, by Application 2019 & 2032
- Table 48: Rest of South America Military Radars Industry Revenue (Million) Forecast, by Application 2019 & 2032
- Table 49: Global Military Radars Industry Revenue Million Forecast, by Production Analysis 2019 & 2032
- Table 50: Global Military Radars Industry Revenue Million Forecast, by Consumption Analysis 2019 & 2032
- Table 51: Global Military Radars Industry Revenue Million Forecast, by Import Market Analysis (Value & Volume) 2019 & 2032
- Table 52: Global Military Radars Industry Revenue Million Forecast, by Export Market Analysis (Value & Volume) 2019 & 2032
- Table 53: Global Military Radars Industry Revenue Million Forecast, by Price Trend Analysis 2019 & 2032
- Table 54: Global Military Radars Industry Revenue Million Forecast, by Country 2019 & 2032
- Table 55: United Kingdom Military Radars Industry Revenue (Million) Forecast, by Application 2019 & 2032
- Table 56: Germany Military Radars Industry Revenue (Million) Forecast, by Application 2019 & 2032
- Table 57: France Military Radars Industry Revenue (Million) Forecast, by Application 2019 & 2032
- Table 58: Italy Military Radars Industry Revenue (Million) Forecast, by Application 2019 & 2032
- Table 59: Spain Military Radars Industry Revenue (Million) Forecast, by Application 2019 & 2032
- Table 60: Russia Military Radars Industry Revenue (Million) Forecast, by Application 2019 & 2032
- Table 61: Benelux Military Radars Industry Revenue (Million) Forecast, by Application 2019 & 2032
- Table 62: Nordics Military Radars Industry Revenue (Million) Forecast, by Application 2019 & 2032
- Table 63: Rest of Europe Military Radars Industry Revenue (Million) Forecast, by Application 2019 & 2032
- Table 64: Global Military Radars Industry Revenue Million Forecast, by Production Analysis 2019 & 2032
- Table 65: Global Military Radars Industry Revenue Million Forecast, by Consumption Analysis 2019 & 2032
- Table 66: Global Military Radars Industry Revenue Million Forecast, by Import Market Analysis (Value & Volume) 2019 & 2032
- Table 67: Global Military Radars Industry Revenue Million Forecast, by Export Market Analysis (Value & Volume) 2019 & 2032
- Table 68: Global Military Radars Industry Revenue Million Forecast, by Price Trend Analysis 2019 & 2032
- Table 69: Global Military Radars Industry Revenue Million Forecast, by Country 2019 & 2032
- Table 70: Turkey Military Radars Industry Revenue (Million) Forecast, by Application 2019 & 2032
- Table 71: Israel Military Radars Industry Revenue (Million) Forecast, by Application 2019 & 2032
- Table 72: GCC Military Radars Industry Revenue (Million) Forecast, by Application 2019 & 2032
- Table 73: North Africa Military Radars Industry Revenue (Million) Forecast, by Application 2019 & 2032
- Table 74: South Africa Military Radars Industry Revenue (Million) Forecast, by Application 2019 & 2032
- Table 75: Rest of Middle East & Africa Military Radars Industry Revenue (Million) Forecast, by Application 2019 & 2032
- Table 76: Global Military Radars Industry Revenue Million Forecast, by Production Analysis 2019 & 2032
- Table 77: Global Military Radars Industry Revenue Million Forecast, by Consumption Analysis 2019 & 2032
- Table 78: Global Military Radars Industry Revenue Million Forecast, by Import Market Analysis (Value & Volume) 2019 & 2032
- Table 79: Global Military Radars Industry Revenue Million Forecast, by Export Market Analysis (Value & Volume) 2019 & 2032
- Table 80: Global Military Radars Industry Revenue Million Forecast, by Price Trend Analysis 2019 & 2032
- Table 81: Global Military Radars Industry Revenue Million Forecast, by Country 2019 & 2032
- Table 82: China Military Radars Industry Revenue (Million) Forecast, by Application 2019 & 2032
- Table 83: India Military Radars Industry Revenue (Million) Forecast, by Application 2019 & 2032
- Table 84: Japan Military Radars Industry Revenue (Million) Forecast, by Application 2019 & 2032
- Table 85: South Korea Military Radars Industry Revenue (Million) Forecast, by Application 2019 & 2032
- Table 86: ASEAN Military Radars Industry Revenue (Million) Forecast, by Application 2019 & 2032
- Table 87: Oceania Military Radars Industry Revenue (Million) Forecast, by Application 2019 & 2032
- Table 88: Rest of Asia Pacific Military Radars Industry Revenue (Million) Forecast, by Application 2019 & 2032
Frequently Asked Questions
1. What is the projected Compound Annual Growth Rate (CAGR) of the Military Radars Industry?
The projected CAGR is approximately 5.15%.
2. Which companies are prominent players in the Military Radars Industry?
Key companies in the market include THALES, Leonardo SpA, Lockheed Martin Corporation, Airbus SE, QinetiQ Group PL, Teledyne Technologies Incorporated, BAE Systems PLC, RTX Corporation, HENSOLDT Holding Germany GmbH, Israel Aerospace Industries Ltd, Northrop Grumman Corporation, Saab AB.
3. What are the main segments of the Military Radars Industry?
The market segments include Production Analysis, Consumption Analysis, Import Market Analysis (Value & Volume), Export Market Analysis (Value & Volume), Price Trend Analysis.
4. Can you provide details about the market size?
The market size is estimated to be USD 16.71 Million as of 2022.
5. What are some drivers contributing to market growth?
Increase in Internet of Things (IoT) and Autonomous Systems; Rise in Demand for Military and Defense Satellite Communication Solutions.
6. What are the notable trends driving market growth?
Airborne Segment Expected to Register the Highest CAGR During the Forecast Period.
7. Are there any restraints impacting market growth?
Cybersecurity Threats to Satellite Communication; Interference in Transmission of Data.
8. Can you provide examples of recent developments in the market?
N/A
9. What pricing options are available for accessing the report?
Pricing options include single-user, multi-user, and enterprise licenses priced at USD 4750, USD 5250, and USD 8750 respectively.
10. Is the market size provided in terms of value or volume?
The market size is provided in terms of value, measured in Million.
11. Are there any specific market keywords associated with the report?
Yes, the market keyword associated with the report is "Military Radars Industry," which aids in identifying and referencing the specific market segment covered.
12. How do I determine which pricing option suits my needs best?
The pricing options vary based on user requirements and access needs. Individual users may opt for single-user licenses, while businesses requiring broader access may choose multi-user or enterprise licenses for cost-effective access to the report.
13. Are there any additional resources or data provided in the Military Radars Industry report?
While the report offers comprehensive insights, it's advisable to review the specific contents or supplementary materials provided to ascertain if additional resources or data are available.
14. How can I stay updated on further developments or reports in the Military Radars Industry?
To stay informed about further developments, trends, and reports in the Military Radars Industry, consider subscribing to industry newsletters, following relevant companies and organizations, or regularly checking reputable industry news sources and publications.
Methodology
Step 1 - Identification of Relevant Samples Size from Population Database


Step 2 - Approaches for Defining Global Market Size (Value, Volume* & Price*)

Note*: In applicable scenarios
Step 3 - Data Sources
Primary Research
- Web Analytics
- Survey Reports
- Research Institute
- Latest Research Reports
- Opinion Leaders
Secondary Research
- Annual Reports
- White Paper
- Latest Press Release
- Industry Association
- Paid Database
- Investor Presentations

Step 4 - Data Triangulation
Involves using different sources of information in order to increase the validity of a study
These sources are likely to be stakeholders in a program - participants, other researchers, program staff, other community members, and so on.
Then we put all data in single framework & apply various statistical tools to find out the dynamic on the market.
During the analysis stage, feedback from the stakeholder groups would be compared to determine areas of agreement as well as areas of divergence


