Global Military Robots Industry Trends: Region-Specific Insights 2025-2033

Military Robots Industry by Production Analysis, by Consumption Analysis, by Import Market Analysis (Value & Volume), by Export Market Analysis (Value & Volume), by Price Trend Analysis, by North America (United States, Canada, Mexico), by South America (Brazil, Argentina, Rest of South America), by Europe (United Kingdom, Germany, France, Italy, Spain, Russia, Benelux, Nordics, Rest of Europe), by Middle East & Africa (Turkey, Israel, GCC, North Africa, South Africa, Rest of Middle East & Africa), by Asia Pacific (China, India, Japan, South Korea, ASEAN, Oceania, Rest of Asia Pacific) Forecast 2025-2033

Jun 30 2025
Base Year: 2024

234 Pages
Main Logo

Global Military Robots Industry Trends: Region-Specific Insights 2025-2033


Home
Industries
Aerospace & Defense
sponsor image
sponsor image
sponsor image
sponsor image

Tailored for you

  • In-depth Analysis Tailored to Specified Regions or Segments
  • Company Profiles Customized to User Preferences
  • Comprehensive Insights Focused on Specific Segments or Regions
  • Customized Evaluation of Competitive Landscape to Meet Your Needs
  • Tailored Customization to Address Other Specific Requirements
Ask for customization


Key Insights

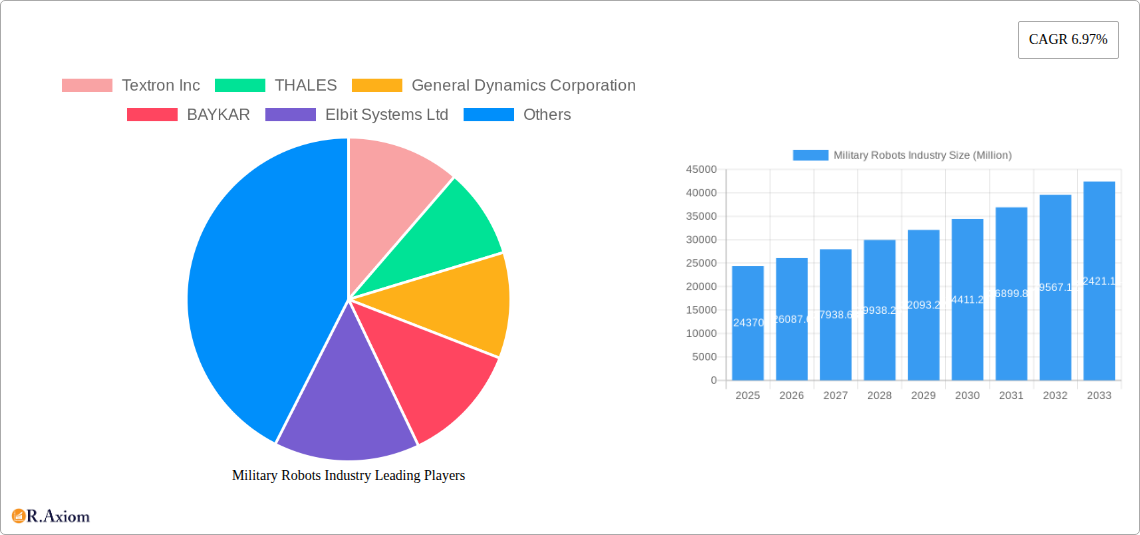
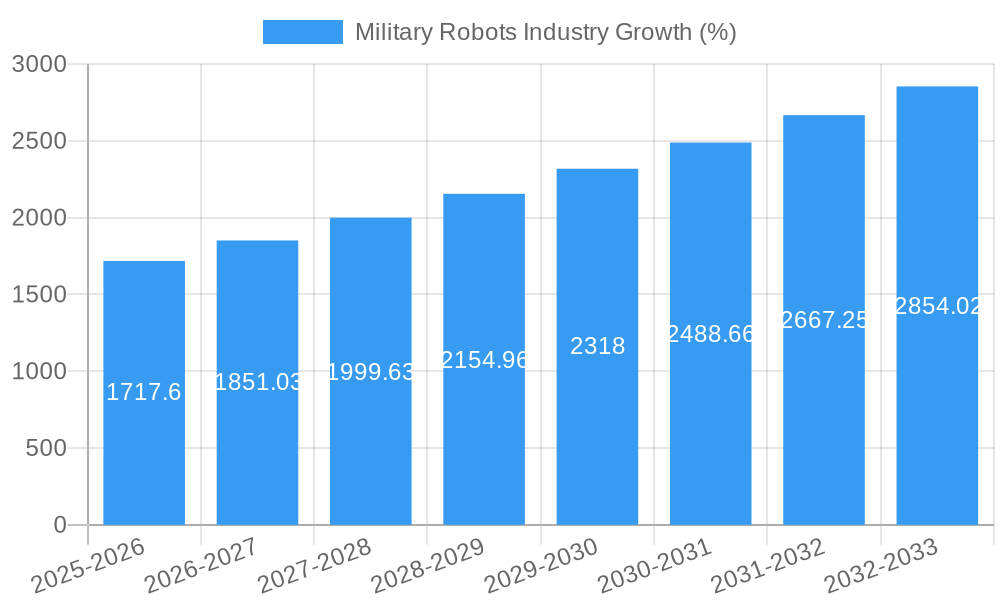
The Military Robots market, valued at $24.37 billion in 2025, is poised for robust growth, exhibiting a Compound Annual Growth Rate (CAGR) of 6.97% from 2025 to 2033. This expansion is driven by several key factors. Increasing demand for unmanned systems to minimize human casualties in combat situations is a primary driver. Technological advancements, particularly in artificial intelligence (AI), robotics, and sensor technologies, are enabling the development of more sophisticated and autonomous military robots capable of performing complex tasks with greater precision and efficiency. Furthermore, the rising adoption of autonomous systems for surveillance, reconnaissance, and bomb disposal is fueling market growth. The market is segmented by platform (land, marine, airborne) and mode of operation (human-operated, autonomous), with autonomous systems experiencing particularly rapid growth due to their strategic advantages in hazardous environments. Geopolitical instability and the ongoing need for enhanced defense capabilities across the globe are also significant contributors to the market's expansion. Competition among leading companies like Textron, Thales, General Dynamics, and others is fostering innovation and driving down costs, making these technologies accessible to a wider range of military organizations.

However, the market faces certain challenges. High initial investment costs associated with research, development, and deployment of military robots can hinder adoption, especially for smaller nations with limited defense budgets. Ethical concerns regarding the use of autonomous weapons systems and potential risks associated with AI-driven decision-making also present significant restraints. Regulatory hurdles and cybersecurity risks related to the increasing connectivity and reliance on sophisticated software also play a role. Nevertheless, the long-term outlook for the Military Robots market remains positive, fueled by continuous technological improvements, increasing defense spending, and the growing demand for enhanced battlefield effectiveness and reduced human risk. The shift toward autonomous systems and the integration of AI are expected to shape the future of military operations and propel further market growth.

Military Robots Industry Research Report - Market Size, Growth & Forecast

Military Robots Industry: A Comprehensive Market Analysis (2019-2033)

This in-depth report provides a comprehensive analysis of the Military Robots industry, covering market size, segmentation, growth drivers, challenges, and key players. The study period spans from 2019 to 2033, with 2025 serving as the base and estimated year. The report leverages extensive data analysis and industry insights to offer actionable intelligence for stakeholders across the military robotics ecosystem. The global market value is projected to reach xx Million by 2033, exhibiting a CAGR of xx% during the forecast period (2025-2033).

Military Robots Industry Market Concentration & Innovation

The Military Robots industry is characterized by a moderately concentrated market structure, with a few dominant players holding significant market share. Companies like Textron Inc, THALES, General Dynamics Corporation, and Lockheed Martin Corporation hold leading positions, driven by their extensive R&D capabilities, technological advancements, and strong government relationships. Market share analysis reveals that the top 5 players collectively account for approximately xx% of the global market in 2025. Innovation is a key driver, fueled by continuous advancements in AI, robotics, and sensor technologies. Regulatory frameworks, including export controls and ethical considerations surrounding autonomous weapons systems, significantly influence market dynamics. Product substitution is limited due to the specialized nature of military robots, although advancements in drone technology and other unmanned systems could present some level of competition. End-user trends indicate increasing demand for autonomous systems and enhanced battlefield situational awareness capabilities. Mergers and acquisitions (M&A) activity has been notable, with several significant deals exceeding USD xx Million in value during the historical period (2019-2024), primarily focused on consolidating technological expertise and expanding market reach.

  • Market Share (2025): Top 5 players: xx%
  • M&A Deal Value (2019-2024): Total value exceeding USD xx Million

Military Robots Industry Industry Trends & Insights

The Military Robots market exhibits robust growth, driven by escalating defense budgets globally, increasing demand for unmanned systems, and technological advancements leading to more sophisticated and effective robotic platforms. The CAGR for the period 2025-2033 is projected at xx%, significantly influenced by the adoption of autonomous systems across land, marine, and airborne domains. Technological disruptions, specifically in AI and machine learning, are revolutionizing robotic capabilities, enhancing their autonomy, situational awareness, and operational effectiveness. Consumer preferences (in this case, military end-users) increasingly favor systems with higher levels of autonomy and improved human-robot interaction capabilities. Competitive dynamics are characterized by intense R&D competition, strategic partnerships, and a push for technological differentiation. Market penetration is highest in developed nations, driven by higher defense spending and technological readiness. However, emerging economies are witnessing growing adoption, particularly for cost-effective surveillance and reconnaissance systems.

Military Robots Industry Growth

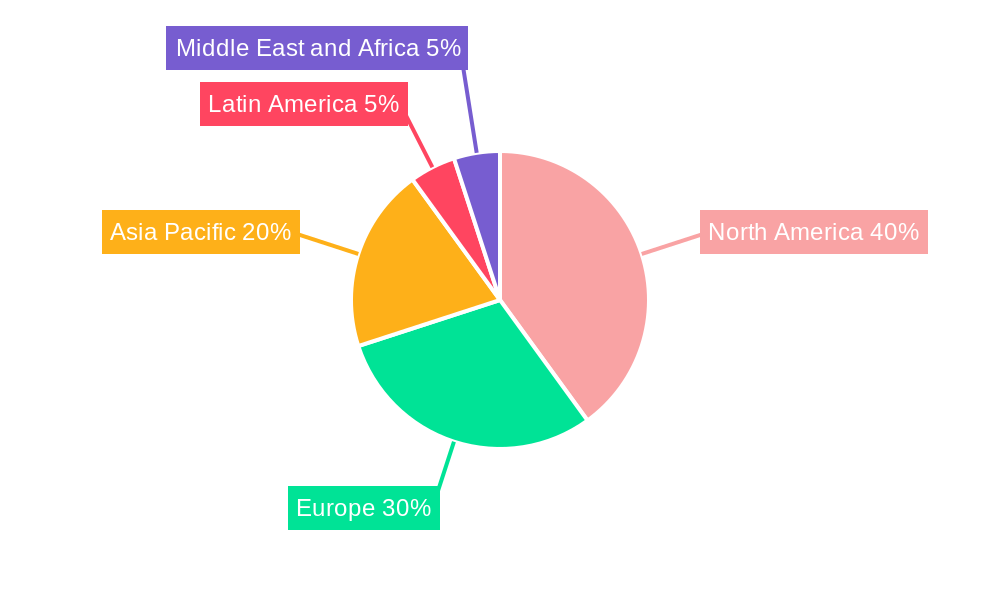
Dominant Markets & Segments in Military Robots Industry

The North American region currently holds the largest market share, driven by significant defense spending and a strong technological base. The United States, in particular, represents a dominant market due to its substantial investments in military modernization and adoption of advanced robotic systems. Within the segments, the demand for Land-based platforms is currently the highest, followed by Airborne, with Marine platforms holding a smaller yet significant share. The Autonomous mode of operation is gaining traction, albeit more gradually, as technological advancements address concerns about reliability, safety, and ethical considerations.

Key Drivers for North American Dominance:

  • High Defense Budgets
  • Advanced Technological Capabilities
  • Strong Government Support for R&D
  • Established Supply Chains

Segment Dominance Analysis:

  • Land: High demand due to diverse applications in ground warfare, reconnaissance, and logistics.
  • Airborne: Rapid advancements in drone technology and increasing deployment for surveillance and strike missions.
  • Marine: Growing applications in underwater reconnaissance, mine countermeasures, and anti-submarine warfare.
  • Autonomous: Technological advancements in AI and machine learning are driving increased adoption, although human-operated systems still dominate.

Military Robots Industry Product Developments

Recent product innovations focus on enhancing autonomy, increasing payload capacity, improving sensor integration, and enhancing resilience to battlefield conditions. New applications are emerging in areas such as explosive ordnance disposal, urban warfare, and logistical support. Key competitive advantages include superior sensor technology, advanced AI algorithms, enhanced operational range, and robust design. Technological trends emphasize AI-powered decision-making, swarm robotics, and increased human-robot collaboration.

Report Scope & Segmentation Analysis

This report segments the Military Robots market by platform (Land, Marine, Airborne) and mode of operation (Human Operated, Autonomous). Each segment's growth trajectory, market size, and competitive landscape are analyzed, providing granular insights into market dynamics.

Platform:

  • Land: Expected to reach xx Million by 2033, driven by the increasing adoption of UGVs for various military operations.
  • Marine: Projected to grow to xx Million by 2033, fueled by rising demand for autonomous underwater vehicles (AUVs).
  • Airborne: Estimated to reach xx Million by 2033, primarily due to the widespread adoption of UAVs for reconnaissance and surveillance.

Mode of Operation:

  • Human Operated: Will remain the largest segment throughout the forecast period due to concerns regarding autonomous systems.
  • Autonomous: Growth is expected to be significant due to advancements in AI, although challenges concerning reliability and ethical considerations remain.

Key Drivers of Military Robots Industry Growth

Technological advancements in AI, robotics, and sensor technologies are major drivers, enabling the development of more sophisticated and capable military robots. Increased defense spending globally is fueling demand, particularly in regions facing geopolitical instability. Favorable government policies promoting military modernization and technological innovation further accelerate growth. For example, the US Army's initiative to integrate robots into its formations signifies a significant driver of market expansion.

Challenges in the Military Robots Industry Sector

High development and manufacturing costs, particularly for advanced autonomous systems, pose a significant challenge. Supply chain disruptions and the availability of specialized components can impact production and delivery timelines. Regulatory hurdles related to the ethical use of autonomous weapons systems and international export controls create market uncertainty. Intense competition among major players puts pressure on pricing and profit margins. Cybersecurity threats and vulnerabilities of robotic systems are a growing concern, with potential impacts on operational effectiveness.

Emerging Opportunities in Military Robots Industry

The development of swarm robotics technology presents substantial opportunities for enhancing coordination and operational flexibility in battlefield scenarios. The integration of AI and machine learning algorithms will further enhance autonomy, decision-making, and adaptability of military robots. Emerging markets in developing countries present significant expansion opportunities as they seek to modernize their military capabilities. Growing demand for robotic systems capable of handling hazardous materials and operating in challenging terrains creates new market niches.

Leading Players in the Military Robots Industry Market

  • Textron Inc
  • THALES
  • General Dynamics Corporation
  • BAYKAR
  • Elbit Systems Ltd
  • Lockheed Martin Corporation
  • QinetiQ Group PLC
  • Cobham Ltd
  • AeroVironment Inc
  • IAI
  • Aeronautics Ltd
  • BAE Systems plc
  • Northrop Grumman Corporation
  • Saab AB
  • Teledyne FLIR LLC

Key Developments in Military Robots Industry Industry

  • October 2023: The US Army initiates a program to develop integrated formations of robots and human operators, signaling a significant shift toward collaborative robotic warfare.
  • July 2022: Teledyne FLIR Defense secures a USD 62.1 Million contract for 500 Centaur multi-mission robots, showcasing strong demand for versatile robotic platforms.
  • January 2022: China unveils a large electrically powered quadruped robot for military logistics and reconnaissance, highlighting the growing interest in robotic solutions for diverse operational tasks.

Strategic Outlook for Military Robots Industry Market

The Military Robots industry is poised for continued growth, driven by technological advancements, increasing defense spending, and the rising need for effective unmanned systems. The market's future potential is substantial, particularly in the autonomous segment and in emerging markets. Companies that effectively leverage AI, enhance human-robot collaboration, and address ethical considerations will be best positioned to capitalize on the numerous opportunities within this dynamic sector.

Military Robots Industry Segmentation

  • 1. Production Analysis
  • 2. Consumption Analysis
  • 3. Import Market Analysis (Value & Volume)
  • 4. Export Market Analysis (Value & Volume)
  • 5. Price Trend Analysis

Military Robots Industry Segmentation By Geography

  • 1. North America
    • 1.1. United States
    • 1.2. Canada
    • 1.3. Mexico
  • 2. South America
    • 2.1. Brazil
    • 2.2. Argentina
    • 2.3. Rest of South America
  • 3. Europe
    • 3.1. United Kingdom
    • 3.2. Germany
    • 3.3. France
    • 3.4. Italy
    • 3.5. Spain
    • 3.6. Russia
    • 3.7. Benelux
    • 3.8. Nordics
    • 3.9. Rest of Europe
  • 4. Middle East & Africa
    • 4.1. Turkey
    • 4.2. Israel
    • 4.3. GCC
    • 4.4. North Africa
    • 4.5. South Africa
    • 4.6. Rest of Middle East & Africa
  • 5. Asia Pacific
    • 5.1. China
    • 5.2. India
    • 5.3. Japan
    • 5.4. South Korea
    • 5.5. ASEAN
    • 5.6. Oceania
    • 5.7. Rest of Asia Pacific
Military Robots Industry Regional Share


Military Robots Industry REPORT HIGHLIGHTS

AspectsDetails
Study Period 2019-2033
Base Year 2024
Estimated Year 2025
Forecast Period2025-2033
Historical Period2019-2024
Growth RateCAGR of 6.97% from 2019-2033
Segmentation
    • By Production Analysis
    • By Consumption Analysis
    • By Import Market Analysis (Value & Volume)
    • By Export Market Analysis (Value & Volume)
    • By Price Trend Analysis
  • By Geography
    • North America
      • United States
      • Canada
      • Mexico
    • South America
      • Brazil
      • Argentina
      • Rest of South America
    • Europe
      • United Kingdom
      • Germany
      • France
      • Italy
      • Spain
      • Russia
      • Benelux
      • Nordics
      • Rest of Europe
    • Middle East & Africa
      • Turkey
      • Israel
      • GCC
      • North Africa
      • South Africa
      • Rest of Middle East & Africa
    • Asia Pacific
      • China
      • India
      • Japan
      • South Korea
      • ASEAN
      • Oceania
      • Rest of Asia Pacific


Table of Contents

  1. 1. Introduction
    • 1.1. Research Scope
    • 1.2. Market Segmentation
    • 1.3. Research Methodology
    • 1.4. Definitions and Assumptions
  2. 2. Executive Summary
    • 2.1. Introduction
  3. 3. Market Dynamics
    • 3.1. Introduction
      • 3.2. Market Drivers
        • 3.2.1. ; Increasing Number Of Air Passengers; Use Of Portable Electronic Devices
      • 3.3. Market Restrains
        • 3.3.1. ; High Cost Of Connectivity Equipments
      • 3.4. Market Trends
        • 3.4.1. Land Segment Anticipated to Generate Highest Growth During the Forecast Period
  4. 4. Market Factor Analysis
    • 4.1. Porters Five Forces
    • 4.2. Supply/Value Chain
    • 4.3. PESTEL analysis
    • 4.4. Market Entropy
    • 4.5. Patent/Trademark Analysis
  5. 5. Global Military Robots Industry Analysis, Insights and Forecast, 2019-2031
    • 5.1. Market Analysis, Insights and Forecast - by Production Analysis
      • 5.2. Market Analysis, Insights and Forecast - by Consumption Analysis
        • 5.3. Market Analysis, Insights and Forecast - by Import Market Analysis (Value & Volume)
          • 5.4. Market Analysis, Insights and Forecast - by Export Market Analysis (Value & Volume)
            • 5.5. Market Analysis, Insights and Forecast - by Price Trend Analysis
              • 5.6. Market Analysis, Insights and Forecast - by Region
                • 5.6.1. North America
                • 5.6.2. South America
                • 5.6.3. Europe
                • 5.6.4. Middle East & Africa
                • 5.6.5. Asia Pacific
            • 6. North America Military Robots Industry Analysis, Insights and Forecast, 2019-2031
              • 6.1. Market Analysis, Insights and Forecast - by Production Analysis
                • 6.2. Market Analysis, Insights and Forecast - by Consumption Analysis
                  • 6.3. Market Analysis, Insights and Forecast - by Import Market Analysis (Value & Volume)
                    • 6.4. Market Analysis, Insights and Forecast - by Export Market Analysis (Value & Volume)
                      • 6.5. Market Analysis, Insights and Forecast - by Price Trend Analysis
                      • 7. South America Military Robots Industry Analysis, Insights and Forecast, 2019-2031
                        • 7.1. Market Analysis, Insights and Forecast - by Production Analysis
                          • 7.2. Market Analysis, Insights and Forecast - by Consumption Analysis
                            • 7.3. Market Analysis, Insights and Forecast - by Import Market Analysis (Value & Volume)
                              • 7.4. Market Analysis, Insights and Forecast - by Export Market Analysis (Value & Volume)
                                • 7.5. Market Analysis, Insights and Forecast - by Price Trend Analysis
                                • 8. Europe Military Robots Industry Analysis, Insights and Forecast, 2019-2031
                                  • 8.1. Market Analysis, Insights and Forecast - by Production Analysis
                                    • 8.2. Market Analysis, Insights and Forecast - by Consumption Analysis
                                      • 8.3. Market Analysis, Insights and Forecast - by Import Market Analysis (Value & Volume)
                                        • 8.4. Market Analysis, Insights and Forecast - by Export Market Analysis (Value & Volume)
                                          • 8.5. Market Analysis, Insights and Forecast - by Price Trend Analysis
                                          • 9. Middle East & Africa Military Robots Industry Analysis, Insights and Forecast, 2019-2031
                                            • 9.1. Market Analysis, Insights and Forecast - by Production Analysis
                                              • 9.2. Market Analysis, Insights and Forecast - by Consumption Analysis
                                                • 9.3. Market Analysis, Insights and Forecast - by Import Market Analysis (Value & Volume)
                                                  • 9.4. Market Analysis, Insights and Forecast - by Export Market Analysis (Value & Volume)
                                                    • 9.5. Market Analysis, Insights and Forecast - by Price Trend Analysis
                                                    • 10. Asia Pacific Military Robots Industry Analysis, Insights and Forecast, 2019-2031
                                                      • 10.1. Market Analysis, Insights and Forecast - by Production Analysis
                                                        • 10.2. Market Analysis, Insights and Forecast - by Consumption Analysis
                                                          • 10.3. Market Analysis, Insights and Forecast - by Import Market Analysis (Value & Volume)
                                                            • 10.4. Market Analysis, Insights and Forecast - by Export Market Analysis (Value & Volume)
                                                              • 10.5. Market Analysis, Insights and Forecast - by Price Trend Analysis
                                                              • 11. North America Military Robots Industry Analysis, Insights and Forecast, 2019-2031
                                                                  • 11.1. Market Analysis, Insights and Forecast - By Country/Sub-region
                                                                    • 11.1.1 United States
                                                                    • 11.1.2 Canada
                                                              • 12. Europe Military Robots Industry Analysis, Insights and Forecast, 2019-2031
                                                                  • 12.1. Market Analysis, Insights and Forecast - By Country/Sub-region
                                                                    • 12.1.1 United Kingdom
                                                                    • 12.1.2 France
                                                                    • 12.1.3 Germany
                                                                    • 12.1.4 Russia
                                                                    • 12.1.5 Rest of Europe
                                                              • 13. Asia Pacific Military Robots Industry Analysis, Insights and Forecast, 2019-2031
                                                                  • 13.1. Market Analysis, Insights and Forecast - By Country/Sub-region
                                                                    • 13.1.1 China
                                                                    • 13.1.2 India
                                                                    • 13.1.3 Japan
                                                                    • 13.1.4 South Korea
                                                                    • 13.1.5 Rest of Asia Pacific
                                                              • 14. Latin America Military Robots Industry Analysis, Insights and Forecast, 2019-2031
                                                                  • 14.1. Market Analysis, Insights and Forecast - By Country/Sub-region
                                                                    • 14.1.1 Brazil
                                                                    • 14.1.2 Rest of Latin America
                                                              • 15. Middle East and Africa Military Robots Industry Analysis, Insights and Forecast, 2019-2031
                                                                  • 15.1. Market Analysis, Insights and Forecast - By Country/Sub-region
                                                                    • 15.1.1 Saudi Arabia
                                                                    • 15.1.2 United Arab Emirates
                                                                    • 15.1.3 Israel
                                                                    • 15.1.4 Turkey
                                                                    • 15.1.5 Rest of Middle East and Africa
                                                              • 16. Competitive Analysis
                                                                • 16.1. Global Market Share Analysis 2024
                                                                  • 16.2. Company Profiles
                                                                    • 16.2.1 Textron Inc
                                                                      • 16.2.1.1. Overview
                                                                      • 16.2.1.2. Products
                                                                      • 16.2.1.3. SWOT Analysis
                                                                      • 16.2.1.4. Recent Developments
                                                                      • 16.2.1.5. Financials (Based on Availability)
                                                                    • 16.2.2 THALES
                                                                      • 16.2.2.1. Overview
                                                                      • 16.2.2.2. Products
                                                                      • 16.2.2.3. SWOT Analysis
                                                                      • 16.2.2.4. Recent Developments
                                                                      • 16.2.2.5. Financials (Based on Availability)
                                                                    • 16.2.3 General Dynamics Corporation
                                                                      • 16.2.3.1. Overview
                                                                      • 16.2.3.2. Products
                                                                      • 16.2.3.3. SWOT Analysis
                                                                      • 16.2.3.4. Recent Developments
                                                                      • 16.2.3.5. Financials (Based on Availability)
                                                                    • 16.2.4 BAYKAR
                                                                      • 16.2.4.1. Overview
                                                                      • 16.2.4.2. Products
                                                                      • 16.2.4.3. SWOT Analysis
                                                                      • 16.2.4.4. Recent Developments
                                                                      • 16.2.4.5. Financials (Based on Availability)
                                                                    • 16.2.5 Elbit Systems Ltd
                                                                      • 16.2.5.1. Overview
                                                                      • 16.2.5.2. Products
                                                                      • 16.2.5.3. SWOT Analysis
                                                                      • 16.2.5.4. Recent Developments
                                                                      • 16.2.5.5. Financials (Based on Availability)
                                                                    • 16.2.6 Lockheed Martin Corporation
                                                                      • 16.2.6.1. Overview
                                                                      • 16.2.6.2. Products
                                                                      • 16.2.6.3. SWOT Analysis
                                                                      • 16.2.6.4. Recent Developments
                                                                      • 16.2.6.5. Financials (Based on Availability)
                                                                    • 16.2.7 QinetiQ Group PLC
                                                                      • 16.2.7.1. Overview
                                                                      • 16.2.7.2. Products
                                                                      • 16.2.7.3. SWOT Analysis
                                                                      • 16.2.7.4. Recent Developments
                                                                      • 16.2.7.5. Financials (Based on Availability)
                                                                    • 16.2.8 Cobham Ltd
                                                                      • 16.2.8.1. Overview
                                                                      • 16.2.8.2. Products
                                                                      • 16.2.8.3. SWOT Analysis
                                                                      • 16.2.8.4. Recent Developments
                                                                      • 16.2.8.5. Financials (Based on Availability)
                                                                    • 16.2.9 AeroVironment Inc
                                                                      • 16.2.9.1. Overview
                                                                      • 16.2.9.2. Products
                                                                      • 16.2.9.3. SWOT Analysis
                                                                      • 16.2.9.4. Recent Developments
                                                                      • 16.2.9.5. Financials (Based on Availability)
                                                                    • 16.2.10 IAI
                                                                      • 16.2.10.1. Overview
                                                                      • 16.2.10.2. Products
                                                                      • 16.2.10.3. SWOT Analysis
                                                                      • 16.2.10.4. Recent Developments
                                                                      • 16.2.10.5. Financials (Based on Availability)
                                                                    • 16.2.11 Aeronautics Ltd
                                                                      • 16.2.11.1. Overview
                                                                      • 16.2.11.2. Products
                                                                      • 16.2.11.3. SWOT Analysis
                                                                      • 16.2.11.4. Recent Developments
                                                                      • 16.2.11.5. Financials (Based on Availability)
                                                                    • 16.2.12 BAE Systems plc
                                                                      • 16.2.12.1. Overview
                                                                      • 16.2.12.2. Products
                                                                      • 16.2.12.3. SWOT Analysis
                                                                      • 16.2.12.4. Recent Developments
                                                                      • 16.2.12.5. Financials (Based on Availability)
                                                                    • 16.2.13 Northrop Grumman Corporation
                                                                      • 16.2.13.1. Overview
                                                                      • 16.2.13.2. Products
                                                                      • 16.2.13.3. SWOT Analysis
                                                                      • 16.2.13.4. Recent Developments
                                                                      • 16.2.13.5. Financials (Based on Availability)
                                                                    • 16.2.14 Saab AB
                                                                      • 16.2.14.1. Overview
                                                                      • 16.2.14.2. Products
                                                                      • 16.2.14.3. SWOT Analysis
                                                                      • 16.2.14.4. Recent Developments
                                                                      • 16.2.14.5. Financials (Based on Availability)
                                                                    • 16.2.15 Teledyne FLIR LLC
                                                                      • 16.2.15.1. Overview
                                                                      • 16.2.15.2. Products
                                                                      • 16.2.15.3. SWOT Analysis
                                                                      • 16.2.15.4. Recent Developments
                                                                      • 16.2.15.5. Financials (Based on Availability)

                                                              List of Figures

                                                              1. Figure 1: Global Military Robots Industry Revenue Breakdown (Million, %) by Region 2024 & 2032
                                                              2. Figure 2: North America Military Robots Industry Revenue (Million), by Country 2024 & 2032
                                                              3. Figure 3: North America Military Robots Industry Revenue Share (%), by Country 2024 & 2032
                                                              4. Figure 4: Europe Military Robots Industry Revenue (Million), by Country 2024 & 2032
                                                              5. Figure 5: Europe Military Robots Industry Revenue Share (%), by Country 2024 & 2032
                                                              6. Figure 6: Asia Pacific Military Robots Industry Revenue (Million), by Country 2024 & 2032
                                                              7. Figure 7: Asia Pacific Military Robots Industry Revenue Share (%), by Country 2024 & 2032
                                                              8. Figure 8: Latin America Military Robots Industry Revenue (Million), by Country 2024 & 2032
                                                              9. Figure 9: Latin America Military Robots Industry Revenue Share (%), by Country 2024 & 2032
                                                              10. Figure 10: Middle East and Africa Military Robots Industry Revenue (Million), by Country 2024 & 2032
                                                              11. Figure 11: Middle East and Africa Military Robots Industry Revenue Share (%), by Country 2024 & 2032
                                                              12. Figure 12: North America Military Robots Industry Revenue (Million), by Production Analysis 2024 & 2032
                                                              13. Figure 13: North America Military Robots Industry Revenue Share (%), by Production Analysis 2024 & 2032
                                                              14. Figure 14: North America Military Robots Industry Revenue (Million), by Consumption Analysis 2024 & 2032
                                                              15. Figure 15: North America Military Robots Industry Revenue Share (%), by Consumption Analysis 2024 & 2032
                                                              16. Figure 16: North America Military Robots Industry Revenue (Million), by Import Market Analysis (Value & Volume) 2024 & 2032
                                                              17. Figure 17: North America Military Robots Industry Revenue Share (%), by Import Market Analysis (Value & Volume) 2024 & 2032
                                                              18. Figure 18: North America Military Robots Industry Revenue (Million), by Export Market Analysis (Value & Volume) 2024 & 2032
                                                              19. Figure 19: North America Military Robots Industry Revenue Share (%), by Export Market Analysis (Value & Volume) 2024 & 2032
                                                              20. Figure 20: North America Military Robots Industry Revenue (Million), by Price Trend Analysis 2024 & 2032
                                                              21. Figure 21: North America Military Robots Industry Revenue Share (%), by Price Trend Analysis 2024 & 2032
                                                              22. Figure 22: North America Military Robots Industry Revenue (Million), by Country 2024 & 2032
                                                              23. Figure 23: North America Military Robots Industry Revenue Share (%), by Country 2024 & 2032
                                                              24. Figure 24: South America Military Robots Industry Revenue (Million), by Production Analysis 2024 & 2032
                                                              25. Figure 25: South America Military Robots Industry Revenue Share (%), by Production Analysis 2024 & 2032
                                                              26. Figure 26: South America Military Robots Industry Revenue (Million), by Consumption Analysis 2024 & 2032
                                                              27. Figure 27: South America Military Robots Industry Revenue Share (%), by Consumption Analysis 2024 & 2032
                                                              28. Figure 28: South America Military Robots Industry Revenue (Million), by Import Market Analysis (Value & Volume) 2024 & 2032
                                                              29. Figure 29: South America Military Robots Industry Revenue Share (%), by Import Market Analysis (Value & Volume) 2024 & 2032
                                                              30. Figure 30: South America Military Robots Industry Revenue (Million), by Export Market Analysis (Value & Volume) 2024 & 2032
                                                              31. Figure 31: South America Military Robots Industry Revenue Share (%), by Export Market Analysis (Value & Volume) 2024 & 2032
                                                              32. Figure 32: South America Military Robots Industry Revenue (Million), by Price Trend Analysis 2024 & 2032
                                                              33. Figure 33: South America Military Robots Industry Revenue Share (%), by Price Trend Analysis 2024 & 2032
                                                              34. Figure 34: South America Military Robots Industry Revenue (Million), by Country 2024 & 2032
                                                              35. Figure 35: South America Military Robots Industry Revenue Share (%), by Country 2024 & 2032
                                                              36. Figure 36: Europe Military Robots Industry Revenue (Million), by Production Analysis 2024 & 2032
                                                              37. Figure 37: Europe Military Robots Industry Revenue Share (%), by Production Analysis 2024 & 2032
                                                              38. Figure 38: Europe Military Robots Industry Revenue (Million), by Consumption Analysis 2024 & 2032
                                                              39. Figure 39: Europe Military Robots Industry Revenue Share (%), by Consumption Analysis 2024 & 2032
                                                              40. Figure 40: Europe Military Robots Industry Revenue (Million), by Import Market Analysis (Value & Volume) 2024 & 2032
                                                              41. Figure 41: Europe Military Robots Industry Revenue Share (%), by Import Market Analysis (Value & Volume) 2024 & 2032
                                                              42. Figure 42: Europe Military Robots Industry Revenue (Million), by Export Market Analysis (Value & Volume) 2024 & 2032
                                                              43. Figure 43: Europe Military Robots Industry Revenue Share (%), by Export Market Analysis (Value & Volume) 2024 & 2032
                                                              44. Figure 44: Europe Military Robots Industry Revenue (Million), by Price Trend Analysis 2024 & 2032
                                                              45. Figure 45: Europe Military Robots Industry Revenue Share (%), by Price Trend Analysis 2024 & 2032
                                                              46. Figure 46: Europe Military Robots Industry Revenue (Million), by Country 2024 & 2032
                                                              47. Figure 47: Europe Military Robots Industry Revenue Share (%), by Country 2024 & 2032
                                                              48. Figure 48: Middle East & Africa Military Robots Industry Revenue (Million), by Production Analysis 2024 & 2032
                                                              49. Figure 49: Middle East & Africa Military Robots Industry Revenue Share (%), by Production Analysis 2024 & 2032
                                                              50. Figure 50: Middle East & Africa Military Robots Industry Revenue (Million), by Consumption Analysis 2024 & 2032
                                                              51. Figure 51: Middle East & Africa Military Robots Industry Revenue Share (%), by Consumption Analysis 2024 & 2032
                                                              52. Figure 52: Middle East & Africa Military Robots Industry Revenue (Million), by Import Market Analysis (Value & Volume) 2024 & 2032
                                                              53. Figure 53: Middle East & Africa Military Robots Industry Revenue Share (%), by Import Market Analysis (Value & Volume) 2024 & 2032
                                                              54. Figure 54: Middle East & Africa Military Robots Industry Revenue (Million), by Export Market Analysis (Value & Volume) 2024 & 2032
                                                              55. Figure 55: Middle East & Africa Military Robots Industry Revenue Share (%), by Export Market Analysis (Value & Volume) 2024 & 2032
                                                              56. Figure 56: Middle East & Africa Military Robots Industry Revenue (Million), by Price Trend Analysis 2024 & 2032
                                                              57. Figure 57: Middle East & Africa Military Robots Industry Revenue Share (%), by Price Trend Analysis 2024 & 2032
                                                              58. Figure 58: Middle East & Africa Military Robots Industry Revenue (Million), by Country 2024 & 2032
                                                              59. Figure 59: Middle East & Africa Military Robots Industry Revenue Share (%), by Country 2024 & 2032
                                                              60. Figure 60: Asia Pacific Military Robots Industry Revenue (Million), by Production Analysis 2024 & 2032
                                                              61. Figure 61: Asia Pacific Military Robots Industry Revenue Share (%), by Production Analysis 2024 & 2032
                                                              62. Figure 62: Asia Pacific Military Robots Industry Revenue (Million), by Consumption Analysis 2024 & 2032
                                                              63. Figure 63: Asia Pacific Military Robots Industry Revenue Share (%), by Consumption Analysis 2024 & 2032
                                                              64. Figure 64: Asia Pacific Military Robots Industry Revenue (Million), by Import Market Analysis (Value & Volume) 2024 & 2032
                                                              65. Figure 65: Asia Pacific Military Robots Industry Revenue Share (%), by Import Market Analysis (Value & Volume) 2024 & 2032
                                                              66. Figure 66: Asia Pacific Military Robots Industry Revenue (Million), by Export Market Analysis (Value & Volume) 2024 & 2032
                                                              67. Figure 67: Asia Pacific Military Robots Industry Revenue Share (%), by Export Market Analysis (Value & Volume) 2024 & 2032
                                                              68. Figure 68: Asia Pacific Military Robots Industry Revenue (Million), by Price Trend Analysis 2024 & 2032
                                                              69. Figure 69: Asia Pacific Military Robots Industry Revenue Share (%), by Price Trend Analysis 2024 & 2032
                                                              70. Figure 70: Asia Pacific Military Robots Industry Revenue (Million), by Country 2024 & 2032
                                                              71. Figure 71: Asia Pacific Military Robots Industry Revenue Share (%), by Country 2024 & 2032

                                                              List of Tables

                                                              1. Table 1: Global Military Robots Industry Revenue Million Forecast, by Region 2019 & 2032
                                                              2. Table 2: Global Military Robots Industry Revenue Million Forecast, by Production Analysis 2019 & 2032
                                                              3. Table 3: Global Military Robots Industry Revenue Million Forecast, by Consumption Analysis 2019 & 2032
                                                              4. Table 4: Global Military Robots Industry Revenue Million Forecast, by Import Market Analysis (Value & Volume) 2019 & 2032
                                                              5. Table 5: Global Military Robots Industry Revenue Million Forecast, by Export Market Analysis (Value & Volume) 2019 & 2032
                                                              6. Table 6: Global Military Robots Industry Revenue Million Forecast, by Price Trend Analysis 2019 & 2032
                                                              7. Table 7: Global Military Robots Industry Revenue Million Forecast, by Region 2019 & 2032
                                                              8. Table 8: Global Military Robots Industry Revenue Million Forecast, by Country 2019 & 2032
                                                              9. Table 9: United States Military Robots Industry Revenue (Million) Forecast, by Application 2019 & 2032
                                                              10. Table 10: Canada Military Robots Industry Revenue (Million) Forecast, by Application 2019 & 2032
                                                              11. Table 11: Global Military Robots Industry Revenue Million Forecast, by Country 2019 & 2032
                                                              12. Table 12: United Kingdom Military Robots Industry Revenue (Million) Forecast, by Application 2019 & 2032
                                                              13. Table 13: France Military Robots Industry Revenue (Million) Forecast, by Application 2019 & 2032
                                                              14. Table 14: Germany Military Robots Industry Revenue (Million) Forecast, by Application 2019 & 2032
                                                              15. Table 15: Russia Military Robots Industry Revenue (Million) Forecast, by Application 2019 & 2032
                                                              16. Table 16: Rest of Europe Military Robots Industry Revenue (Million) Forecast, by Application 2019 & 2032
                                                              17. Table 17: Global Military Robots Industry Revenue Million Forecast, by Country 2019 & 2032
                                                              18. Table 18: China Military Robots Industry Revenue (Million) Forecast, by Application 2019 & 2032
                                                              19. Table 19: India Military Robots Industry Revenue (Million) Forecast, by Application 2019 & 2032
                                                              20. Table 20: Japan Military Robots Industry Revenue (Million) Forecast, by Application 2019 & 2032
                                                              21. Table 21: South Korea Military Robots Industry Revenue (Million) Forecast, by Application 2019 & 2032
                                                              22. Table 22: Rest of Asia Pacific Military Robots Industry Revenue (Million) Forecast, by Application 2019 & 2032
                                                              23. Table 23: Global Military Robots Industry Revenue Million Forecast, by Country 2019 & 2032
                                                              24. Table 24: Brazil Military Robots Industry Revenue (Million) Forecast, by Application 2019 & 2032
                                                              25. Table 25: Rest of Latin America Military Robots Industry Revenue (Million) Forecast, by Application 2019 & 2032
                                                              26. Table 26: Global Military Robots Industry Revenue Million Forecast, by Country 2019 & 2032
                                                              27. Table 27: Saudi Arabia Military Robots Industry Revenue (Million) Forecast, by Application 2019 & 2032
                                                              28. Table 28: United Arab Emirates Military Robots Industry Revenue (Million) Forecast, by Application 2019 & 2032
                                                              29. Table 29: Israel Military Robots Industry Revenue (Million) Forecast, by Application 2019 & 2032
                                                              30. Table 30: Turkey Military Robots Industry Revenue (Million) Forecast, by Application 2019 & 2032
                                                              31. Table 31: Rest of Middle East and Africa Military Robots Industry Revenue (Million) Forecast, by Application 2019 & 2032
                                                              32. Table 32: Global Military Robots Industry Revenue Million Forecast, by Production Analysis 2019 & 2032
                                                              33. Table 33: Global Military Robots Industry Revenue Million Forecast, by Consumption Analysis 2019 & 2032
                                                              34. Table 34: Global Military Robots Industry Revenue Million Forecast, by Import Market Analysis (Value & Volume) 2019 & 2032
                                                              35. Table 35: Global Military Robots Industry Revenue Million Forecast, by Export Market Analysis (Value & Volume) 2019 & 2032
                                                              36. Table 36: Global Military Robots Industry Revenue Million Forecast, by Price Trend Analysis 2019 & 2032
                                                              37. Table 37: Global Military Robots Industry Revenue Million Forecast, by Country 2019 & 2032
                                                              38. Table 38: United States Military Robots Industry Revenue (Million) Forecast, by Application 2019 & 2032
                                                              39. Table 39: Canada Military Robots Industry Revenue (Million) Forecast, by Application 2019 & 2032
                                                              40. Table 40: Mexico Military Robots Industry Revenue (Million) Forecast, by Application 2019 & 2032
                                                              41. Table 41: Global Military Robots Industry Revenue Million Forecast, by Production Analysis 2019 & 2032
                                                              42. Table 42: Global Military Robots Industry Revenue Million Forecast, by Consumption Analysis 2019 & 2032
                                                              43. Table 43: Global Military Robots Industry Revenue Million Forecast, by Import Market Analysis (Value & Volume) 2019 & 2032
                                                              44. Table 44: Global Military Robots Industry Revenue Million Forecast, by Export Market Analysis (Value & Volume) 2019 & 2032
                                                              45. Table 45: Global Military Robots Industry Revenue Million Forecast, by Price Trend Analysis 2019 & 2032
                                                              46. Table 46: Global Military Robots Industry Revenue Million Forecast, by Country 2019 & 2032
                                                              47. Table 47: Brazil Military Robots Industry Revenue (Million) Forecast, by Application 2019 & 2032
                                                              48. Table 48: Argentina Military Robots Industry Revenue (Million) Forecast, by Application 2019 & 2032
                                                              49. Table 49: Rest of South America Military Robots Industry Revenue (Million) Forecast, by Application 2019 & 2032
                                                              50. Table 50: Global Military Robots Industry Revenue Million Forecast, by Production Analysis 2019 & 2032
                                                              51. Table 51: Global Military Robots Industry Revenue Million Forecast, by Consumption Analysis 2019 & 2032
                                                              52. Table 52: Global Military Robots Industry Revenue Million Forecast, by Import Market Analysis (Value & Volume) 2019 & 2032
                                                              53. Table 53: Global Military Robots Industry Revenue Million Forecast, by Export Market Analysis (Value & Volume) 2019 & 2032
                                                              54. Table 54: Global Military Robots Industry Revenue Million Forecast, by Price Trend Analysis 2019 & 2032
                                                              55. Table 55: Global Military Robots Industry Revenue Million Forecast, by Country 2019 & 2032
                                                              56. Table 56: United Kingdom Military Robots Industry Revenue (Million) Forecast, by Application 2019 & 2032
                                                              57. Table 57: Germany Military Robots Industry Revenue (Million) Forecast, by Application 2019 & 2032
                                                              58. Table 58: France Military Robots Industry Revenue (Million) Forecast, by Application 2019 & 2032
                                                              59. Table 59: Italy Military Robots Industry Revenue (Million) Forecast, by Application 2019 & 2032
                                                              60. Table 60: Spain Military Robots Industry Revenue (Million) Forecast, by Application 2019 & 2032
                                                              61. Table 61: Russia Military Robots Industry Revenue (Million) Forecast, by Application 2019 & 2032
                                                              62. Table 62: Benelux Military Robots Industry Revenue (Million) Forecast, by Application 2019 & 2032
                                                              63. Table 63: Nordics Military Robots Industry Revenue (Million) Forecast, by Application 2019 & 2032
                                                              64. Table 64: Rest of Europe Military Robots Industry Revenue (Million) Forecast, by Application 2019 & 2032
                                                              65. Table 65: Global Military Robots Industry Revenue Million Forecast, by Production Analysis 2019 & 2032
                                                              66. Table 66: Global Military Robots Industry Revenue Million Forecast, by Consumption Analysis 2019 & 2032
                                                              67. Table 67: Global Military Robots Industry Revenue Million Forecast, by Import Market Analysis (Value & Volume) 2019 & 2032
                                                              68. Table 68: Global Military Robots Industry Revenue Million Forecast, by Export Market Analysis (Value & Volume) 2019 & 2032
                                                              69. Table 69: Global Military Robots Industry Revenue Million Forecast, by Price Trend Analysis 2019 & 2032
                                                              70. Table 70: Global Military Robots Industry Revenue Million Forecast, by Country 2019 & 2032
                                                              71. Table 71: Turkey Military Robots Industry Revenue (Million) Forecast, by Application 2019 & 2032
                                                              72. Table 72: Israel Military Robots Industry Revenue (Million) Forecast, by Application 2019 & 2032
                                                              73. Table 73: GCC Military Robots Industry Revenue (Million) Forecast, by Application 2019 & 2032
                                                              74. Table 74: North Africa Military Robots Industry Revenue (Million) Forecast, by Application 2019 & 2032
                                                              75. Table 75: South Africa Military Robots Industry Revenue (Million) Forecast, by Application 2019 & 2032
                                                              76. Table 76: Rest of Middle East & Africa Military Robots Industry Revenue (Million) Forecast, by Application 2019 & 2032
                                                              77. Table 77: Global Military Robots Industry Revenue Million Forecast, by Production Analysis 2019 & 2032
                                                              78. Table 78: Global Military Robots Industry Revenue Million Forecast, by Consumption Analysis 2019 & 2032
                                                              79. Table 79: Global Military Robots Industry Revenue Million Forecast, by Import Market Analysis (Value & Volume) 2019 & 2032
                                                              80. Table 80: Global Military Robots Industry Revenue Million Forecast, by Export Market Analysis (Value & Volume) 2019 & 2032
                                                              81. Table 81: Global Military Robots Industry Revenue Million Forecast, by Price Trend Analysis 2019 & 2032
                                                              82. Table 82: Global Military Robots Industry Revenue Million Forecast, by Country 2019 & 2032
                                                              83. Table 83: China Military Robots Industry Revenue (Million) Forecast, by Application 2019 & 2032
                                                              84. Table 84: India Military Robots Industry Revenue (Million) Forecast, by Application 2019 & 2032
                                                              85. Table 85: Japan Military Robots Industry Revenue (Million) Forecast, by Application 2019 & 2032
                                                              86. Table 86: South Korea Military Robots Industry Revenue (Million) Forecast, by Application 2019 & 2032
                                                              87. Table 87: ASEAN Military Robots Industry Revenue (Million) Forecast, by Application 2019 & 2032
                                                              88. Table 88: Oceania Military Robots Industry Revenue (Million) Forecast, by Application 2019 & 2032
                                                              89. Table 89: Rest of Asia Pacific Military Robots Industry Revenue (Million) Forecast, by Application 2019 & 2032


                                                              Frequently Asked Questions

                                                              1. What is the projected Compound Annual Growth Rate (CAGR) of the Military Robots Industry?

                                                              The projected CAGR is approximately 6.97%.

                                                              2. Which companies are prominent players in the Military Robots Industry?

                                                              Key companies in the market include Textron Inc, THALES, General Dynamics Corporation, BAYKAR, Elbit Systems Ltd, Lockheed Martin Corporation, QinetiQ Group PLC, Cobham Ltd, AeroVironment Inc, IAI, Aeronautics Ltd, BAE Systems plc, Northrop Grumman Corporation, Saab AB, Teledyne FLIR LLC.

                                                              3. What are the main segments of the Military Robots Industry?

                                                              The market segments include Production Analysis, Consumption Analysis, Import Market Analysis (Value & Volume), Export Market Analysis (Value & Volume), Price Trend Analysis.

                                                              4. Can you provide details about the market size?

                                                              The market size is estimated to be USD 24.37 Million as of 2022.

                                                              5. What are some drivers contributing to market growth?

                                                              ; Increasing Number Of Air Passengers; Use Of Portable Electronic Devices.

                                                              6. What are the notable trends driving market growth?

                                                              Land Segment Anticipated to Generate Highest Growth During the Forecast Period.

                                                              7. Are there any restraints impacting market growth?

                                                              ; High Cost Of Connectivity Equipments.

                                                              8. Can you provide examples of recent developments in the market?

                                                              October 2023: The US Army is reportedly developing integrated formations of robots and human operators as part of the modernization efforts. The US Army’s Rapid Capabilities and Critical Technologies Office (RCCTO) plans to use existing science and technology as well as information from fielded programs to figure out how to combine capabilities to maximize coordination on the battlefield.

                                                              9. What pricing options are available for accessing the report?

                                                              Pricing options include single-user, multi-user, and enterprise licenses priced at USD 4750, USD 5250, and USD 8750 respectively.

                                                              10. Is the market size provided in terms of value or volume?

                                                              The market size is provided in terms of value, measured in Million.

                                                              11. Are there any specific market keywords associated with the report?

                                                              Yes, the market keyword associated with the report is "Military Robots Industry," which aids in identifying and referencing the specific market segment covered.

                                                              12. How do I determine which pricing option suits my needs best?

                                                              The pricing options vary based on user requirements and access needs. Individual users may opt for single-user licenses, while businesses requiring broader access may choose multi-user or enterprise licenses for cost-effective access to the report.

                                                              13. Are there any additional resources or data provided in the Military Robots Industry report?

                                                              While the report offers comprehensive insights, it's advisable to review the specific contents or supplementary materials provided to ascertain if additional resources or data are available.

                                                              14. How can I stay updated on further developments or reports in the Military Robots Industry?

                                                              To stay informed about further developments, trends, and reports in the Military Robots Industry, consider subscribing to industry newsletters, following relevant companies and organizations, or regularly checking reputable industry news sources and publications.


                                                              Methodology

                                                              Step 1 - Identification of Relevant Samples Size from Population Database

                                                              Step Chart
                                                              Bar Chart
                                                              Method Chart

                                                              Step 2 - Approaches for Defining Global Market Size (Value, Volume* & Price*)

                                                              Approach Chart
                                                              Top-down and bottom-up approaches are used to validate the global market size and estimate the market size for manufactures, regional segments, product, and application.

                                                              Note*: In applicable scenarios

                                                              Step 3 - Data Sources

                                                              Primary Research

                                                              • Web Analytics
                                                              • Survey Reports
                                                              • Research Institute
                                                              • Latest Research Reports
                                                              • Opinion Leaders

                                                              Secondary Research

                                                              • Annual Reports
                                                              • White Paper
                                                              • Latest Press Release
                                                              • Industry Association
                                                              • Paid Database
                                                              • Investor Presentations
                                                              Analyst Chart

                                                              Step 4 - Data Triangulation

                                                              Involves using different sources of information in order to increase the validity of a study

                                                              These sources are likely to be stakeholders in a program - participants, other researchers, program staff, other community members, and so on.

                                                              Then we put all data in single framework & apply various statistical tools to find out the dynamic on the market.

                                                              During the analysis stage, feedback from the stakeholder groups would be compared to determine areas of agreement as well as areas of divergence

                                                              Additionally, after gathering mixed and scattered data from a wide range of sources, data is triangulated and correlated to come up with estimated figures which are further validated through primary mediums or industry experts, opinion leaders.

                                                              About Research Axiom

                                                              Research Axiom delivers in-depth market research, industry analysis, and consulting for pharmaceuticals, automotive, IT, and consumer goods. Our reports provide the clarity you need to make informed decisions and drive innovation.

                                                              Our team combines primary research, advanced analytics, and sector expertise to deliver actionable intelligence. We offer syndicated reports, custom research, and consulting services tailored to your business needs.

                                                              At Research Axiom, we are committed to quality, transparency, and client satisfaction. Every report is rigorously validated to ensure accuracy and relevance. Our global perspective and local expertise help you understand both the big picture and the finer details of your market.

                                                              Stay informed with Research Axiom. Subscribe to our newsletter for the latest updates and research highlights, and follow us on social media for real-time insights. Research Axiom – Turning Data into Business Advantage.

                                                              artwork spiralartwork spiralRelated Reports
                                                              artwork underline

                                                              Southeast Asia, Middle-East And Africa Small Arms And Ammunition Market 2025-2033: Preparing for Growth and Change

                                                              The Southeast Asia, Middle East & Africa small arms and ammunition market is projected to reach \$1.07 billion by 2033, growing at a CAGR of 1.83%. This report analyzes market drivers, restraints, and key players, offering valuable insights into this dynamic sector. Explore regional breakdowns and future projections.

                                                              July 2025
                                                              Base Year: 2024
                                                              No Of Pages: 234
                                                              Price: $4750

                                                              Naval Combat Weapons Market Strategic Roadmap: Analysis and Forecasts 2025-2033

                                                              The Naval Combat Weapons market is booming, projected to reach $XX million by 2033 with a 4% CAGR. This comprehensive analysis explores market drivers, trends, restraints, and key players like General Dynamics and Lockheed Martin, covering segments like underwater and surface-based weapons across diverse regions. Discover the future of naval warfare technology.

                                                              July 2025
                                                              Base Year: 2024
                                                              No Of Pages: 234
                                                              Price: $4750

                                                              Target Acquisition Systems Market Report 2025: Growth Driven by Government Incentives and Partnerships

                                                              Discover the explosive growth in the Target Acquisition Systems market, projected to exceed a 5.5% CAGR through 2033. This in-depth analysis reveals key drivers, market segments (land, airborne, naval), leading companies, and regional trends. Learn how technological advancements and geopolitical factors are shaping this lucrative sector.

                                                              July 2025
                                                              Base Year: 2024
                                                              No Of Pages: 234
                                                              Price: $4750

                                                              Aerospace Plastics Industry Market Outlook and Strategic Insights

                                                              The Aerospace Plastics Market is booming, projected to reach $25 billion by 2033 at a CAGR of 7.66%. Driven by lightweighting and fuel efficiency demands, this report analyzes market trends, key players (Premium AEROTEC, Toray Industries), regional growth (North America, Asia-Pacific), and segment applications (aerostructures, cabin interiors). Discover insights into this rapidly expanding sector.

                                                              July 2025
                                                              Base Year: 2024
                                                              No Of Pages: 234
                                                              Price: $4750

                                                              Challenges to Overcome in Commercial Airport Lighting Market Market Growth: Analysis 2025-2033

                                                              The commercial airport lighting market is booming, projected to reach [estimated 2033 market size] by 2033, driven by LED adoption and infrastructure expansion. Learn about market trends, key players (Honeywell, ADB SAFEGATE, etc.), and regional growth in this in-depth analysis.

                                                              July 2025
                                                              Base Year: 2024
                                                              No Of Pages: 234
                                                              Price: $4750

                                                              North America Small Satellite Market 2025-2033 Trends: Unveiling Growth Opportunities and Competitor Dynamics

                                                              The North American small satellite market is booming, with a projected CAGR of 5.18% through 2033. Driven by commercial and government demand for Earth observation, communication, and navigation, this report analyzes market size, key players (SpaceX, Swarm Technologies, etc.), and emerging trends in LEO, GEO, and MEO satellite technology. Discover the opportunities and challenges shaping this dynamic sector.

                                                              July 2025
                                                              Base Year: 2024
                                                              No Of Pages: 197
                                                              Price: $3800

                                                              Aircraft Door Market CAGR Growth Drivers and Trends: Forecasts 2025-2033

                                                              The aircraft door market is booming, projected to reach $8.48 billion by 2033 at a CAGR of 5.69%. This in-depth analysis explores market drivers, trends, restraints, segmentation (commercial, military, general aviation; passenger, cargo, emergency doors), key players (Safran, Collins Aerospace, etc.), and regional growth forecasts. Discover the opportunities and challenges shaping this dynamic sector.

                                                              July 2025
                                                              Base Year: 2024
                                                              No Of Pages: 234
                                                              Price: $4750

                                                              Future-Forward Strategies for EMEA Aviation Infrastructure Industry Industry

                                                              The EMEA aviation infrastructure market is booming, projected to reach $1.47 billion by 2033 with a 4.42% CAGR. Discover key market trends, drivers, restraints, and major players shaping this dynamic sector. Explore regional breakdowns and infrastructure segment analyses.

                                                              July 2025
                                                              Base Year: 2024
                                                              No Of Pages: 234
                                                              Price: $4750

                                                              APAC Military Aircraft Modernization and Retrofit Market 2025 Market Trends and 2033 Forecasts: Exploring Growth Potential

                                                              The APAC military aircraft modernization and retrofit market is booming, projected to reach $13.71 billion by 2025, driven by geopolitical tensions and technological advancements. Learn about key market trends, major players, and growth forecasts until 2033.

                                                              July 2025
                                                              Base Year: 2024
                                                              No Of Pages: 197
                                                              Price: $3800

                                                              Future-Ready Strategies for North America Charter Jet Services Market Market Growth

                                                              The North America charter jet services market is booming, projected to reach \$24.2 billion by 2033 with a 9.1% CAGR. Discover key trends, drivers, and leading companies shaping this lucrative private aviation sector. Learn about market segmentation by aircraft size and regional analysis focusing on the US, Canada, and Mexico.

                                                              July 2025
                                                              Base Year: 2024
                                                              No Of Pages: 234
                                                              Price: $4750

                                                              Middle East Aviation Market Report Probes the XXX Million Size, Share, Growth Report and Future Analysis by 2033

                                                              The Middle East aviation market, a $27.18 billion industry in 2025, is booming. Discover key trends, growth drivers (tourism, infrastructure investments), and leading companies shaping this rapidly expanding sector with a projected 4.40% CAGR until 2033. Explore regional market shares and future projections for commercial, military, and general aviation.

                                                              July 2025
                                                              Base Year: 2024
                                                              No Of Pages: 234
                                                              Price: $4750

                                                              Commercial Airport Radar Systems Industry Future-proof Strategies: Trends, Competitor Dynamics, and Opportunities 2025-2033

                                                              The Commercial Airport Radar Systems market is booming, projected to reach $5.98B in 2025 with a 7.48% CAGR. Discover key trends, drivers, restraints, and leading companies shaping this vital sector for air traffic management. Learn about market segmentation by application (surveillance, weather, approach radars) and regional analysis.

                                                              July 2025
                                                              Base Year: 2024
                                                              No Of Pages: 234
                                                              Price: $4750

                                                              Market Deep Dive: Exploring Defense Aircraft Materials Market Trends 2025-2033

                                                              Discover the booming defense aircraft materials market! This comprehensive analysis reveals key trends, drivers, and restraints impacting growth through 2033, covering materials like aluminum alloys, titanium, and composites, and major players like Toray and DuPont. Explore regional market shares and forecast data.

                                                              July 2025
                                                              Base Year: 2024
                                                              No Of Pages: 234
                                                              Price: $4750

                                                              Future Trends Shaping Naval ISR Market Growth

                                                              Discover the booming Naval ISR market, projected to reach $XX million by 2033 with a 3.5% CAGR. Explore market drivers, trends, and key players like Lockheed Martin and General Dynamics. Learn about regional growth in North America, Europe, and Asia-Pacific. Get the insights you need for strategic planning.

                                                              July 2025
                                                              Base Year: 2024
                                                              No Of Pages: 234
                                                              Price: $4750

                                                              Latin America Inflight Services Market Market’s Growth Blueprint

                                                              Discover the booming Latin American inflight services market! This comprehensive analysis reveals a $1.11B market in 2025, projecting 9.91% CAGR growth to 2033. Explore key drivers, trends, and challenges impacting airlines, catering companies, and passenger experiences. Learn about market segmentation, leading players, and regional opportunities.

                                                              July 2025
                                                              Base Year: 2024
                                                              No Of Pages: 234
                                                              Price: $4750

                                                              Airport Ground Handling Vehicles Industry 2025-2033 Trends: Unveiling Growth Opportunities and Competitor Dynamics

                                                              The Airport Ground Handling Vehicles market is booming, projected to reach $8.94B by 2025 with a 5.99% CAGR. Discover key trends, drivers, and restraints shaping this industry, including the rise of electric vehicles and regional market analysis. Learn about leading companies and future growth forecasts.

                                                              July 2025
                                                              Base Year: 2024
                                                              No Of Pages: 234
                                                              Price: $4750

                                                              Exploring Opportunities in Naval Gas Turbine Market Sector

                                                              Discover the booming Naval Gas Turbine Market, projected to reach $X million by 2033 with a CAGR exceeding 7.80%. Explore market drivers, trends, restraints, key players (GE, Rolls Royce, Mitsubishi), and regional analysis (North America, Europe, Asia-Pacific). Get the insights you need to navigate this high-growth sector.

                                                              July 2025
                                                              Base Year: 2024
                                                              No Of Pages: 234
                                                              Price: $4750

                                                              Middle East Civil Aviation Flight Training and Simulation Market in Emerging Markets: Analysis and Projections 2025-2033

                                                              The Middle East Civil Aviation Flight Training & Simulation Market is booming, with a CAGR exceeding 15%! Discover key trends, drivers, restraints, and leading companies shaping this lucrative sector. Explore market size projections to 2033 and regional breakdowns for the UAE, Saudi Arabia, and more.

                                                              July 2025
                                                              Base Year: 2024
                                                              No Of Pages: 234
                                                              Price: $4750

                                                              Aircraft Winglets Market Market Expansion: Growth Outlook 2025-2033

                                                              The Aircraft Winglets Market is booming, projected to reach \$4.78 billion by 2033, with a CAGR of 7.90%. This report analyzes market drivers, trends, and key players like Aviation Partners Boeing and BLR Aerospace, offering insights into fuel-efficient aviation technologies.

                                                              July 2025
                                                              Base Year: 2024
                                                              No Of Pages: 234
                                                              Price: $4750

                                                              SATCOM Industry Market Expansion Strategies

                                                              The global SATCOM market is booming, with a projected 23.54% CAGR through 2033. Driven by IoT, cloud computing, and government initiatives, this report analyzes market size, segments (LEO, GEO, MEO, satellite mass), key players (SpaceX, Intelsat, Airbus), and regional trends. Discover the future of satellite communication!

                                                              July 2025
                                                              Base Year: 2024
                                                              No Of Pages: 197
                                                              Price: $3800

                                                              Business Address

                                                              Head Office

                                                              Office no. A 5010, fifth floor, Solitaire Business Hub, Near Phoenix mall, Pune, Maharashtra 411014

                                                              Contact Information

                                                              Craig Francis

                                                              Business Development Head

                                                              +17162654855

                                                              [email protected]

                                                              Connect With Us

                                                              Secure Payment Partners

                                                              payment image
                                                              RetailLogisticsPackagingAutomotiveHealthcareAgricultureEnergy & PowerFood & BeverageAerospace & DefenseChemicals & MaterialsHospitality and TourismAnimal Nutrition & WellnessConsumer Goods and ServicesReal Estate and ConstructionHome and Property ImprovementTechnology, Media and TelecomManufacturing Products and ServicesFinancial Services and Investment Intelligence

                                                              © 2025 All rights reserved


                                                              Privacy Policy
                                                              Terms and Conditions
                                                              FAQ
                                                              • Home
                                                              • About Us
                                                              • Industries
                                                                • Aerospace & Defense
                                                                • Agriculture
                                                                • Animal Nutrition & Wellness
                                                                • Automotive
                                                                • Chemicals & Materials
                                                                • Consumer Goods and Services
                                                                • Energy & Power
                                                                • Financial Services and Investment Intelligence
                                                                • Food & Beverage
                                                                • Home and Property Improvement
                                                                • Hospitality and Tourism
                                                                • Logistics
                                                                • Manufacturing Products and Services
                                                                • Packaging
                                                                • Professional and Commercial Services
                                                                • Real Estate and Construction
                                                                • Retail
                                                                • Technology, Media and Telecom
                                                                • Healthcare
                                                              • Services
                                                              • Contact
                                                              Main Logo
                                                              • Home
                                                              • About Us
                                                              • Industries
                                                                • Aerospace & Defense
                                                                • Agriculture
                                                                • Animal Nutrition & Wellness
                                                                • Automotive
                                                                • Chemicals & Materials
                                                                • Consumer Goods and Services
                                                                • Energy & Power
                                                                • Financial Services and Investment Intelligence
                                                                • Food & Beverage
                                                                • Home and Property Improvement
                                                                • Hospitality and Tourism
                                                                • Logistics
                                                                • Manufacturing Products and Services
                                                                • Packaging
                                                                • Professional and Commercial Services
                                                                • Real Estate and Construction
                                                                • Retail
                                                                • Technology, Media and Telecom
                                                                • Healthcare
                                                              • Services
                                                              • Contact
                                                              +17162654855
                                                              [email protected]

                                                              +17162654855

                                                              [email protected]