
Key Insights
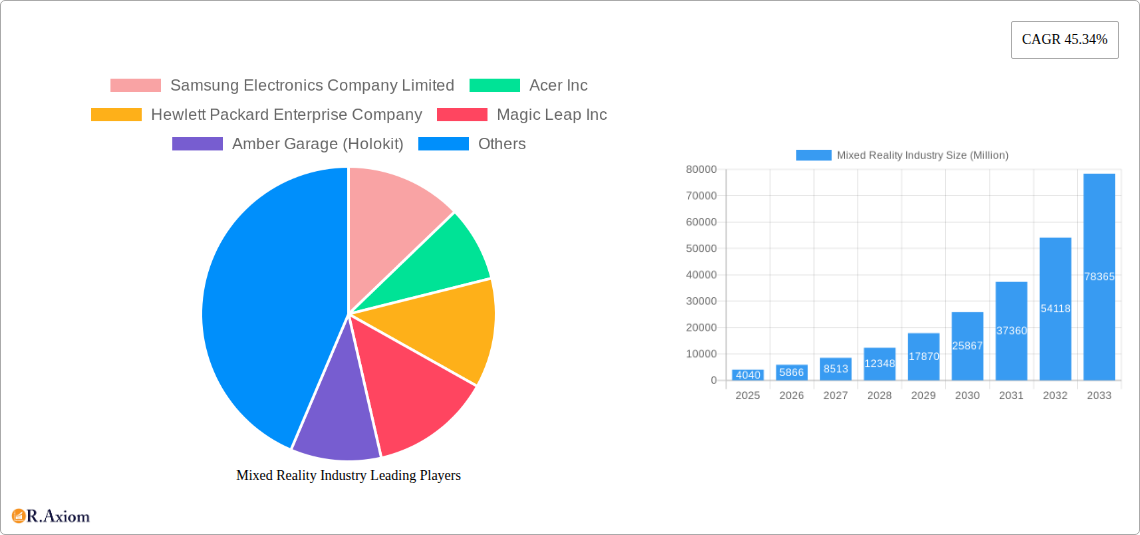
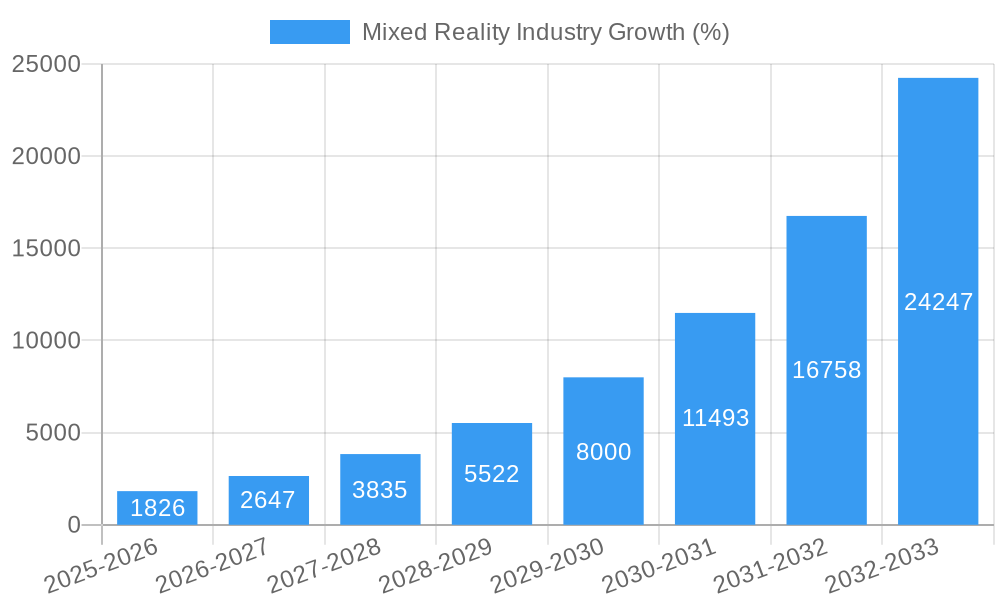
The mixed reality (MR) industry is experiencing explosive growth, projected to reach a market size of $4.04 billion in 2025 and exhibiting a remarkable Compound Annual Growth Rate (CAGR) of 45.34%. This surge is fueled by several key drivers. Advancements in hardware technology, including lighter and more powerful headsets and improved tracking capabilities, are making MR more accessible and user-friendly. Simultaneously, the development of more immersive and interactive software applications is expanding the range of use cases across diverse sectors. The education sector benefits from interactive learning experiences, while engineering utilizes MR for design and prototyping. Healthcare leverages MR for surgical planning and training, and entertainment is revolutionized through engaging gaming and virtual events. The growing adoption of cloud computing and 5G networks further enhances the MR experience, enabling seamless data transmission and reduced latency.
However, despite this rapid expansion, the MR market faces certain challenges. High initial costs of hardware and software remain a barrier to entry for many consumers and businesses. Furthermore, the potential for motion sickness and user discomfort needs to be addressed through technological improvements and user interface design enhancements. The development of robust content libraries is also crucial to driving wider adoption. Despite these restraints, the long-term outlook for the MR industry remains overwhelmingly positive, driven by ongoing technological innovation and the expansion of its application across various sectors. The consistent refinement of MR technology is anticipated to overcome existing limitations, further solidifying its position in the future technological landscape.
Mixed Reality Industry Market Report: 2019-2033
This comprehensive report provides a detailed analysis of the Mixed Reality (MR) industry, offering invaluable insights for stakeholders seeking to understand market dynamics, identify growth opportunities, and navigate the competitive landscape. The report covers the period from 2019 to 2033, with a focus on the 2025-2033 forecast period. It incorporates data from key players such as Samsung Electronics, Acer, Hewlett Packard Enterprise, Magic Leap, Amber Garage, Microsoft, AsusTek, Meta Platforms, Dell Technologies, and Occipital, among others. The global market size in 2025 is estimated at $XX Million.
Mixed Reality Industry Market Concentration & Innovation
The Mixed Reality market exhibits a moderately concentrated landscape with a few major players holding significant market share. However, the emergence of numerous startups and the continuous technological advancements are fostering increased competition. Market concentration is influenced by factors such as R&D investments, intellectual property ownership, and successful product launches. The market share of the top 5 companies in 2025 is estimated at approximately 60%, with Microsoft and Meta Platforms holding leading positions. Innovation is driven primarily by advancements in areas such as display technology, processing power, and sensor integration. Regulatory frameworks, while still evolving, are increasingly focusing on data privacy and security concerns related to MR applications. Product substitutes, such as Virtual Reality (VR) and Augmented Reality (AR) technologies, pose competitive challenges. M&A activities are relatively frequent, primarily involving smaller companies being acquired by larger players to consolidate technology and market share. The total value of M&A deals in the MR industry between 2019 and 2024 is estimated at $XX Million.
Mixed Reality Industry Industry Trends & Insights
The Mixed Reality industry is experiencing robust growth, driven by several key factors. Technological disruptions, such as improvements in processing power, display resolution, and sensor technology, are expanding the capabilities of MR devices and applications. Consumer preferences are shifting towards more immersive and interactive experiences, fueling demand for MR solutions in various sectors. The compound annual growth rate (CAGR) for the MR market during the forecast period (2025-2033) is projected at XX%. Market penetration is expected to increase significantly, driven by falling prices and growing awareness among consumers and businesses. Competitive dynamics are intense, with established players and new entrants vying for market share through innovation, strategic partnerships, and aggressive pricing strategies. The global market size is projected to reach $XX Million by 2033.
Dominant Markets & Segments in Mixed Reality Industry
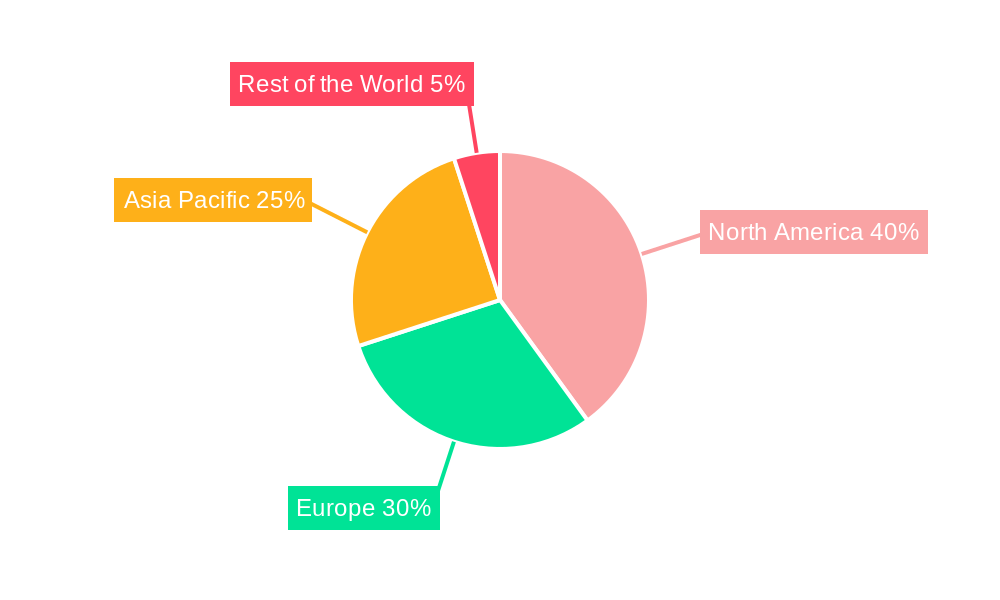
The Mixed Reality market is experiencing strong growth across multiple segments, with North America and Europe currently leading in adoption and investment. Key drivers of dominance include robust technological infrastructure, high consumer spending power, and substantial government support for technological advancements.
- Education: The integration of MR technologies in classrooms is revolutionizing learning experiences, enhancing engagement and comprehension. The sector's growth is fueled by the increasing adoption of interactive simulations and training programs.
- Engineering: MR tools empower engineers with efficient design, prototyping, and collaborative tools, fostering innovation and reducing development time. Robust growth is driven by the need for higher efficiency and productivity in design and manufacturing processes.
- Entertainment: The immersive nature of MR experiences is transforming the entertainment industry, offering new avenues for gaming, storytelling, and live events. Growth is driven by the increasing demand for engaging and interactive entertainment options.
- Healthcare: MR applications are proving transformative in medical training, surgical planning, and patient care. Rapid advancements in medical imaging and diagnostic tools further contribute to sector growth.
- Other End-user Verticals: The adoption of MR technologies is expanding across numerous other sectors, including retail, manufacturing, and defense, driven by increasing demand for improved operational efficiencies and cost reduction measures.
Mixed Reality Industry Product Developments
Recent product developments in the MR industry focus on enhancing user experience through improved ergonomics, field of view, and processing power. Smaller, lighter, and more affordable headsets are becoming increasingly available, driving wider adoption. Integration of advanced haptic feedback technologies, which provide realistic tactile sensations, is also enhancing immersion and interaction. The market is seeing a move towards standalone MR devices which do not require connection to a PC or smartphone, further increasing accessibility and portability.
Report Scope & Segmentation Analysis
This report segments the Mixed Reality market by various end-user verticals, including Education, Engineering, Entertainment, Healthcare, and Other End-user Verticals. Each segment's growth trajectory is analyzed, taking into account factors such as market size, competitive landscape, and technological advancements. The report provides detailed market size projections for each segment for the forecast period (2025-2033), highlighting the growth potential and opportunities in each sector. The competitive landscape within each segment is also analyzed, identifying key players and their respective market strategies.
Key Drivers of Mixed Reality Industry Growth
The Mixed Reality industry's growth is primarily driven by technological advancements in areas such as improved display technologies, more powerful processors, and advanced sensors. Economic factors, including rising disposable incomes and increased corporate investment in innovative technologies, further fuel growth. Supportive government policies and regulatory frameworks also create a conducive environment for industry expansion.
Challenges in the Mixed Reality Industry Sector
Challenges facing the Mixed Reality sector include the high cost of hardware, the complexity of software development, and the need for robust infrastructure to support widespread adoption. Supply chain disruptions can also impact the availability and affordability of MR devices. Furthermore, competitive pressures from other immersive technologies, such as VR and AR, also present a significant challenge.
Emerging Opportunities in Mixed Reality Industry
Emerging opportunities lie in the integration of MR technologies with other innovative technologies such as Artificial Intelligence (AI) and 5G networks. New market segments such as remote collaboration, industrial maintenance, and immersive tourism are showing significant growth potential. The development of more affordable and user-friendly MR devices will further accelerate market expansion.
Leading Players in the Mixed Reality Industry Market
- Samsung Electronics Company Limited
- Acer Inc
- Hewlett Packard Enterprise Company
- Magic Leap Inc
- Amber Garage (Holokit)
- Microsoft Corporation
- AsusTek Computer Inc
- Meta Platform Inc
- Dell Technologies Inc
- Occipital Inc
- List Not Exhaustive
Key Developments in Mixed Reality Industry Industry
- January 2023: Microsoft announces significant advancements in its HoloLens 2 technology, enhancing its capabilities for industrial applications.
- March 2022: Meta Platforms unveils new MR headset prototypes, showcasing improved processing power and haptic feedback.
- June 2021: Samsung and a partner company announce collaboration to develop next-generation MR hardware with superior visuals.
- Further developments will be included in the full report
Strategic Outlook for Mixed Reality Industry Market
The Mixed Reality industry is poised for significant growth in the coming years, driven by continued technological advancements, increasing consumer adoption, and the expansion of applications across various sectors. The market is expected to experience substantial expansion, particularly in emerging economies, creating significant opportunities for industry participants. Strategic partnerships, investments in R&D, and innovative product development will be crucial for achieving long-term success in this dynamic market.
Mixed Reality Industry Segmentation
-
1. End-user Verticals
- 1.1. Education
- 1.2. Engineering
- 1.3. Entertainment
- 1.4. Healthcare
- 1.5. Other End-user Verticals
Mixed Reality Industry Segmentation By Geography
-
1. North America
- 1.1. United States
- 1.2. Canada
-
2. Europe
- 2.1. United Kingdom
- 2.2. France
- 2.3. Rest of Europe
-
3. Asia Pacific
- 3.1. China
- 3.2. India
- 3.3. Japan
- 3.4. Rest of Asia Pacific
- 4. Rest of the World
Mixed Reality Industry REPORT HIGHLIGHTS
| Aspects | Details |
|---|---|
| Study Period | 2019-2033 |
| Base Year | 2024 |
| Estimated Year | 2025 |
| Forecast Period | 2025-2033 |
| Historical Period | 2019-2024 |
| Growth Rate | CAGR of 45.34% from 2019-2033 |
| Segmentation |
|
Table of Contents
- 1. Introduction
- 1.1. Research Scope
- 1.2. Market Segmentation
- 1.3. Research Methodology
- 1.4. Definitions and Assumptions
- 2. Executive Summary
- 2.1. Introduction
- 3. Market Dynamics
- 3.1. Introduction
- 3.2. Market Drivers
- 3.2.1 High End-Electronic Consumer Market; Growing Adoption in Various Industries; Growing Awarness of Technology
- 3.2.2 along with Content Availability
- 3.3. Market Restrains
- 3.3.1. Lack of Standardization for Security of Digital Content
- 3.4. Market Trends
- 3.4.1. Education Sector will Hold a Significant Market Share
- 4. Market Factor Analysis
- 4.1. Porters Five Forces
- 4.2. Supply/Value Chain
- 4.3. PESTEL analysis
- 4.4. Market Entropy
- 4.5. Patent/Trademark Analysis
- 5. Global Mixed Reality Industry Analysis, Insights and Forecast, 2019-2031
- 5.1. Market Analysis, Insights and Forecast - by End-user Verticals
- 5.1.1. Education
- 5.1.2. Engineering
- 5.1.3. Entertainment
- 5.1.4. Healthcare
- 5.1.5. Other End-user Verticals
- 5.2. Market Analysis, Insights and Forecast - by Region
- 5.2.1. North America
- 5.2.2. Europe
- 5.2.3. Asia Pacific
- 5.2.4. Rest of the World
- 5.1. Market Analysis, Insights and Forecast - by End-user Verticals
- 6. North America Mixed Reality Industry Analysis, Insights and Forecast, 2019-2031
- 6.1. Market Analysis, Insights and Forecast - by End-user Verticals
- 6.1.1. Education
- 6.1.2. Engineering
- 6.1.3. Entertainment
- 6.1.4. Healthcare
- 6.1.5. Other End-user Verticals
- 6.1. Market Analysis, Insights and Forecast - by End-user Verticals
- 7. Europe Mixed Reality Industry Analysis, Insights and Forecast, 2019-2031
- 7.1. Market Analysis, Insights and Forecast - by End-user Verticals
- 7.1.1. Education
- 7.1.2. Engineering
- 7.1.3. Entertainment
- 7.1.4. Healthcare
- 7.1.5. Other End-user Verticals
- 7.1. Market Analysis, Insights and Forecast - by End-user Verticals
- 8. Asia Pacific Mixed Reality Industry Analysis, Insights and Forecast, 2019-2031
- 8.1. Market Analysis, Insights and Forecast - by End-user Verticals
- 8.1.1. Education
- 8.1.2. Engineering
- 8.1.3. Entertainment
- 8.1.4. Healthcare
- 8.1.5. Other End-user Verticals
- 8.1. Market Analysis, Insights and Forecast - by End-user Verticals
- 9. Rest of the World Mixed Reality Industry Analysis, Insights and Forecast, 2019-2031
- 9.1. Market Analysis, Insights and Forecast - by End-user Verticals
- 9.1.1. Education
- 9.1.2. Engineering
- 9.1.3. Entertainment
- 9.1.4. Healthcare
- 9.1.5. Other End-user Verticals
- 9.1. Market Analysis, Insights and Forecast - by End-user Verticals
- 10. North America Mixed Reality Industry Analysis, Insights and Forecast, 2019-2031
- 10.1. Market Analysis, Insights and Forecast - By Country/Sub-region
- 10.1.1 United States
- 10.1.2 Canada
- 11. Europe Mixed Reality Industry Analysis, Insights and Forecast, 2019-2031
- 11.1. Market Analysis, Insights and Forecast - By Country/Sub-region
- 11.1.1 United Kingdom
- 11.1.2 France
- 11.1.3 Rest of Europe
- 12. Asia Pacific Mixed Reality Industry Analysis, Insights and Forecast, 2019-2031
- 12.1. Market Analysis, Insights and Forecast - By Country/Sub-region
- 12.1.1 China
- 12.1.2 India
- 12.1.3 Japan
- 12.1.4 Rest of Asia Pacific
- 13. Rest of the World Mixed Reality Industry Analysis, Insights and Forecast, 2019-2031
- 13.1. Market Analysis, Insights and Forecast - By Country/Sub-region
- 13.1.1.
- 14. Competitive Analysis
- 14.1. Global Market Share Analysis 2024
- 14.2. Company Profiles
- 14.2.1 Samsung Electronics Company Limited
- 14.2.1.1. Overview
- 14.2.1.2. Products
- 14.2.1.3. SWOT Analysis
- 14.2.1.4. Recent Developments
- 14.2.1.5. Financials (Based on Availability)
- 14.2.2 Acer Inc
- 14.2.2.1. Overview
- 14.2.2.2. Products
- 14.2.2.3. SWOT Analysis
- 14.2.2.4. Recent Developments
- 14.2.2.5. Financials (Based on Availability)
- 14.2.3 Hewlett Packard Enterprise Company
- 14.2.3.1. Overview
- 14.2.3.2. Products
- 14.2.3.3. SWOT Analysis
- 14.2.3.4. Recent Developments
- 14.2.3.5. Financials (Based on Availability)
- 14.2.4 Magic Leap Inc
- 14.2.4.1. Overview
- 14.2.4.2. Products
- 14.2.4.3. SWOT Analysis
- 14.2.4.4. Recent Developments
- 14.2.4.5. Financials (Based on Availability)
- 14.2.5 Amber Garage (Holokit)
- 14.2.5.1. Overview
- 14.2.5.2. Products
- 14.2.5.3. SWOT Analysis
- 14.2.5.4. Recent Developments
- 14.2.5.5. Financials (Based on Availability)
- 14.2.6 Microsoft Corporation
- 14.2.6.1. Overview
- 14.2.6.2. Products
- 14.2.6.3. SWOT Analysis
- 14.2.6.4. Recent Developments
- 14.2.6.5. Financials (Based on Availability)
- 14.2.7 AsusTek Computer Inc
- 14.2.7.1. Overview
- 14.2.7.2. Products
- 14.2.7.3. SWOT Analysis
- 14.2.7.4. Recent Developments
- 14.2.7.5. Financials (Based on Availability)
- 14.2.8 Meta Platform Inc
- 14.2.8.1. Overview
- 14.2.8.2. Products
- 14.2.8.3. SWOT Analysis
- 14.2.8.4. Recent Developments
- 14.2.8.5. Financials (Based on Availability)
- 14.2.9 Dell Technologies Inc
- 14.2.9.1. Overview
- 14.2.9.2. Products
- 14.2.9.3. SWOT Analysis
- 14.2.9.4. Recent Developments
- 14.2.9.5. Financials (Based on Availability)
- 14.2.10 Occipital Inc *List Not Exhaustive
- 14.2.10.1. Overview
- 14.2.10.2. Products
- 14.2.10.3. SWOT Analysis
- 14.2.10.4. Recent Developments
- 14.2.10.5. Financials (Based on Availability)
- 14.2.1 Samsung Electronics Company Limited
List of Figures
- Figure 1: Global Mixed Reality Industry Revenue Breakdown (Million, %) by Region 2024 & 2032
- Figure 2: North America Mixed Reality Industry Revenue (Million), by Country 2024 & 2032
- Figure 3: North America Mixed Reality Industry Revenue Share (%), by Country 2024 & 2032
- Figure 4: Europe Mixed Reality Industry Revenue (Million), by Country 2024 & 2032
- Figure 5: Europe Mixed Reality Industry Revenue Share (%), by Country 2024 & 2032
- Figure 6: Asia Pacific Mixed Reality Industry Revenue (Million), by Country 2024 & 2032
- Figure 7: Asia Pacific Mixed Reality Industry Revenue Share (%), by Country 2024 & 2032
- Figure 8: Rest of the World Mixed Reality Industry Revenue (Million), by Country 2024 & 2032
- Figure 9: Rest of the World Mixed Reality Industry Revenue Share (%), by Country 2024 & 2032
- Figure 10: North America Mixed Reality Industry Revenue (Million), by End-user Verticals 2024 & 2032
- Figure 11: North America Mixed Reality Industry Revenue Share (%), by End-user Verticals 2024 & 2032
- Figure 12: North America Mixed Reality Industry Revenue (Million), by Country 2024 & 2032
- Figure 13: North America Mixed Reality Industry Revenue Share (%), by Country 2024 & 2032
- Figure 14: Europe Mixed Reality Industry Revenue (Million), by End-user Verticals 2024 & 2032
- Figure 15: Europe Mixed Reality Industry Revenue Share (%), by End-user Verticals 2024 & 2032
- Figure 16: Europe Mixed Reality Industry Revenue (Million), by Country 2024 & 2032
- Figure 17: Europe Mixed Reality Industry Revenue Share (%), by Country 2024 & 2032
- Figure 18: Asia Pacific Mixed Reality Industry Revenue (Million), by End-user Verticals 2024 & 2032
- Figure 19: Asia Pacific Mixed Reality Industry Revenue Share (%), by End-user Verticals 2024 & 2032
- Figure 20: Asia Pacific Mixed Reality Industry Revenue (Million), by Country 2024 & 2032
- Figure 21: Asia Pacific Mixed Reality Industry Revenue Share (%), by Country 2024 & 2032
- Figure 22: Rest of the World Mixed Reality Industry Revenue (Million), by End-user Verticals 2024 & 2032
- Figure 23: Rest of the World Mixed Reality Industry Revenue Share (%), by End-user Verticals 2024 & 2032
- Figure 24: Rest of the World Mixed Reality Industry Revenue (Million), by Country 2024 & 2032
- Figure 25: Rest of the World Mixed Reality Industry Revenue Share (%), by Country 2024 & 2032
List of Tables
- Table 1: Global Mixed Reality Industry Revenue Million Forecast, by Region 2019 & 2032
- Table 2: Global Mixed Reality Industry Revenue Million Forecast, by End-user Verticals 2019 & 2032
- Table 3: Global Mixed Reality Industry Revenue Million Forecast, by Region 2019 & 2032
- Table 4: Global Mixed Reality Industry Revenue Million Forecast, by Country 2019 & 2032
- Table 5: United States Mixed Reality Industry Revenue (Million) Forecast, by Application 2019 & 2032
- Table 6: Canada Mixed Reality Industry Revenue (Million) Forecast, by Application 2019 & 2032
- Table 7: Global Mixed Reality Industry Revenue Million Forecast, by Country 2019 & 2032
- Table 8: United Kingdom Mixed Reality Industry Revenue (Million) Forecast, by Application 2019 & 2032
- Table 9: France Mixed Reality Industry Revenue (Million) Forecast, by Application 2019 & 2032
- Table 10: Rest of Europe Mixed Reality Industry Revenue (Million) Forecast, by Application 2019 & 2032
- Table 11: Global Mixed Reality Industry Revenue Million Forecast, by Country 2019 & 2032
- Table 12: China Mixed Reality Industry Revenue (Million) Forecast, by Application 2019 & 2032
- Table 13: India Mixed Reality Industry Revenue (Million) Forecast, by Application 2019 & 2032
- Table 14: Japan Mixed Reality Industry Revenue (Million) Forecast, by Application 2019 & 2032
- Table 15: Rest of Asia Pacific Mixed Reality Industry Revenue (Million) Forecast, by Application 2019 & 2032
- Table 16: Global Mixed Reality Industry Revenue Million Forecast, by Country 2019 & 2032
- Table 17: Mixed Reality Industry Revenue (Million) Forecast, by Application 2019 & 2032
- Table 18: Global Mixed Reality Industry Revenue Million Forecast, by End-user Verticals 2019 & 2032
- Table 19: Global Mixed Reality Industry Revenue Million Forecast, by Country 2019 & 2032
- Table 20: United States Mixed Reality Industry Revenue (Million) Forecast, by Application 2019 & 2032
- Table 21: Canada Mixed Reality Industry Revenue (Million) Forecast, by Application 2019 & 2032
- Table 22: Global Mixed Reality Industry Revenue Million Forecast, by End-user Verticals 2019 & 2032
- Table 23: Global Mixed Reality Industry Revenue Million Forecast, by Country 2019 & 2032
- Table 24: United Kingdom Mixed Reality Industry Revenue (Million) Forecast, by Application 2019 & 2032
- Table 25: France Mixed Reality Industry Revenue (Million) Forecast, by Application 2019 & 2032
- Table 26: Rest of Europe Mixed Reality Industry Revenue (Million) Forecast, by Application 2019 & 2032
- Table 27: Global Mixed Reality Industry Revenue Million Forecast, by End-user Verticals 2019 & 2032
- Table 28: Global Mixed Reality Industry Revenue Million Forecast, by Country 2019 & 2032
- Table 29: China Mixed Reality Industry Revenue (Million) Forecast, by Application 2019 & 2032
- Table 30: India Mixed Reality Industry Revenue (Million) Forecast, by Application 2019 & 2032
- Table 31: Japan Mixed Reality Industry Revenue (Million) Forecast, by Application 2019 & 2032
- Table 32: Rest of Asia Pacific Mixed Reality Industry Revenue (Million) Forecast, by Application 2019 & 2032
- Table 33: Global Mixed Reality Industry Revenue Million Forecast, by End-user Verticals 2019 & 2032
- Table 34: Global Mixed Reality Industry Revenue Million Forecast, by Country 2019 & 2032
Frequently Asked Questions
1. What is the projected Compound Annual Growth Rate (CAGR) of the Mixed Reality Industry?
The projected CAGR is approximately 45.34%.
2. Which companies are prominent players in the Mixed Reality Industry?
Key companies in the market include Samsung Electronics Company Limited, Acer Inc, Hewlett Packard Enterprise Company, Magic Leap Inc, Amber Garage (Holokit), Microsoft Corporation, AsusTek Computer Inc, Meta Platform Inc, Dell Technologies Inc, Occipital Inc *List Not Exhaustive.
3. What are the main segments of the Mixed Reality Industry?
The market segments include End-user Verticals.
4. Can you provide details about the market size?
The market size is estimated to be USD 4.04 Million as of 2022.
5. What are some drivers contributing to market growth?
High End-Electronic Consumer Market; Growing Adoption in Various Industries; Growing Awarness of Technology. along with Content Availability.
6. What are the notable trends driving market growth?
Education Sector will Hold a Significant Market Share.
7. Are there any restraints impacting market growth?
Lack of Standardization for Security of Digital Content.
8. Can you provide examples of recent developments in the market?
N/A
9. What pricing options are available for accessing the report?
Pricing options include single-user, multi-user, and enterprise licenses priced at USD 4750, USD 5250, and USD 8750 respectively.
10. Is the market size provided in terms of value or volume?
The market size is provided in terms of value, measured in Million.
11. Are there any specific market keywords associated with the report?
Yes, the market keyword associated with the report is "Mixed Reality Industry," which aids in identifying and referencing the specific market segment covered.
12. How do I determine which pricing option suits my needs best?
The pricing options vary based on user requirements and access needs. Individual users may opt for single-user licenses, while businesses requiring broader access may choose multi-user or enterprise licenses for cost-effective access to the report.
13. Are there any additional resources or data provided in the Mixed Reality Industry report?
While the report offers comprehensive insights, it's advisable to review the specific contents or supplementary materials provided to ascertain if additional resources or data are available.
14. How can I stay updated on further developments or reports in the Mixed Reality Industry?
To stay informed about further developments, trends, and reports in the Mixed Reality Industry, consider subscribing to industry newsletters, following relevant companies and organizations, or regularly checking reputable industry news sources and publications.
Methodology
Step 1 - Identification of Relevant Samples Size from Population Database


Step 2 - Approaches for Defining Global Market Size (Value, Volume* & Price*)

Note*: In applicable scenarios
Step 3 - Data Sources
Primary Research
- Web Analytics
- Survey Reports
- Research Institute
- Latest Research Reports
- Opinion Leaders
Secondary Research
- Annual Reports
- White Paper
- Latest Press Release
- Industry Association
- Paid Database
- Investor Presentations

Step 4 - Data Triangulation
Involves using different sources of information in order to increase the validity of a study
These sources are likely to be stakeholders in a program - participants, other researchers, program staff, other community members, and so on.
Then we put all data in single framework & apply various statistical tools to find out the dynamic on the market.
During the analysis stage, feedback from the stakeholder groups would be compared to determine areas of agreement as well as areas of divergence


