
Key Insights
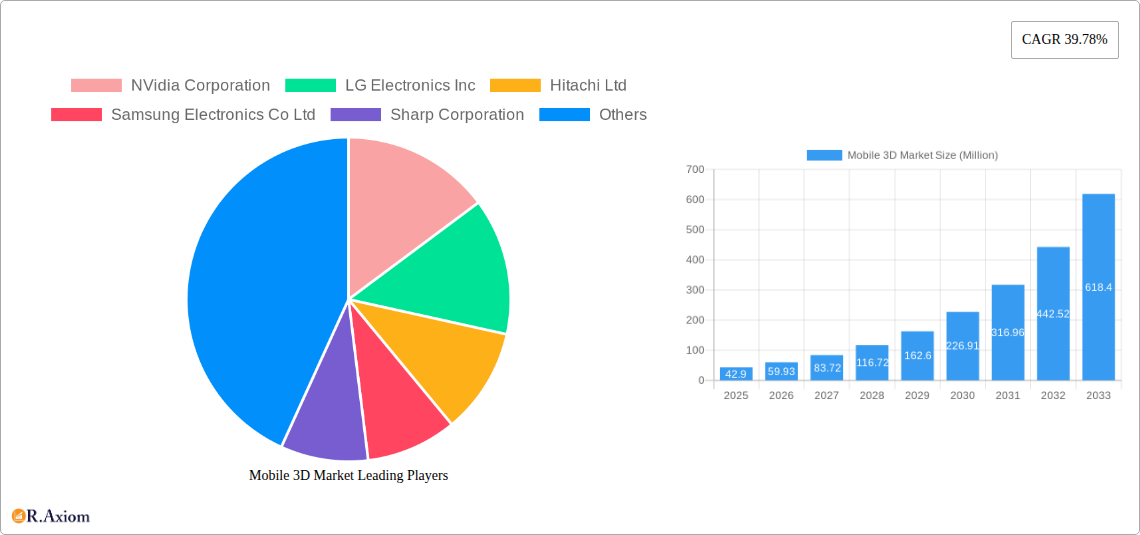
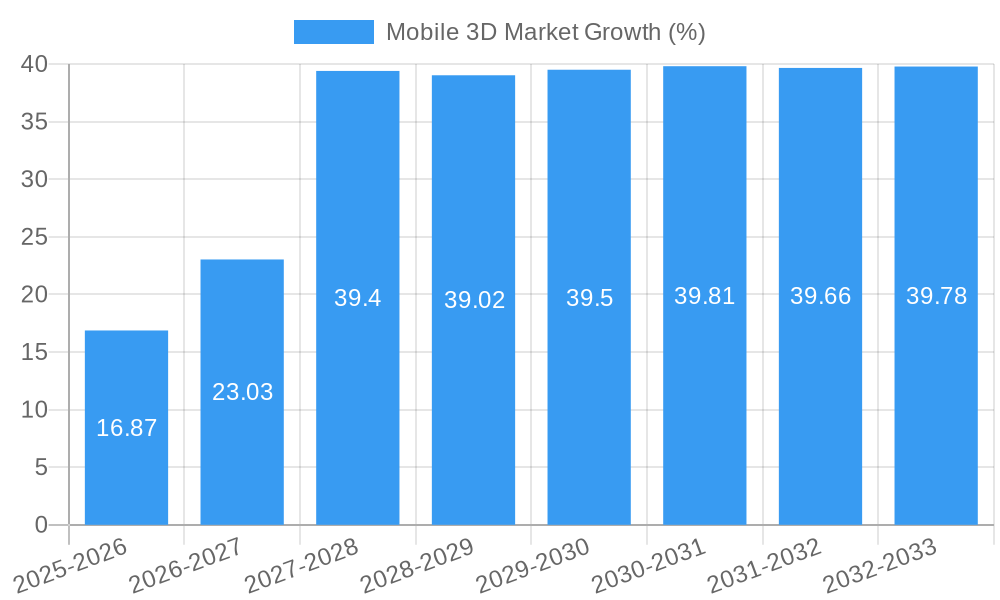
The mobile 3D market is experiencing explosive growth, projected to reach \$42.90 million in 2025 and exhibiting a remarkable Compound Annual Growth Rate (CAGR) of 39.78%. This surge is driven by several key factors. Firstly, advancements in image sensor technology and 3D display capabilities are enabling the creation of more immersive and realistic mobile experiences. Secondly, the increasing adoption of 3D applications across various sectors – from mobile gaming and animations to augmented reality (AR) navigation and interactive advertisements – fuels market expansion. The integration of 3D technology into smartphones, tablets, notebooks, and even wearable eyewear further broadens the market's reach. Leading companies like Nvidia, Samsung, Apple, and Qualcomm are actively investing in R&D and strategic partnerships, pushing technological boundaries and driving innovation. Geographic distribution shows strong growth across North America, Europe, and particularly in the rapidly developing Asia-Pacific region, fueled by increasing smartphone penetration and rising disposable incomes. The market segmentation highlights the significant contribution of smartphones as the primary driver of 3D adoption, followed by tablets and notebooks. While challenges exist, such as the cost of implementing 3D technology and ensuring seamless user experience across diverse devices, the overall market trajectory indicates continued strong growth throughout the forecast period (2025-2033).
The future of the mobile 3D market holds immense potential. Further miniaturization of 3D components, improved power efficiency, and advancements in artificial intelligence (AI) integration promise even more sophisticated and user-friendly 3D experiences. The ongoing development of 5G and 6G networks will significantly enhance the speed and quality of data transmission, crucial for supporting complex 3D applications. The expanding use of 3D technology in various sectors, including education, healthcare, and e-commerce, will further drive market growth. Competition among key players will likely intensify, leading to continuous innovation and potentially price reductions, making 3D mobile technology more accessible to a wider consumer base. The market's success will hinge on overcoming technical limitations, fostering strong collaborations across the technology ecosystem, and adapting to evolving consumer preferences.
Mobile 3D Market: A Comprehensive Report (2019-2033)
This in-depth report provides a comprehensive analysis of the Mobile 3D Market, offering valuable insights for industry stakeholders, investors, and businesses seeking to understand this rapidly evolving sector. Covering the period from 2019 to 2033, with a focus on 2025, this report delves into market dynamics, technological advancements, competitive landscapes, and future growth projections. The report's detailed segmentation across devices, components, and applications provides a granular view of the market, enabling informed decision-making. Expected market value projections reach into the Billions.
Mobile 3D Market Market Concentration & Innovation
The Mobile 3D market exhibits a moderately concentrated landscape, with a few key players holding significant market share. While exact figures for market share are proprietary within the full report, companies like Samsung Electronics Co Ltd, Apple Inc, and LG Electronics Inc are expected to hold leading positions based on their established presence and investments in 3D technologies. The market's innovation is driven by advancements in display technologies (like glass-free 3D), improved image sensors, and the development of compelling 3D applications. Regulatory frameworks, particularly concerning data privacy and security for 3D applications, play a crucial role. Product substitutes, such as enhanced 2D displays with high resolutions, pose a competitive challenge. End-user trends show a growing interest in immersive experiences, fueling demand for 3D mobile devices. M&A activities in the sector have been moderate in recent years, with deal values reaching xx Million, primarily focused on acquiring specialized technology companies.
- Key Players: Samsung Electronics Co Ltd, Apple Inc, LG Electronics Inc, and others.
- Market Concentration: Moderately concentrated.
- M&A Deal Values (2019-2024): xx Million
- Innovation Drivers: Advancements in display technologies, image sensors, and 3D applications.
Mobile 3D Market Industry Trends & Insights
The Mobile 3D market is experiencing robust growth, projected to reach xx Billion by 2033. The Compound Annual Growth Rate (CAGR) from 2025 to 2033 is estimated at xx%. Key growth drivers include the increasing demand for immersive entertainment experiences, the rising adoption of smartphones and tablets, and continuous technological advancements resulting in more affordable and accessible 3D capabilities. Technological disruptions, particularly in display technologies and processing power, are creating new opportunities. Consumer preferences are shifting towards more natural and comfortable 3D viewing experiences, driving innovation in glass-free 3D technology. Competitive dynamics are intense, with companies vying for market share through product innovation, strategic partnerships, and aggressive marketing strategies. Market penetration of 3D-enabled mobile devices is steadily increasing, particularly in the gaming and entertainment segments.
Dominant Markets & Segments in Mobile 3D Market
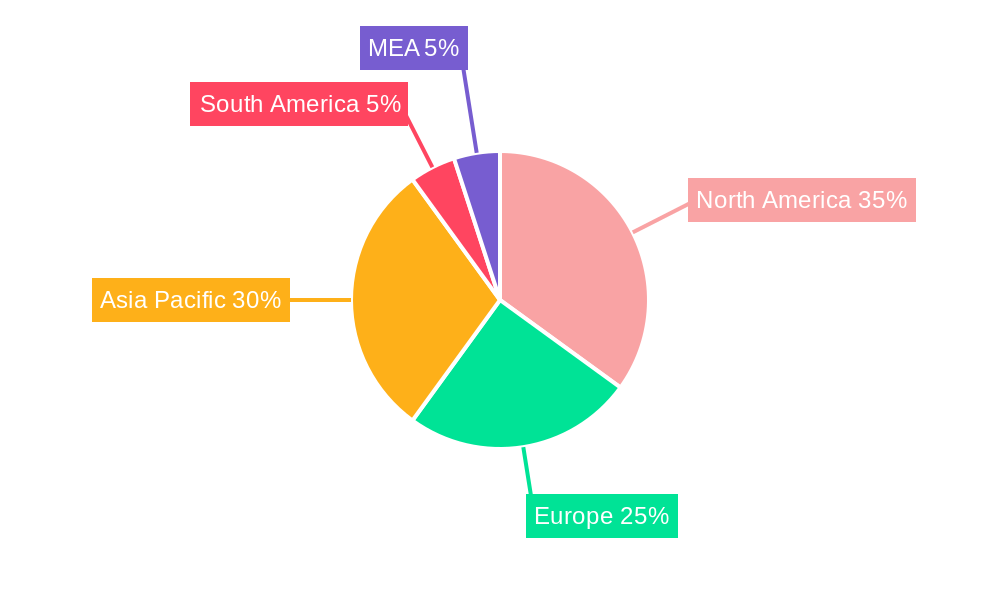
While the global nature of the market makes definitive claims of a single "dominant" region difficult, Asia-Pacific is expected to showcase significant growth and market share due to the high concentration of smartphone users and robust manufacturing capabilities. Within segments:
By 3D Enabled Mobile Devices: Smartphones are currently the dominant segment due to widespread adoption, but the tablets segment is predicted to experience notable growth.
By Device Components: 3D displays are the largest segment, representing a higher proportion of market value due to their complexity and cost. However, image sensors are likely to see significant growth with improvements in technology.
By 3D Applications: Mobile gaming and animations are the leading applications driving adoption due to their immersive nature and popularity.
Key Drivers (Asia-Pacific): Strong consumer electronics manufacturing base, large smartphone user base, and increasing disposable incomes.
Mobile 3D Market Product Developments
Recent advancements in mobile 3D technology have focused on enhancing user experience through improved display technologies (e.g., glass-free 3D, higher resolutions), miniaturization of components, and the development of intuitive user interfaces for 3D applications. The emphasis is on creating seamless and comfortable 3D experiences, without requiring cumbersome glasses or causing eye strain. This is driving market fit by making 3D technology more accessible and appealing to a broader consumer base.
Report Scope & Segmentation Analysis
This report provides a comprehensive analysis segmented by:
By 3D Enabled Mobile Devices: Smartphones, Notebooks, Tablets, Eyewear, Other 3D Enabled Devices. Each segment's market size, growth projections, and competitive dynamics are analyzed. Smartphones currently dominate but tablets and eyewear show substantial growth potential.
By Device Components: Image Sensors, 3D Displays. This segmentation examines the market size, technology trends, and competitive landscapes of each component. 3D displays represent a larger market share currently.
By 3D Applications: Animations, Maps and Navigation, Mobile Gaming, Mobile Advertisements, Other Applications. The report details market sizes and growth projections for each application segment, identifying leading applications and future opportunities.
Key Drivers of Mobile 3D Market Growth
Several factors contribute to the growth of the Mobile 3D market: Advancements in display technology, particularly glass-free 3D, are making the experience more comfortable and accessible. Increasing smartphone and tablet penetration fuels adoption. The rising demand for immersive entertainment and gaming experiences drives demand for 3D-enabled devices. Economic factors like disposable income growth are also fueling market growth, especially in developing economies.
Challenges in the Mobile 3D Market Sector
Challenges include the relatively high cost of 3D-enabled devices compared to their 2D counterparts, which limits market penetration, particularly in price-sensitive markets. The need for high processing power to render 3D content can impact battery life and device performance. Supply chain disruptions can affect component availability and manufacturing costs. The development of compelling 3D content remains a challenge and the lack of standardization across different 3D technologies can create fragmentation in the market.
Emerging Opportunities in Mobile 3D Market
Emerging opportunities lie in the development of more power-efficient 3D technologies, which addresses battery life concerns. Expanding applications beyond entertainment to sectors like education, healthcare, and design offers substantial growth potential. The development of innovative 3D applications tailored for specific demographics or user needs can enhance market penetration. The integration of 3D technology with augmented reality (AR) and virtual reality (VR) creates exciting possibilities.
Leading Players in the Mobile 3D Market Market
- NVidia Corporation
- LG Electronics Inc
- Hitachi Ltd
- Samsung Electronics Co Ltd
- Sharp Corporation
- Apple Inc
- The 3M Company
- Qualcomm Inc
- Intel Corporation
- HTC Corporation
Key Developments in Mobile 3D Market Industry
- January 2023: Asus introduced glass-free 3D OLED technology supporting Spatial Vision, enabling two users simultaneously.
- January 2023: Microsoft and Orbbec launched the Femto Mega 3D camera, utilizing time-of-flight technology.
- March 2023: ZTE launched the nubia pad 3D, offering glass-less 3D visuals with Leia Inc.
Strategic Outlook for Mobile 3D Market Market
The future of the Mobile 3D market looks promising, driven by continuous technological advancements, increasing demand for immersive experiences, and the expansion of 3D applications across various sectors. Companies focusing on innovative display technologies, power efficiency, and user-friendly interfaces are well-positioned to capture market share. The integration of 3D technology with other emerging technologies like AR/VR will unlock new growth avenues and enhance user experiences, leading to substantial market expansion in the coming years.
Mobile 3D Market Segmentation
-
1. 3D Enabled Mobile Devices
- 1.1. Smartphones
- 1.2. Notebooks
- 1.3. Tablets
- 1.4. Eyewear
- 1.5. Other 3D Enabled Devices
-
2. Device Components
- 2.1. Image Sensors
- 2.2. 3D Displays
-
3. 3D Applications
- 3.1. Animations
- 3.2. Maps and Navigation
- 3.3. Mobile Gaming
- 3.4. Mobile Advertisements
- 3.5. Other Applications
Mobile 3D Market Segmentation By Geography
-
1. North America
- 1.1. United States
- 1.2. Canada
-
2. Europe
- 2.1. United Kingdom
- 2.2. Germany
- 2.3. France
- 2.4. Rest of the Europe
-
3. Asia Pacific
- 3.1. China
- 3.2. Japan
- 3.3. India
- 3.4. Rest of the Asia Pacific
- 4. Middle East
- 5. LatinAmerica
Mobile 3D Market REPORT HIGHLIGHTS
| Aspects | Details |
|---|---|
| Study Period | 2019-2033 |
| Base Year | 2024 |
| Estimated Year | 2025 |
| Forecast Period | 2025-2033 |
| Historical Period | 2019-2024 |
| Growth Rate | CAGR of 39.78% from 2019-2033 |
| Segmentation |
|
Table of Contents
- 1. Introduction
- 1.1. Research Scope
- 1.2. Market Segmentation
- 1.3. Research Methodology
- 1.4. Definitions and Assumptions
- 2. Executive Summary
- 2.1. Introduction
- 3. Market Dynamics
- 3.1. Introduction
- 3.2. Market Drivers
- 3.2.1. Rise in Smartphone Usage
- 3.3. Market Restrains
- 3.3.1. High Cost of 3D Devices and Content
- 3.4. Market Trends
- 3.4.1. Gaming Applications are Expected to Account for the Largest Share
- 4. Market Factor Analysis
- 4.1. Porters Five Forces
- 4.2. Supply/Value Chain
- 4.3. PESTEL analysis
- 4.4. Market Entropy
- 4.5. Patent/Trademark Analysis
- 5. Global Mobile 3D Market Analysis, Insights and Forecast, 2019-2031
- 5.1. Market Analysis, Insights and Forecast - by 3D Enabled Mobile Devices
- 5.1.1. Smartphones
- 5.1.2. Notebooks
- 5.1.3. Tablets
- 5.1.4. Eyewear
- 5.1.5. Other 3D Enabled Devices
- 5.2. Market Analysis, Insights and Forecast - by Device Components
- 5.2.1. Image Sensors
- 5.2.2. 3D Displays
- 5.3. Market Analysis, Insights and Forecast - by 3D Applications
- 5.3.1. Animations
- 5.3.2. Maps and Navigation
- 5.3.3. Mobile Gaming
- 5.3.4. Mobile Advertisements
- 5.3.5. Other Applications
- 5.4. Market Analysis, Insights and Forecast - by Region
- 5.4.1. North America
- 5.4.2. Europe
- 5.4.3. Asia Pacific
- 5.4.4. Middle East
- 5.4.5. LatinAmerica
- 5.1. Market Analysis, Insights and Forecast - by 3D Enabled Mobile Devices
- 6. North America Mobile 3D Market Analysis, Insights and Forecast, 2019-2031
- 6.1. Market Analysis, Insights and Forecast - by 3D Enabled Mobile Devices
- 6.1.1. Smartphones
- 6.1.2. Notebooks
- 6.1.3. Tablets
- 6.1.4. Eyewear
- 6.1.5. Other 3D Enabled Devices
- 6.2. Market Analysis, Insights and Forecast - by Device Components
- 6.2.1. Image Sensors
- 6.2.2. 3D Displays
- 6.3. Market Analysis, Insights and Forecast - by 3D Applications
- 6.3.1. Animations
- 6.3.2. Maps and Navigation
- 6.3.3. Mobile Gaming
- 6.3.4. Mobile Advertisements
- 6.3.5. Other Applications
- 6.1. Market Analysis, Insights and Forecast - by 3D Enabled Mobile Devices
- 7. Europe Mobile 3D Market Analysis, Insights and Forecast, 2019-2031
- 7.1. Market Analysis, Insights and Forecast - by 3D Enabled Mobile Devices
- 7.1.1. Smartphones
- 7.1.2. Notebooks
- 7.1.3. Tablets
- 7.1.4. Eyewear
- 7.1.5. Other 3D Enabled Devices
- 7.2. Market Analysis, Insights and Forecast - by Device Components
- 7.2.1. Image Sensors
- 7.2.2. 3D Displays
- 7.3. Market Analysis, Insights and Forecast - by 3D Applications
- 7.3.1. Animations
- 7.3.2. Maps and Navigation
- 7.3.3. Mobile Gaming
- 7.3.4. Mobile Advertisements
- 7.3.5. Other Applications
- 7.1. Market Analysis, Insights and Forecast - by 3D Enabled Mobile Devices
- 8. Asia Pacific Mobile 3D Market Analysis, Insights and Forecast, 2019-2031
- 8.1. Market Analysis, Insights and Forecast - by 3D Enabled Mobile Devices
- 8.1.1. Smartphones
- 8.1.2. Notebooks
- 8.1.3. Tablets
- 8.1.4. Eyewear
- 8.1.5. Other 3D Enabled Devices
- 8.2. Market Analysis, Insights and Forecast - by Device Components
- 8.2.1. Image Sensors
- 8.2.2. 3D Displays
- 8.3. Market Analysis, Insights and Forecast - by 3D Applications
- 8.3.1. Animations
- 8.3.2. Maps and Navigation
- 8.3.3. Mobile Gaming
- 8.3.4. Mobile Advertisements
- 8.3.5. Other Applications
- 8.1. Market Analysis, Insights and Forecast - by 3D Enabled Mobile Devices
- 9. Middle East Mobile 3D Market Analysis, Insights and Forecast, 2019-2031
- 9.1. Market Analysis, Insights and Forecast - by 3D Enabled Mobile Devices
- 9.1.1. Smartphones
- 9.1.2. Notebooks
- 9.1.3. Tablets
- 9.1.4. Eyewear
- 9.1.5. Other 3D Enabled Devices
- 9.2. Market Analysis, Insights and Forecast - by Device Components
- 9.2.1. Image Sensors
- 9.2.2. 3D Displays
- 9.3. Market Analysis, Insights and Forecast - by 3D Applications
- 9.3.1. Animations
- 9.3.2. Maps and Navigation
- 9.3.3. Mobile Gaming
- 9.3.4. Mobile Advertisements
- 9.3.5. Other Applications
- 9.1. Market Analysis, Insights and Forecast - by 3D Enabled Mobile Devices
- 10. LatinAmerica Mobile 3D Market Analysis, Insights and Forecast, 2019-2031
- 10.1. Market Analysis, Insights and Forecast - by 3D Enabled Mobile Devices
- 10.1.1. Smartphones
- 10.1.2. Notebooks
- 10.1.3. Tablets
- 10.1.4. Eyewear
- 10.1.5. Other 3D Enabled Devices
- 10.2. Market Analysis, Insights and Forecast - by Device Components
- 10.2.1. Image Sensors
- 10.2.2. 3D Displays
- 10.3. Market Analysis, Insights and Forecast - by 3D Applications
- 10.3.1. Animations
- 10.3.2. Maps and Navigation
- 10.3.3. Mobile Gaming
- 10.3.4. Mobile Advertisements
- 10.3.5. Other Applications
- 10.1. Market Analysis, Insights and Forecast - by 3D Enabled Mobile Devices
- 11. North America Mobile 3D Market Analysis, Insights and Forecast, 2019-2031
- 11.1. Market Analysis, Insights and Forecast - By Country/Sub-region
- 11.1.1 United States
- 11.1.2 Canada
- 11.1.3 Mexico
- 12. Europe Mobile 3D Market Analysis, Insights and Forecast, 2019-2031
- 12.1. Market Analysis, Insights and Forecast - By Country/Sub-region
- 12.1.1 Germany
- 12.1.2 United Kingdom
- 12.1.3 France
- 12.1.4 Spain
- 12.1.5 Italy
- 12.1.6 Spain
- 12.1.7 Belgium
- 12.1.8 Netherland
- 12.1.9 Nordics
- 12.1.10 Rest of Europe
- 13. Asia Pacific Mobile 3D Market Analysis, Insights and Forecast, 2019-2031
- 13.1. Market Analysis, Insights and Forecast - By Country/Sub-region
- 13.1.1 China
- 13.1.2 Japan
- 13.1.3 India
- 13.1.4 South Korea
- 13.1.5 Southeast Asia
- 13.1.6 Australia
- 13.1.7 Indonesia
- 13.1.8 Phillipes
- 13.1.9 Singapore
- 13.1.10 Thailandc
- 13.1.11 Rest of Asia Pacific
- 14. South America Mobile 3D Market Analysis, Insights and Forecast, 2019-2031
- 14.1. Market Analysis, Insights and Forecast - By Country/Sub-region
- 14.1.1 Brazil
- 14.1.2 Argentina
- 14.1.3 Peru
- 14.1.4 Chile
- 14.1.5 Colombia
- 14.1.6 Ecuador
- 14.1.7 Venezuela
- 14.1.8 Rest of South America
- 15. North America Mobile 3D Market Analysis, Insights and Forecast, 2019-2031
- 15.1. Market Analysis, Insights and Forecast - By Country/Sub-region
- 15.1.1 United States
- 15.1.2 Canada
- 15.1.3 Mexico
- 16. MEA Mobile 3D Market Analysis, Insights and Forecast, 2019-2031
- 16.1. Market Analysis, Insights and Forecast - By Country/Sub-region
- 16.1.1 United Arab Emirates
- 16.1.2 Saudi Arabia
- 16.1.3 South Africa
- 16.1.4 Rest of Middle East and Africa
- 17. Competitive Analysis
- 17.1. Global Market Share Analysis 2024
- 17.2. Company Profiles
- 17.2.1 NVidia Corporation
- 17.2.1.1. Overview
- 17.2.1.2. Products
- 17.2.1.3. SWOT Analysis
- 17.2.1.4. Recent Developments
- 17.2.1.5. Financials (Based on Availability)
- 17.2.2 LG Electronics Inc
- 17.2.2.1. Overview
- 17.2.2.2. Products
- 17.2.2.3. SWOT Analysis
- 17.2.2.4. Recent Developments
- 17.2.2.5. Financials (Based on Availability)
- 17.2.3 Hitachi Ltd
- 17.2.3.1. Overview
- 17.2.3.2. Products
- 17.2.3.3. SWOT Analysis
- 17.2.3.4. Recent Developments
- 17.2.3.5. Financials (Based on Availability)
- 17.2.4 Samsung Electronics Co Ltd
- 17.2.4.1. Overview
- 17.2.4.2. Products
- 17.2.4.3. SWOT Analysis
- 17.2.4.4. Recent Developments
- 17.2.4.5. Financials (Based on Availability)
- 17.2.5 Sharp Corporation
- 17.2.5.1. Overview
- 17.2.5.2. Products
- 17.2.5.3. SWOT Analysis
- 17.2.5.4. Recent Developments
- 17.2.5.5. Financials (Based on Availability)
- 17.2.6 Apple Inc
- 17.2.6.1. Overview
- 17.2.6.2. Products
- 17.2.6.3. SWOT Analysis
- 17.2.6.4. Recent Developments
- 17.2.6.5. Financials (Based on Availability)
- 17.2.7 The 3M Company
- 17.2.7.1. Overview
- 17.2.7.2. Products
- 17.2.7.3. SWOT Analysis
- 17.2.7.4. Recent Developments
- 17.2.7.5. Financials (Based on Availability)
- 17.2.8 Qualcomm Inc *List Not Exhaustive
- 17.2.8.1. Overview
- 17.2.8.2. Products
- 17.2.8.3. SWOT Analysis
- 17.2.8.4. Recent Developments
- 17.2.8.5. Financials (Based on Availability)
- 17.2.9 Intel Corporation
- 17.2.9.1. Overview
- 17.2.9.2. Products
- 17.2.9.3. SWOT Analysis
- 17.2.9.4. Recent Developments
- 17.2.9.5. Financials (Based on Availability)
- 17.2.10 HTC Corporation
- 17.2.10.1. Overview
- 17.2.10.2. Products
- 17.2.10.3. SWOT Analysis
- 17.2.10.4. Recent Developments
- 17.2.10.5. Financials (Based on Availability)
- 17.2.1 NVidia Corporation
List of Figures
- Figure 1: Global Mobile 3D Market Revenue Breakdown (Million, %) by Region 2024 & 2032
- Figure 2: North America Mobile 3D Market Revenue (Million), by Country 2024 & 2032
- Figure 3: North America Mobile 3D Market Revenue Share (%), by Country 2024 & 2032
- Figure 4: Europe Mobile 3D Market Revenue (Million), by Country 2024 & 2032
- Figure 5: Europe Mobile 3D Market Revenue Share (%), by Country 2024 & 2032
- Figure 6: Asia Pacific Mobile 3D Market Revenue (Million), by Country 2024 & 2032
- Figure 7: Asia Pacific Mobile 3D Market Revenue Share (%), by Country 2024 & 2032
- Figure 8: South America Mobile 3D Market Revenue (Million), by Country 2024 & 2032
- Figure 9: South America Mobile 3D Market Revenue Share (%), by Country 2024 & 2032
- Figure 10: North America Mobile 3D Market Revenue (Million), by Country 2024 & 2032
- Figure 11: North America Mobile 3D Market Revenue Share (%), by Country 2024 & 2032
- Figure 12: MEA Mobile 3D Market Revenue (Million), by Country 2024 & 2032
- Figure 13: MEA Mobile 3D Market Revenue Share (%), by Country 2024 & 2032
- Figure 14: North America Mobile 3D Market Revenue (Million), by 3D Enabled Mobile Devices 2024 & 2032
- Figure 15: North America Mobile 3D Market Revenue Share (%), by 3D Enabled Mobile Devices 2024 & 2032
- Figure 16: North America Mobile 3D Market Revenue (Million), by Device Components 2024 & 2032
- Figure 17: North America Mobile 3D Market Revenue Share (%), by Device Components 2024 & 2032
- Figure 18: North America Mobile 3D Market Revenue (Million), by 3D Applications 2024 & 2032
- Figure 19: North America Mobile 3D Market Revenue Share (%), by 3D Applications 2024 & 2032
- Figure 20: North America Mobile 3D Market Revenue (Million), by Country 2024 & 2032
- Figure 21: North America Mobile 3D Market Revenue Share (%), by Country 2024 & 2032
- Figure 22: Europe Mobile 3D Market Revenue (Million), by 3D Enabled Mobile Devices 2024 & 2032
- Figure 23: Europe Mobile 3D Market Revenue Share (%), by 3D Enabled Mobile Devices 2024 & 2032
- Figure 24: Europe Mobile 3D Market Revenue (Million), by Device Components 2024 & 2032
- Figure 25: Europe Mobile 3D Market Revenue Share (%), by Device Components 2024 & 2032
- Figure 26: Europe Mobile 3D Market Revenue (Million), by 3D Applications 2024 & 2032
- Figure 27: Europe Mobile 3D Market Revenue Share (%), by 3D Applications 2024 & 2032
- Figure 28: Europe Mobile 3D Market Revenue (Million), by Country 2024 & 2032
- Figure 29: Europe Mobile 3D Market Revenue Share (%), by Country 2024 & 2032
- Figure 30: Asia Pacific Mobile 3D Market Revenue (Million), by 3D Enabled Mobile Devices 2024 & 2032
- Figure 31: Asia Pacific Mobile 3D Market Revenue Share (%), by 3D Enabled Mobile Devices 2024 & 2032
- Figure 32: Asia Pacific Mobile 3D Market Revenue (Million), by Device Components 2024 & 2032
- Figure 33: Asia Pacific Mobile 3D Market Revenue Share (%), by Device Components 2024 & 2032
- Figure 34: Asia Pacific Mobile 3D Market Revenue (Million), by 3D Applications 2024 & 2032
- Figure 35: Asia Pacific Mobile 3D Market Revenue Share (%), by 3D Applications 2024 & 2032
- Figure 36: Asia Pacific Mobile 3D Market Revenue (Million), by Country 2024 & 2032
- Figure 37: Asia Pacific Mobile 3D Market Revenue Share (%), by Country 2024 & 2032
- Figure 38: Middle East Mobile 3D Market Revenue (Million), by 3D Enabled Mobile Devices 2024 & 2032
- Figure 39: Middle East Mobile 3D Market Revenue Share (%), by 3D Enabled Mobile Devices 2024 & 2032
- Figure 40: Middle East Mobile 3D Market Revenue (Million), by Device Components 2024 & 2032
- Figure 41: Middle East Mobile 3D Market Revenue Share (%), by Device Components 2024 & 2032
- Figure 42: Middle East Mobile 3D Market Revenue (Million), by 3D Applications 2024 & 2032
- Figure 43: Middle East Mobile 3D Market Revenue Share (%), by 3D Applications 2024 & 2032
- Figure 44: Middle East Mobile 3D Market Revenue (Million), by Country 2024 & 2032
- Figure 45: Middle East Mobile 3D Market Revenue Share (%), by Country 2024 & 2032
- Figure 46: LatinAmerica Mobile 3D Market Revenue (Million), by 3D Enabled Mobile Devices 2024 & 2032
- Figure 47: LatinAmerica Mobile 3D Market Revenue Share (%), by 3D Enabled Mobile Devices 2024 & 2032
- Figure 48: LatinAmerica Mobile 3D Market Revenue (Million), by Device Components 2024 & 2032
- Figure 49: LatinAmerica Mobile 3D Market Revenue Share (%), by Device Components 2024 & 2032
- Figure 50: LatinAmerica Mobile 3D Market Revenue (Million), by 3D Applications 2024 & 2032
- Figure 51: LatinAmerica Mobile 3D Market Revenue Share (%), by 3D Applications 2024 & 2032
- Figure 52: LatinAmerica Mobile 3D Market Revenue (Million), by Country 2024 & 2032
- Figure 53: LatinAmerica Mobile 3D Market Revenue Share (%), by Country 2024 & 2032
List of Tables
- Table 1: Global Mobile 3D Market Revenue Million Forecast, by Region 2019 & 2032
- Table 2: Global Mobile 3D Market Revenue Million Forecast, by 3D Enabled Mobile Devices 2019 & 2032
- Table 3: Global Mobile 3D Market Revenue Million Forecast, by Device Components 2019 & 2032
- Table 4: Global Mobile 3D Market Revenue Million Forecast, by 3D Applications 2019 & 2032
- Table 5: Global Mobile 3D Market Revenue Million Forecast, by Region 2019 & 2032
- Table 6: Global Mobile 3D Market Revenue Million Forecast, by Country 2019 & 2032
- Table 7: United States Mobile 3D Market Revenue (Million) Forecast, by Application 2019 & 2032
- Table 8: Canada Mobile 3D Market Revenue (Million) Forecast, by Application 2019 & 2032
- Table 9: Mexico Mobile 3D Market Revenue (Million) Forecast, by Application 2019 & 2032
- Table 10: Global Mobile 3D Market Revenue Million Forecast, by Country 2019 & 2032
- Table 11: Germany Mobile 3D Market Revenue (Million) Forecast, by Application 2019 & 2032
- Table 12: United Kingdom Mobile 3D Market Revenue (Million) Forecast, by Application 2019 & 2032
- Table 13: France Mobile 3D Market Revenue (Million) Forecast, by Application 2019 & 2032
- Table 14: Spain Mobile 3D Market Revenue (Million) Forecast, by Application 2019 & 2032
- Table 15: Italy Mobile 3D Market Revenue (Million) Forecast, by Application 2019 & 2032
- Table 16: Spain Mobile 3D Market Revenue (Million) Forecast, by Application 2019 & 2032
- Table 17: Belgium Mobile 3D Market Revenue (Million) Forecast, by Application 2019 & 2032
- Table 18: Netherland Mobile 3D Market Revenue (Million) Forecast, by Application 2019 & 2032
- Table 19: Nordics Mobile 3D Market Revenue (Million) Forecast, by Application 2019 & 2032
- Table 20: Rest of Europe Mobile 3D Market Revenue (Million) Forecast, by Application 2019 & 2032
- Table 21: Global Mobile 3D Market Revenue Million Forecast, by Country 2019 & 2032
- Table 22: China Mobile 3D Market Revenue (Million) Forecast, by Application 2019 & 2032
- Table 23: Japan Mobile 3D Market Revenue (Million) Forecast, by Application 2019 & 2032
- Table 24: India Mobile 3D Market Revenue (Million) Forecast, by Application 2019 & 2032
- Table 25: South Korea Mobile 3D Market Revenue (Million) Forecast, by Application 2019 & 2032
- Table 26: Southeast Asia Mobile 3D Market Revenue (Million) Forecast, by Application 2019 & 2032
- Table 27: Australia Mobile 3D Market Revenue (Million) Forecast, by Application 2019 & 2032
- Table 28: Indonesia Mobile 3D Market Revenue (Million) Forecast, by Application 2019 & 2032
- Table 29: Phillipes Mobile 3D Market Revenue (Million) Forecast, by Application 2019 & 2032
- Table 30: Singapore Mobile 3D Market Revenue (Million) Forecast, by Application 2019 & 2032
- Table 31: Thailandc Mobile 3D Market Revenue (Million) Forecast, by Application 2019 & 2032
- Table 32: Rest of Asia Pacific Mobile 3D Market Revenue (Million) Forecast, by Application 2019 & 2032
- Table 33: Global Mobile 3D Market Revenue Million Forecast, by Country 2019 & 2032
- Table 34: Brazil Mobile 3D Market Revenue (Million) Forecast, by Application 2019 & 2032
- Table 35: Argentina Mobile 3D Market Revenue (Million) Forecast, by Application 2019 & 2032
- Table 36: Peru Mobile 3D Market Revenue (Million) Forecast, by Application 2019 & 2032
- Table 37: Chile Mobile 3D Market Revenue (Million) Forecast, by Application 2019 & 2032
- Table 38: Colombia Mobile 3D Market Revenue (Million) Forecast, by Application 2019 & 2032
- Table 39: Ecuador Mobile 3D Market Revenue (Million) Forecast, by Application 2019 & 2032
- Table 40: Venezuela Mobile 3D Market Revenue (Million) Forecast, by Application 2019 & 2032
- Table 41: Rest of South America Mobile 3D Market Revenue (Million) Forecast, by Application 2019 & 2032
- Table 42: Global Mobile 3D Market Revenue Million Forecast, by Country 2019 & 2032
- Table 43: United States Mobile 3D Market Revenue (Million) Forecast, by Application 2019 & 2032
- Table 44: Canada Mobile 3D Market Revenue (Million) Forecast, by Application 2019 & 2032
- Table 45: Mexico Mobile 3D Market Revenue (Million) Forecast, by Application 2019 & 2032
- Table 46: Global Mobile 3D Market Revenue Million Forecast, by Country 2019 & 2032
- Table 47: United Arab Emirates Mobile 3D Market Revenue (Million) Forecast, by Application 2019 & 2032
- Table 48: Saudi Arabia Mobile 3D Market Revenue (Million) Forecast, by Application 2019 & 2032
- Table 49: South Africa Mobile 3D Market Revenue (Million) Forecast, by Application 2019 & 2032
- Table 50: Rest of Middle East and Africa Mobile 3D Market Revenue (Million) Forecast, by Application 2019 & 2032
- Table 51: Global Mobile 3D Market Revenue Million Forecast, by 3D Enabled Mobile Devices 2019 & 2032
- Table 52: Global Mobile 3D Market Revenue Million Forecast, by Device Components 2019 & 2032
- Table 53: Global Mobile 3D Market Revenue Million Forecast, by 3D Applications 2019 & 2032
- Table 54: Global Mobile 3D Market Revenue Million Forecast, by Country 2019 & 2032
- Table 55: United States Mobile 3D Market Revenue (Million) Forecast, by Application 2019 & 2032
- Table 56: Canada Mobile 3D Market Revenue (Million) Forecast, by Application 2019 & 2032
- Table 57: Global Mobile 3D Market Revenue Million Forecast, by 3D Enabled Mobile Devices 2019 & 2032
- Table 58: Global Mobile 3D Market Revenue Million Forecast, by Device Components 2019 & 2032
- Table 59: Global Mobile 3D Market Revenue Million Forecast, by 3D Applications 2019 & 2032
- Table 60: Global Mobile 3D Market Revenue Million Forecast, by Country 2019 & 2032
- Table 61: United Kingdom Mobile 3D Market Revenue (Million) Forecast, by Application 2019 & 2032
- Table 62: Germany Mobile 3D Market Revenue (Million) Forecast, by Application 2019 & 2032
- Table 63: France Mobile 3D Market Revenue (Million) Forecast, by Application 2019 & 2032
- Table 64: Rest of the Europe Mobile 3D Market Revenue (Million) Forecast, by Application 2019 & 2032
- Table 65: Global Mobile 3D Market Revenue Million Forecast, by 3D Enabled Mobile Devices 2019 & 2032
- Table 66: Global Mobile 3D Market Revenue Million Forecast, by Device Components 2019 & 2032
- Table 67: Global Mobile 3D Market Revenue Million Forecast, by 3D Applications 2019 & 2032
- Table 68: Global Mobile 3D Market Revenue Million Forecast, by Country 2019 & 2032
- Table 69: China Mobile 3D Market Revenue (Million) Forecast, by Application 2019 & 2032
- Table 70: Japan Mobile 3D Market Revenue (Million) Forecast, by Application 2019 & 2032
- Table 71: India Mobile 3D Market Revenue (Million) Forecast, by Application 2019 & 2032
- Table 72: Rest of the Asia Pacific Mobile 3D Market Revenue (Million) Forecast, by Application 2019 & 2032
- Table 73: Global Mobile 3D Market Revenue Million Forecast, by 3D Enabled Mobile Devices 2019 & 2032
- Table 74: Global Mobile 3D Market Revenue Million Forecast, by Device Components 2019 & 2032
- Table 75: Global Mobile 3D Market Revenue Million Forecast, by 3D Applications 2019 & 2032
- Table 76: Global Mobile 3D Market Revenue Million Forecast, by Country 2019 & 2032
- Table 77: Global Mobile 3D Market Revenue Million Forecast, by 3D Enabled Mobile Devices 2019 & 2032
- Table 78: Global Mobile 3D Market Revenue Million Forecast, by Device Components 2019 & 2032
- Table 79: Global Mobile 3D Market Revenue Million Forecast, by 3D Applications 2019 & 2032
- Table 80: Global Mobile 3D Market Revenue Million Forecast, by Country 2019 & 2032
Frequently Asked Questions
1. What is the projected Compound Annual Growth Rate (CAGR) of the Mobile 3D Market?
The projected CAGR is approximately 39.78%.
2. Which companies are prominent players in the Mobile 3D Market?
Key companies in the market include NVidia Corporation, LG Electronics Inc, Hitachi Ltd, Samsung Electronics Co Ltd, Sharp Corporation, Apple Inc, The 3M Company, Qualcomm Inc *List Not Exhaustive, Intel Corporation, HTC Corporation.
3. What are the main segments of the Mobile 3D Market?
The market segments include 3D Enabled Mobile Devices, Device Components, 3D Applications.
4. Can you provide details about the market size?
The market size is estimated to be USD 42.90 Million as of 2022.
5. What are some drivers contributing to market growth?
Rise in Smartphone Usage.
6. What are the notable trends driving market growth?
Gaming Applications are Expected to Account for the Largest Share.
7. Are there any restraints impacting market growth?
High Cost of 3D Devices and Content.
8. Can you provide examples of recent developments in the market?
March 2023 - ZTE launched nubia pad 3D, which offers glass-less 3D visuals. The product is the combined effort of Leia Inc and ZTE. The tablet can display native 3D content and convert 2D content into 3D in real-time. Leia will also provide pre-installed 3D games and educational apps. The tablet runs on Andriod 13 OS, and Snapdragon 888 SoC is used for faster processing.
9. What pricing options are available for accessing the report?
Pricing options include single-user, multi-user, and enterprise licenses priced at USD 4750, USD 5250, and USD 8750 respectively.
10. Is the market size provided in terms of value or volume?
The market size is provided in terms of value, measured in Million.
11. Are there any specific market keywords associated with the report?
Yes, the market keyword associated with the report is "Mobile 3D Market," which aids in identifying and referencing the specific market segment covered.
12. How do I determine which pricing option suits my needs best?
The pricing options vary based on user requirements and access needs. Individual users may opt for single-user licenses, while businesses requiring broader access may choose multi-user or enterprise licenses for cost-effective access to the report.
13. Are there any additional resources or data provided in the Mobile 3D Market report?
While the report offers comprehensive insights, it's advisable to review the specific contents or supplementary materials provided to ascertain if additional resources or data are available.
14. How can I stay updated on further developments or reports in the Mobile 3D Market?
To stay informed about further developments, trends, and reports in the Mobile 3D Market, consider subscribing to industry newsletters, following relevant companies and organizations, or regularly checking reputable industry news sources and publications.
Methodology
Step 1 - Identification of Relevant Samples Size from Population Database


Step 2 - Approaches for Defining Global Market Size (Value, Volume* & Price*)

Note*: In applicable scenarios
Step 3 - Data Sources
Primary Research
- Web Analytics
- Survey Reports
- Research Institute
- Latest Research Reports
- Opinion Leaders
Secondary Research
- Annual Reports
- White Paper
- Latest Press Release
- Industry Association
- Paid Database
- Investor Presentations

Step 4 - Data Triangulation
Involves using different sources of information in order to increase the validity of a study
These sources are likely to be stakeholders in a program - participants, other researchers, program staff, other community members, and so on.
Then we put all data in single framework & apply various statistical tools to find out the dynamic on the market.
During the analysis stage, feedback from the stakeholder groups would be compared to determine areas of agreement as well as areas of divergence


