
Key Insights
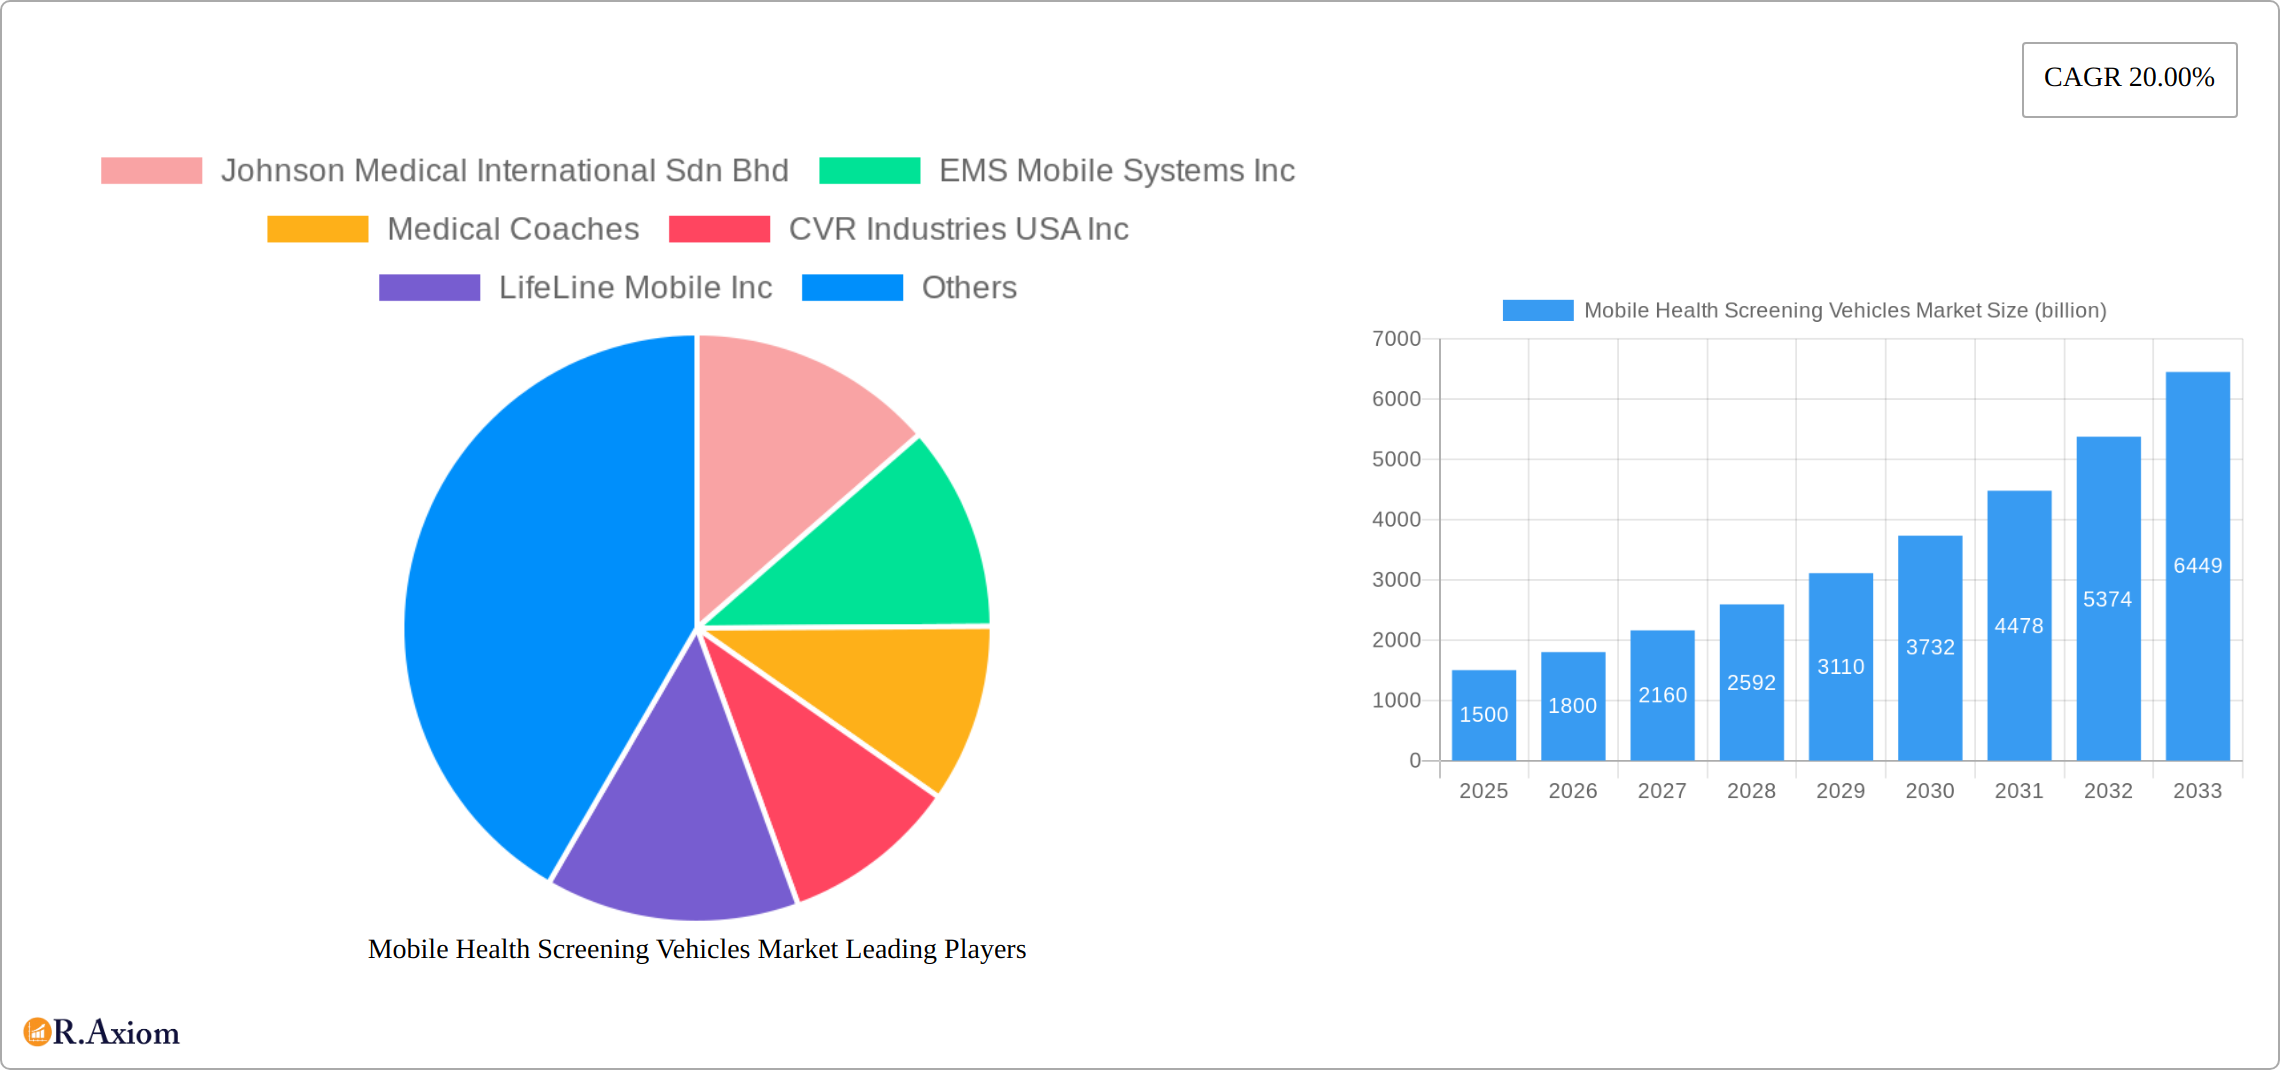
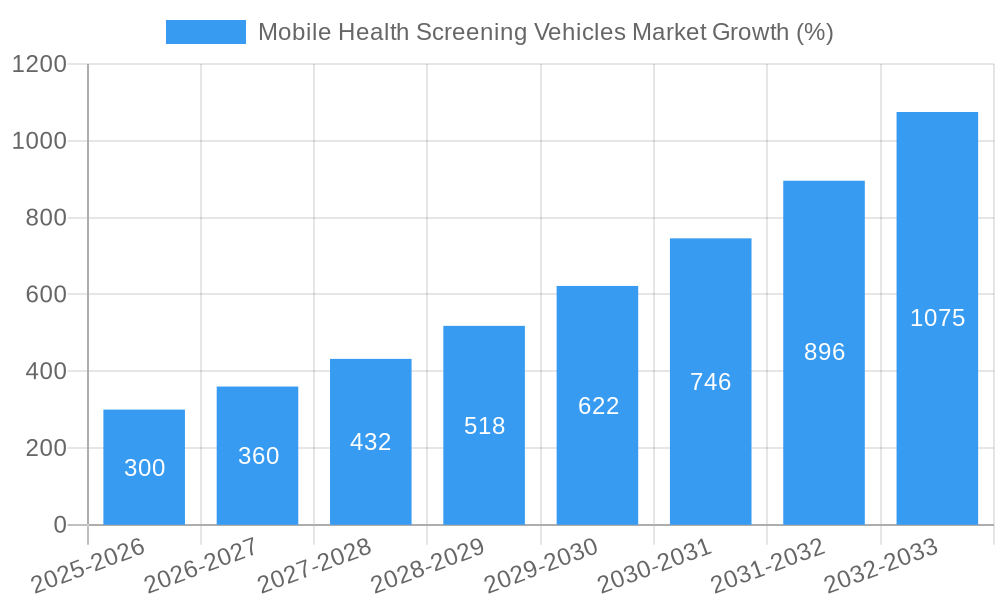
The mobile health screening vehicles market is experiencing robust growth, driven by increasing demand for accessible and convenient healthcare services, particularly in underserved and remote areas. The market's Compound Annual Growth Rate (CAGR) of 20% from 2019 to 2024 indicates a significant upward trajectory, projected to continue through 2033. Key drivers include rising prevalence of chronic diseases necessitating regular screenings, advancements in mobile medical technology enabling sophisticated diagnostics within mobile units, and government initiatives promoting preventative healthcare and outreach programs. The market segmentation reveals strong demand across various clinic types, with emergency care, maternal health, and geriatric care segments leading the way. Different vehicle types, including mobile medical vans and buses, cater to diverse needs and geographical constraints. While the initial investment in mobile units can be substantial, the long-term return on investment is attractive, particularly considering potential cost savings from reduced hospitalizations and improved early disease detection. The market is geographically diverse, with North America and Europe currently holding significant shares, but the Asia-Pacific region is poised for substantial growth, fueled by expanding healthcare infrastructure and increasing disposable incomes. Competition among manufacturers is keen, with companies focusing on innovation, technological integration, and strategic partnerships to gain market share. Future growth will be shaped by technological advancements in telemedicine integration, AI-driven diagnostics, and the development of specialized mobile units tailored to specific healthcare needs.
The market's success hinges on overcoming challenges such as regulatory hurdles in deploying mobile units, ensuring efficient logistics and maintenance, and addressing data security and privacy concerns related to patient information collected in mobile settings. Strategic partnerships between healthcare providers, technology companies, and government agencies will be crucial in overcoming these obstacles. The continued focus on preventive healthcare, combined with advancements in miniaturization and affordability of medical equipment, will drive demand for smaller, more specialized mobile units designed for niche applications. The market's growth is further fueled by a growing awareness of the importance of proactive healthcare management among individuals and communities. This proactive approach, combined with technological advancements, positions the mobile health screening vehicles market for continued expansion and significant contribution to improving healthcare accessibility worldwide.
Mobile Health Screening Vehicles Market: A Comprehensive Report (2019-2033)
This detailed report provides a comprehensive analysis of the global Mobile Health Screening Vehicles Market, offering valuable insights for industry stakeholders, investors, and strategic decision-makers. The report covers the period from 2019 to 2033, with a base year of 2025 and a forecast period of 2025-2033. The market is valued at $xx billion in 2025 and is projected to reach $xx billion by 2033, exhibiting a CAGR of xx%.
Mobile Health Screening Vehicles Market Market Concentration & Innovation
The Mobile Health Screening Vehicles market exhibits a moderately concentrated landscape, with a few key players holding significant market share. Johnson Medical International Sdn Bhd, EMS Mobile Systems Inc, and Medical Coaches are among the leading companies, together accounting for approximately xx% of the market share in 2025. However, several smaller companies and specialized converters also contribute significantly to the market's dynamism.
Innovation Drivers: Technological advancements such as telemedicine integration, advanced diagnostic equipment miniaturization, and improved vehicle design are driving market growth. Regulatory approvals for new medical technologies used within mobile units are also crucial.
Regulatory Frameworks: Stringent regulatory compliance regarding medical device approvals and operational safety standards significantly impact market entry and product development. Variations in regulatory landscapes across different geographies present both challenges and opportunities.
Product Substitutes: While mobile screening vehicles offer unique advantages in accessibility, stationary clinics and home healthcare services remain potential substitutes, although with limitations in reach and convenience.
End-User Trends: Increasing demand for accessible healthcare services, especially in underserved rural and remote areas, is fueling market growth. A growing elderly population also contributes significantly to the demand for mobile health solutions.
M&A Activities: The market has witnessed a moderate level of M&A activity in recent years, with deal values ranging from $xx billion to $xx billion. These acquisitions often involve consolidation of market share, expansion into new geographical regions, and access to innovative technologies. For example, (insert specific M&A example if data is available, otherwise replace with a general statement like "Several smaller acquisitions have occurred, focusing on enhancing technological capabilities and geographic reach.").
Mobile Health Screening Vehicles Market Industry Trends & Insights
The Mobile Health Screening Vehicles market is experiencing robust growth, driven by several key factors. The increasing prevalence of chronic diseases and the rising demand for preventive healthcare are major contributors. Technological advancements are continuously improving the efficiency and capabilities of mobile health screening units, leading to wider adoption. Furthermore, government initiatives promoting healthcare accessibility in underserved areas, coupled with favorable reimbursement policies in some regions, are further accelerating market expansion.
Consumer preferences are shifting towards convenient and accessible healthcare options, favoring mobile clinics over traditional healthcare settings. The competitive landscape is dynamic, with established players focusing on product innovation and expansion while new entrants leverage technological advancements to gain market share. The market penetration of mobile health screening vehicles is increasing gradually, particularly in developed and developing countries with significant rural populations.
Dominant Markets & Segments in Mobile Health Screening Vehicles Market
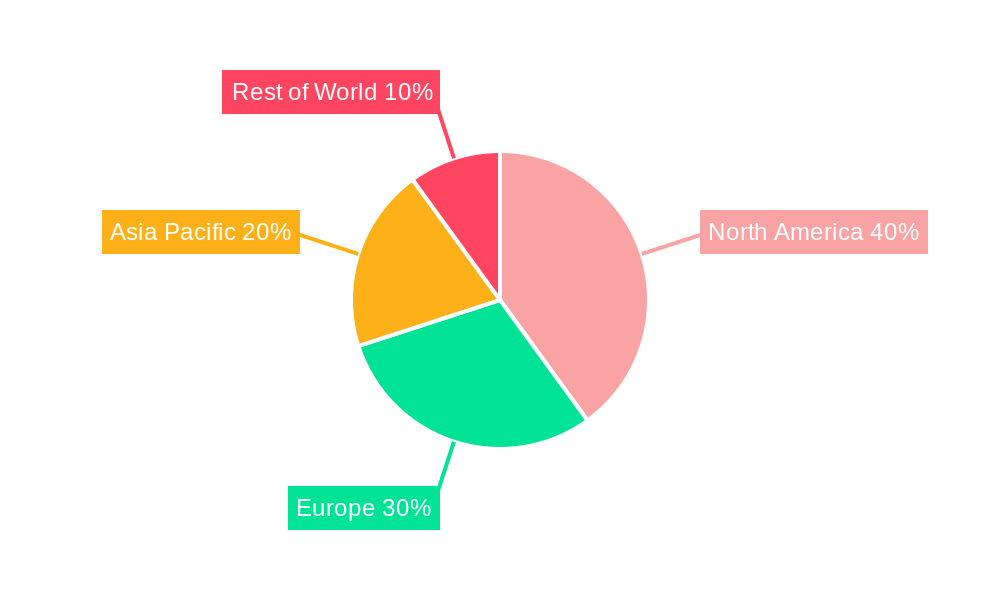
Leading Region/Country: North America currently holds the largest market share, followed by Europe. This dominance is attributed to factors like robust healthcare infrastructure, high healthcare expenditure, and a large aging population. However, developing economies in Asia-Pacific are experiencing rapid market growth due to increasing healthcare investments and rising awareness of preventative healthcare.
Dominant Segments:
- Design Layout: The Double Exam Room segment holds the largest market share due to its balance of cost-effectiveness and enhanced operational efficiency.
- Clinic Type: Diagnostic/screening services are the dominant segment, driven by the increasing demand for early disease detection and preventative care.
- Vehicle Type: Mobile Medical Vans currently dominate, owing to their versatility and cost-effectiveness.
Key Drivers for Dominant Segments:
- North America: High healthcare expenditure, established healthcare infrastructure, and a focus on preventative healthcare.
- Asia-Pacific: Rising disposable incomes, government initiatives to improve healthcare access in rural areas, and a large population base.
- Double Exam Room: Balance between operational efficiency and cost considerations.
- Diagnostic/Screening: Growing awareness of preventative healthcare and the demand for early disease detection.
- Mobile Medical Vans: Cost-effectiveness, versatility, and adaptability to diverse healthcare needs.
Mobile Health Screening Vehicles Market Product Developments
Recent product innovations in the mobile health screening vehicles market focus on incorporating advanced diagnostic technologies, telemedicine capabilities, and improved vehicle designs for enhanced operational efficiency and patient comfort. Manufacturers are emphasizing compact, lightweight equipment and user-friendly interfaces to simplify operations and minimize space requirements. The integration of electronic health records (EHR) systems enables seamless data management and improves healthcare coordination. This trend toward technological integration and enhanced patient experience strengthens the market's competitive landscape.
Report Scope & Segmentation Analysis
This report segments the Mobile Health Screening Vehicles market by Design Layout (Single Exam Room, Double Exam Room, Triple Exam Room), Clinic Type (Emergency Care, Maternal Health, ICU and Surgery, Infant and Neonatal Health, Geriatric Care, Diagnostic/screening, Others), and Vehicle Type (Mobile Medical Vans, Mobile Medical Bus, Others). Each segment is analyzed based on historical data (2019-2024), current market size (2025), and future projections (2025-2033). Competitive dynamics within each segment are also explored, highlighting key players and their strategies.
Growth projections vary significantly across different segments. The Diagnostic/screening clinic type segment and the Double Exam Room design layout are projected to experience the highest growth rates over the forecast period. The Mobile Medical Vans segment dominates the Vehicle Type segment but faces increasing competition from specialized vehicles adapted for specific healthcare needs.
Key Drivers of Mobile Health Screening Vehicles Market Growth
Several factors contribute to the market's growth. Technological advancements, such as miniaturized medical equipment and telemedicine integration, improve the efficiency and capabilities of mobile health units. Government initiatives aimed at expanding healthcare access in underserved areas and rising healthcare expenditure in developed and developing economies further propel market expansion. Favorable regulatory environments and increasing insurance coverage for mobile healthcare services also stimulate market growth.
Challenges in the Mobile Health Screening Vehicles Market Sector
The Mobile Health Screening Vehicles market faces several challenges. High initial investment costs and operational expenses can hinder market entry for smaller companies. Maintaining regulatory compliance across different jurisdictions presents a significant hurdle. Supply chain disruptions can impact the availability of critical components, particularly during periods of increased demand. Furthermore, intense competition from established players can limit profitability for new market entrants. These factors collectively impact overall market growth and profitability.
Emerging Opportunities in Mobile Health Screening Vehicles Market
Several promising opportunities exist. The integration of artificial intelligence (AI) and machine learning (ML) for improved diagnostics and remote patient monitoring is a key area. Expansion into new geographical markets, particularly in developing countries with significant unmet healthcare needs, presents considerable potential. The development of specialized mobile clinics catering to niche healthcare segments such as mental health and oncology also presents promising opportunities.
Leading Players in the Mobile Health Screening Vehicles Market Market
- Johnson Medical International Sdn Bhd
- EMS Mobile Systems Inc
- Medical Coaches
- CVR Industries USA Inc
- LifeLine Mobile Inc
- Farber Specialty Vehicles
- MinFound Medical Systems Co Ltd
- Matthews Specialty Vehicles
- ADI Mobile Health
- Odulair LLC
Key Developments in Mobile Health Screening Vehicles Market Industry
- July 2022: Aster DM Foundation launched Aster Volunteers Mobile Medical Clinic in Barmer, Rajasthan, India.
- February 2022: Mayo Clinic Health System's mobile health clinic reached its 1,000th patient appointment in southern Minnesota.
These initiatives highlight the growing adoption of mobile health screening vehicles for enhanced healthcare access and community outreach programs.
Strategic Outlook for Mobile Health Screening Vehicles Market Market
The Mobile Health Screening Vehicles market presents substantial growth potential. Continued technological advancements, favorable government policies, and the rising demand for accessible healthcare will drive market expansion in the coming years. Strategic partnerships, mergers, and acquisitions will further consolidate market share and enhance the overall market landscape. Focusing on specialized mobile clinics catering to specific needs and leveraging telemedicine capabilities will provide competitive advantages and expand market reach. The market is expected to witness significant growth, driven by the evolving healthcare landscape and the need for accessible and efficient healthcare solutions.
Mobile Health Screening Vehicles Market Segmentation
-
1. Clinic Type
- 1.1. Emergency Care
- 1.2. Maternal Health
- 1.3. ICU and Surgery
- 1.4. Infant and Neonatal Health
- 1.5. Geriatric Care
- 1.6. Diagnostic/screening
- 1.7. Others
-
2. Vehicle Type
- 2.1. Mobile Medical Vans
- 2.2. Mobile Medical Bus
- 2.3. Others
-
3. Design Layout
- 3.1. Single Exam Room
- 3.2. Double Exam Room
- 3.3. Triple Exam Room
Mobile Health Screening Vehicles Market Segmentation By Geography
-
1. North America
- 1.1. United States
- 1.2. Canada
- 1.3. Mexico
-
2. Europe
- 2.1. Germany
- 2.2. United Kingdom
- 2.3. France
- 2.4. Italy
- 2.5. Spain
- 2.6. Rest of Europe
-
3. Asia Pacific
- 3.1. China
- 3.2. Japan
- 3.3. India
- 3.4. Australia
- 3.5. South Korea
- 3.6. Rest of Asia Pacific
-
4. Middle East and Africa
- 4.1. GCC
- 4.2. South Africa
- 4.3. Rest of Middle East and Africa
-
5. South America
- 5.1. Brazil
- 5.2. Argentina
- 5.3. Rest of South America
Mobile Health Screening Vehicles Market REPORT HIGHLIGHTS
| Aspects | Details |
|---|---|
| Study Period | 2019-2033 |
| Base Year | 2024 |
| Estimated Year | 2025 |
| Forecast Period | 2025-2033 |
| Historical Period | 2019-2024 |
| Growth Rate | CAGR of 20.00% from 2019-2033 |
| Segmentation |
|
Table of Contents
- 1. Introduction
- 1.1. Research Scope
- 1.2. Market Segmentation
- 1.3. Research Methodology
- 1.4. Definitions and Assumptions
- 2. Executive Summary
- 2.1. Introduction
- 3. Market Dynamics
- 3.1. Introduction
- 3.2. Market Drivers
- 3.2.1. Cost-effective and Easy Remote Patient Monitoring; Rising Burden of Chronic Diseases and Emergency Cases; Subsequent Rise in Geriatric Population
- 3.3. Market Restrains
- 3.3.1. Inablity to Cater Large Number of Patients
- 3.4. Market Trends
- 3.4.1. Geriatric Care by Clinic Type is Expected to Witness Growth Over the Forecast Period
- 4. Market Factor Analysis
- 4.1. Porters Five Forces
- 4.2. Supply/Value Chain
- 4.3. PESTEL analysis
- 4.4. Market Entropy
- 4.5. Patent/Trademark Analysis
- 5. Global Mobile Health Screening Vehicles Market Analysis, Insights and Forecast, 2019-2031
- 5.1. Market Analysis, Insights and Forecast - by Clinic Type
- 5.1.1. Emergency Care
- 5.1.2. Maternal Health
- 5.1.3. ICU and Surgery
- 5.1.4. Infant and Neonatal Health
- 5.1.5. Geriatric Care
- 5.1.6. Diagnostic/screening
- 5.1.7. Others
- 5.2. Market Analysis, Insights and Forecast - by Vehicle Type
- 5.2.1. Mobile Medical Vans
- 5.2.2. Mobile Medical Bus
- 5.2.3. Others
- 5.3. Market Analysis, Insights and Forecast - by Design Layout
- 5.3.1. Single Exam Room
- 5.3.2. Double Exam Room
- 5.3.3. Triple Exam Room
- 5.4. Market Analysis, Insights and Forecast - by Region
- 5.4.1. North America
- 5.4.2. Europe
- 5.4.3. Asia Pacific
- 5.4.4. Middle East and Africa
- 5.4.5. South America
- 5.1. Market Analysis, Insights and Forecast - by Clinic Type
- 6. North America Mobile Health Screening Vehicles Market Analysis, Insights and Forecast, 2019-2031
- 6.1. Market Analysis, Insights and Forecast - by Clinic Type
- 6.1.1. Emergency Care
- 6.1.2. Maternal Health
- 6.1.3. ICU and Surgery
- 6.1.4. Infant and Neonatal Health
- 6.1.5. Geriatric Care
- 6.1.6. Diagnostic/screening
- 6.1.7. Others
- 6.2. Market Analysis, Insights and Forecast - by Vehicle Type
- 6.2.1. Mobile Medical Vans
- 6.2.2. Mobile Medical Bus
- 6.2.3. Others
- 6.3. Market Analysis, Insights and Forecast - by Design Layout
- 6.3.1. Single Exam Room
- 6.3.2. Double Exam Room
- 6.3.3. Triple Exam Room
- 6.1. Market Analysis, Insights and Forecast - by Clinic Type
- 7. Europe Mobile Health Screening Vehicles Market Analysis, Insights and Forecast, 2019-2031
- 7.1. Market Analysis, Insights and Forecast - by Clinic Type
- 7.1.1. Emergency Care
- 7.1.2. Maternal Health
- 7.1.3. ICU and Surgery
- 7.1.4. Infant and Neonatal Health
- 7.1.5. Geriatric Care
- 7.1.6. Diagnostic/screening
- 7.1.7. Others
- 7.2. Market Analysis, Insights and Forecast - by Vehicle Type
- 7.2.1. Mobile Medical Vans
- 7.2.2. Mobile Medical Bus
- 7.2.3. Others
- 7.3. Market Analysis, Insights and Forecast - by Design Layout
- 7.3.1. Single Exam Room
- 7.3.2. Double Exam Room
- 7.3.3. Triple Exam Room
- 7.1. Market Analysis, Insights and Forecast - by Clinic Type
- 8. Asia Pacific Mobile Health Screening Vehicles Market Analysis, Insights and Forecast, 2019-2031
- 8.1. Market Analysis, Insights and Forecast - by Clinic Type
- 8.1.1. Emergency Care
- 8.1.2. Maternal Health
- 8.1.3. ICU and Surgery
- 8.1.4. Infant and Neonatal Health
- 8.1.5. Geriatric Care
- 8.1.6. Diagnostic/screening
- 8.1.7. Others
- 8.2. Market Analysis, Insights and Forecast - by Vehicle Type
- 8.2.1. Mobile Medical Vans
- 8.2.2. Mobile Medical Bus
- 8.2.3. Others
- 8.3. Market Analysis, Insights and Forecast - by Design Layout
- 8.3.1. Single Exam Room
- 8.3.2. Double Exam Room
- 8.3.3. Triple Exam Room
- 8.1. Market Analysis, Insights and Forecast - by Clinic Type
- 9. Middle East and Africa Mobile Health Screening Vehicles Market Analysis, Insights and Forecast, 2019-2031
- 9.1. Market Analysis, Insights and Forecast - by Clinic Type
- 9.1.1. Emergency Care
- 9.1.2. Maternal Health
- 9.1.3. ICU and Surgery
- 9.1.4. Infant and Neonatal Health
- 9.1.5. Geriatric Care
- 9.1.6. Diagnostic/screening
- 9.1.7. Others
- 9.2. Market Analysis, Insights and Forecast - by Vehicle Type
- 9.2.1. Mobile Medical Vans
- 9.2.2. Mobile Medical Bus
- 9.2.3. Others
- 9.3. Market Analysis, Insights and Forecast - by Design Layout
- 9.3.1. Single Exam Room
- 9.3.2. Double Exam Room
- 9.3.3. Triple Exam Room
- 9.1. Market Analysis, Insights and Forecast - by Clinic Type
- 10. South America Mobile Health Screening Vehicles Market Analysis, Insights and Forecast, 2019-2031
- 10.1. Market Analysis, Insights and Forecast - by Clinic Type
- 10.1.1. Emergency Care
- 10.1.2. Maternal Health
- 10.1.3. ICU and Surgery
- 10.1.4. Infant and Neonatal Health
- 10.1.5. Geriatric Care
- 10.1.6. Diagnostic/screening
- 10.1.7. Others
- 10.2. Market Analysis, Insights and Forecast - by Vehicle Type
- 10.2.1. Mobile Medical Vans
- 10.2.2. Mobile Medical Bus
- 10.2.3. Others
- 10.3. Market Analysis, Insights and Forecast - by Design Layout
- 10.3.1. Single Exam Room
- 10.3.2. Double Exam Room
- 10.3.3. Triple Exam Room
- 10.1. Market Analysis, Insights and Forecast - by Clinic Type
- 11. North America Mobile Health Screening Vehicles Market Analysis, Insights and Forecast, 2019-2031
- 11.1. Market Analysis, Insights and Forecast - By Country/Sub-region
- 11.1.1 United States
- 11.1.2 Canada
- 11.1.3 Mexico
- 12. South America Mobile Health Screening Vehicles Market Analysis, Insights and Forecast, 2019-2031
- 12.1. Market Analysis, Insights and Forecast - By Country/Sub-region
- 12.1.1 Brazil
- 12.1.2 Mexico
- 12.1.3 Rest of South America
- 13. Europe Mobile Health Screening Vehicles Market Analysis, Insights and Forecast, 2019-2031
- 13.1. Market Analysis, Insights and Forecast - By Country/Sub-region
- 13.1.1 Germany
- 13.1.2 United Kingdom
- 13.1.3 France
- 13.1.4 Italy
- 13.1.5 Spain
- 13.1.6 Rest of Europe
- 14. Asia Pacific Mobile Health Screening Vehicles Market Analysis, Insights and Forecast, 2019-2031
- 14.1. Market Analysis, Insights and Forecast - By Country/Sub-region
- 14.1.1 China
- 14.1.2 Japan
- 14.1.3 India
- 14.1.4 South Korea
- 14.1.5 Taiwan
- 14.1.6 Australia
- 14.1.7 Rest of Asia-Pacific
- 15. MEA Mobile Health Screening Vehicles Market Analysis, Insights and Forecast, 2019-2031
- 15.1. Market Analysis, Insights and Forecast - By Country/Sub-region
- 15.1.1 Middle East
- 15.1.2 Africa
- 16. Competitive Analysis
- 16.1. Global Market Share Analysis 2024
- 16.2. Company Profiles
- 16.2.1 Johnson Medical International Sdn Bhd
- 16.2.1.1. Overview
- 16.2.1.2. Products
- 16.2.1.3. SWOT Analysis
- 16.2.1.4. Recent Developments
- 16.2.1.5. Financials (Based on Availability)
- 16.2.2 EMS Mobile Systems Inc
- 16.2.2.1. Overview
- 16.2.2.2. Products
- 16.2.2.3. SWOT Analysis
- 16.2.2.4. Recent Developments
- 16.2.2.5. Financials (Based on Availability)
- 16.2.3 Medical Coaches
- 16.2.3.1. Overview
- 16.2.3.2. Products
- 16.2.3.3. SWOT Analysis
- 16.2.3.4. Recent Developments
- 16.2.3.5. Financials (Based on Availability)
- 16.2.4 CVR Industries USA Inc
- 16.2.4.1. Overview
- 16.2.4.2. Products
- 16.2.4.3. SWOT Analysis
- 16.2.4.4. Recent Developments
- 16.2.4.5. Financials (Based on Availability)
- 16.2.5 LifeLine Mobile Inc
- 16.2.5.1. Overview
- 16.2.5.2. Products
- 16.2.5.3. SWOT Analysis
- 16.2.5.4. Recent Developments
- 16.2.5.5. Financials (Based on Availability)
- 16.2.6 Farber Specialty Vehicles
- 16.2.6.1. Overview
- 16.2.6.2. Products
- 16.2.6.3. SWOT Analysis
- 16.2.6.4. Recent Developments
- 16.2.6.5. Financials (Based on Availability)
- 16.2.7 MinFound Medical Systems Co Ltd
- 16.2.7.1. Overview
- 16.2.7.2. Products
- 16.2.7.3. SWOT Analysis
- 16.2.7.4. Recent Developments
- 16.2.7.5. Financials (Based on Availability)
- 16.2.8 Matthews Specialty Vehicles
- 16.2.8.1. Overview
- 16.2.8.2. Products
- 16.2.8.3. SWOT Analysis
- 16.2.8.4. Recent Developments
- 16.2.8.5. Financials (Based on Availability)
- 16.2.9 ADI Mobile Health
- 16.2.9.1. Overview
- 16.2.9.2. Products
- 16.2.9.3. SWOT Analysis
- 16.2.9.4. Recent Developments
- 16.2.9.5. Financials (Based on Availability)
- 16.2.10 Odulair LLC
- 16.2.10.1. Overview
- 16.2.10.2. Products
- 16.2.10.3. SWOT Analysis
- 16.2.10.4. Recent Developments
- 16.2.10.5. Financials (Based on Availability)
- 16.2.1 Johnson Medical International Sdn Bhd
List of Figures
- Figure 1: Global Mobile Health Screening Vehicles Market Revenue Breakdown (billion, %) by Region 2024 & 2032
- Figure 2: Global Mobile Health Screening Vehicles Market Volume Breakdown (K Units, %) by Region 2024 & 2032
- Figure 3: North America Mobile Health Screening Vehicles Market Revenue (billion), by Country 2024 & 2032
- Figure 4: North America Mobile Health Screening Vehicles Market Volume (K Units), by Country 2024 & 2032
- Figure 5: North America Mobile Health Screening Vehicles Market Revenue Share (%), by Country 2024 & 2032
- Figure 6: North America Mobile Health Screening Vehicles Market Volume Share (%), by Country 2024 & 2032
- Figure 7: South America Mobile Health Screening Vehicles Market Revenue (billion), by Country 2024 & 2032
- Figure 8: South America Mobile Health Screening Vehicles Market Volume (K Units), by Country 2024 & 2032
- Figure 9: South America Mobile Health Screening Vehicles Market Revenue Share (%), by Country 2024 & 2032
- Figure 10: South America Mobile Health Screening Vehicles Market Volume Share (%), by Country 2024 & 2032
- Figure 11: Europe Mobile Health Screening Vehicles Market Revenue (billion), by Country 2024 & 2032
- Figure 12: Europe Mobile Health Screening Vehicles Market Volume (K Units), by Country 2024 & 2032
- Figure 13: Europe Mobile Health Screening Vehicles Market Revenue Share (%), by Country 2024 & 2032
- Figure 14: Europe Mobile Health Screening Vehicles Market Volume Share (%), by Country 2024 & 2032
- Figure 15: Asia Pacific Mobile Health Screening Vehicles Market Revenue (billion), by Country 2024 & 2032
- Figure 16: Asia Pacific Mobile Health Screening Vehicles Market Volume (K Units), by Country 2024 & 2032
- Figure 17: Asia Pacific Mobile Health Screening Vehicles Market Revenue Share (%), by Country 2024 & 2032
- Figure 18: Asia Pacific Mobile Health Screening Vehicles Market Volume Share (%), by Country 2024 & 2032
- Figure 19: MEA Mobile Health Screening Vehicles Market Revenue (billion), by Country 2024 & 2032
- Figure 20: MEA Mobile Health Screening Vehicles Market Volume (K Units), by Country 2024 & 2032
- Figure 21: MEA Mobile Health Screening Vehicles Market Revenue Share (%), by Country 2024 & 2032
- Figure 22: MEA Mobile Health Screening Vehicles Market Volume Share (%), by Country 2024 & 2032
- Figure 23: North America Mobile Health Screening Vehicles Market Revenue (billion), by Clinic Type 2024 & 2032
- Figure 24: North America Mobile Health Screening Vehicles Market Volume (K Units), by Clinic Type 2024 & 2032
- Figure 25: North America Mobile Health Screening Vehicles Market Revenue Share (%), by Clinic Type 2024 & 2032
- Figure 26: North America Mobile Health Screening Vehicles Market Volume Share (%), by Clinic Type 2024 & 2032
- Figure 27: North America Mobile Health Screening Vehicles Market Revenue (billion), by Vehicle Type 2024 & 2032
- Figure 28: North America Mobile Health Screening Vehicles Market Volume (K Units), by Vehicle Type 2024 & 2032
- Figure 29: North America Mobile Health Screening Vehicles Market Revenue Share (%), by Vehicle Type 2024 & 2032
- Figure 30: North America Mobile Health Screening Vehicles Market Volume Share (%), by Vehicle Type 2024 & 2032
- Figure 31: North America Mobile Health Screening Vehicles Market Revenue (billion), by Design Layout 2024 & 2032
- Figure 32: North America Mobile Health Screening Vehicles Market Volume (K Units), by Design Layout 2024 & 2032
- Figure 33: North America Mobile Health Screening Vehicles Market Revenue Share (%), by Design Layout 2024 & 2032
- Figure 34: North America Mobile Health Screening Vehicles Market Volume Share (%), by Design Layout 2024 & 2032
- Figure 35: North America Mobile Health Screening Vehicles Market Revenue (billion), by Country 2024 & 2032
- Figure 36: North America Mobile Health Screening Vehicles Market Volume (K Units), by Country 2024 & 2032
- Figure 37: North America Mobile Health Screening Vehicles Market Revenue Share (%), by Country 2024 & 2032
- Figure 38: North America Mobile Health Screening Vehicles Market Volume Share (%), by Country 2024 & 2032
- Figure 39: Europe Mobile Health Screening Vehicles Market Revenue (billion), by Clinic Type 2024 & 2032
- Figure 40: Europe Mobile Health Screening Vehicles Market Volume (K Units), by Clinic Type 2024 & 2032
- Figure 41: Europe Mobile Health Screening Vehicles Market Revenue Share (%), by Clinic Type 2024 & 2032
- Figure 42: Europe Mobile Health Screening Vehicles Market Volume Share (%), by Clinic Type 2024 & 2032
- Figure 43: Europe Mobile Health Screening Vehicles Market Revenue (billion), by Vehicle Type 2024 & 2032
- Figure 44: Europe Mobile Health Screening Vehicles Market Volume (K Units), by Vehicle Type 2024 & 2032
- Figure 45: Europe Mobile Health Screening Vehicles Market Revenue Share (%), by Vehicle Type 2024 & 2032
- Figure 46: Europe Mobile Health Screening Vehicles Market Volume Share (%), by Vehicle Type 2024 & 2032
- Figure 47: Europe Mobile Health Screening Vehicles Market Revenue (billion), by Design Layout 2024 & 2032
- Figure 48: Europe Mobile Health Screening Vehicles Market Volume (K Units), by Design Layout 2024 & 2032
- Figure 49: Europe Mobile Health Screening Vehicles Market Revenue Share (%), by Design Layout 2024 & 2032
- Figure 50: Europe Mobile Health Screening Vehicles Market Volume Share (%), by Design Layout 2024 & 2032
- Figure 51: Europe Mobile Health Screening Vehicles Market Revenue (billion), by Country 2024 & 2032
- Figure 52: Europe Mobile Health Screening Vehicles Market Volume (K Units), by Country 2024 & 2032
- Figure 53: Europe Mobile Health Screening Vehicles Market Revenue Share (%), by Country 2024 & 2032
- Figure 54: Europe Mobile Health Screening Vehicles Market Volume Share (%), by Country 2024 & 2032
- Figure 55: Asia Pacific Mobile Health Screening Vehicles Market Revenue (billion), by Clinic Type 2024 & 2032
- Figure 56: Asia Pacific Mobile Health Screening Vehicles Market Volume (K Units), by Clinic Type 2024 & 2032
- Figure 57: Asia Pacific Mobile Health Screening Vehicles Market Revenue Share (%), by Clinic Type 2024 & 2032
- Figure 58: Asia Pacific Mobile Health Screening Vehicles Market Volume Share (%), by Clinic Type 2024 & 2032
- Figure 59: Asia Pacific Mobile Health Screening Vehicles Market Revenue (billion), by Vehicle Type 2024 & 2032
- Figure 60: Asia Pacific Mobile Health Screening Vehicles Market Volume (K Units), by Vehicle Type 2024 & 2032
- Figure 61: Asia Pacific Mobile Health Screening Vehicles Market Revenue Share (%), by Vehicle Type 2024 & 2032
- Figure 62: Asia Pacific Mobile Health Screening Vehicles Market Volume Share (%), by Vehicle Type 2024 & 2032
- Figure 63: Asia Pacific Mobile Health Screening Vehicles Market Revenue (billion), by Design Layout 2024 & 2032
- Figure 64: Asia Pacific Mobile Health Screening Vehicles Market Volume (K Units), by Design Layout 2024 & 2032
- Figure 65: Asia Pacific Mobile Health Screening Vehicles Market Revenue Share (%), by Design Layout 2024 & 2032
- Figure 66: Asia Pacific Mobile Health Screening Vehicles Market Volume Share (%), by Design Layout 2024 & 2032
- Figure 67: Asia Pacific Mobile Health Screening Vehicles Market Revenue (billion), by Country 2024 & 2032
- Figure 68: Asia Pacific Mobile Health Screening Vehicles Market Volume (K Units), by Country 2024 & 2032
- Figure 69: Asia Pacific Mobile Health Screening Vehicles Market Revenue Share (%), by Country 2024 & 2032
- Figure 70: Asia Pacific Mobile Health Screening Vehicles Market Volume Share (%), by Country 2024 & 2032
- Figure 71: Middle East and Africa Mobile Health Screening Vehicles Market Revenue (billion), by Clinic Type 2024 & 2032
- Figure 72: Middle East and Africa Mobile Health Screening Vehicles Market Volume (K Units), by Clinic Type 2024 & 2032
- Figure 73: Middle East and Africa Mobile Health Screening Vehicles Market Revenue Share (%), by Clinic Type 2024 & 2032
- Figure 74: Middle East and Africa Mobile Health Screening Vehicles Market Volume Share (%), by Clinic Type 2024 & 2032
- Figure 75: Middle East and Africa Mobile Health Screening Vehicles Market Revenue (billion), by Vehicle Type 2024 & 2032
- Figure 76: Middle East and Africa Mobile Health Screening Vehicles Market Volume (K Units), by Vehicle Type 2024 & 2032
- Figure 77: Middle East and Africa Mobile Health Screening Vehicles Market Revenue Share (%), by Vehicle Type 2024 & 2032
- Figure 78: Middle East and Africa Mobile Health Screening Vehicles Market Volume Share (%), by Vehicle Type 2024 & 2032
- Figure 79: Middle East and Africa Mobile Health Screening Vehicles Market Revenue (billion), by Design Layout 2024 & 2032
- Figure 80: Middle East and Africa Mobile Health Screening Vehicles Market Volume (K Units), by Design Layout 2024 & 2032
- Figure 81: Middle East and Africa Mobile Health Screening Vehicles Market Revenue Share (%), by Design Layout 2024 & 2032
- Figure 82: Middle East and Africa Mobile Health Screening Vehicles Market Volume Share (%), by Design Layout 2024 & 2032
- Figure 83: Middle East and Africa Mobile Health Screening Vehicles Market Revenue (billion), by Country 2024 & 2032
- Figure 84: Middle East and Africa Mobile Health Screening Vehicles Market Volume (K Units), by Country 2024 & 2032
- Figure 85: Middle East and Africa Mobile Health Screening Vehicles Market Revenue Share (%), by Country 2024 & 2032
- Figure 86: Middle East and Africa Mobile Health Screening Vehicles Market Volume Share (%), by Country 2024 & 2032
- Figure 87: South America Mobile Health Screening Vehicles Market Revenue (billion), by Clinic Type 2024 & 2032
- Figure 88: South America Mobile Health Screening Vehicles Market Volume (K Units), by Clinic Type 2024 & 2032
- Figure 89: South America Mobile Health Screening Vehicles Market Revenue Share (%), by Clinic Type 2024 & 2032
- Figure 90: South America Mobile Health Screening Vehicles Market Volume Share (%), by Clinic Type 2024 & 2032
- Figure 91: South America Mobile Health Screening Vehicles Market Revenue (billion), by Vehicle Type 2024 & 2032
- Figure 92: South America Mobile Health Screening Vehicles Market Volume (K Units), by Vehicle Type 2024 & 2032
- Figure 93: South America Mobile Health Screening Vehicles Market Revenue Share (%), by Vehicle Type 2024 & 2032
- Figure 94: South America Mobile Health Screening Vehicles Market Volume Share (%), by Vehicle Type 2024 & 2032
- Figure 95: South America Mobile Health Screening Vehicles Market Revenue (billion), by Design Layout 2024 & 2032
- Figure 96: South America Mobile Health Screening Vehicles Market Volume (K Units), by Design Layout 2024 & 2032
- Figure 97: South America Mobile Health Screening Vehicles Market Revenue Share (%), by Design Layout 2024 & 2032
- Figure 98: South America Mobile Health Screening Vehicles Market Volume Share (%), by Design Layout 2024 & 2032
- Figure 99: South America Mobile Health Screening Vehicles Market Revenue (billion), by Country 2024 & 2032
- Figure 100: South America Mobile Health Screening Vehicles Market Volume (K Units), by Country 2024 & 2032
- Figure 101: South America Mobile Health Screening Vehicles Market Revenue Share (%), by Country 2024 & 2032
- Figure 102: South America Mobile Health Screening Vehicles Market Volume Share (%), by Country 2024 & 2032
List of Tables
- Table 1: Global Mobile Health Screening Vehicles Market Revenue billion Forecast, by Region 2019 & 2032
- Table 2: Global Mobile Health Screening Vehicles Market Volume K Units Forecast, by Region 2019 & 2032
- Table 3: Global Mobile Health Screening Vehicles Market Revenue billion Forecast, by Clinic Type 2019 & 2032
- Table 4: Global Mobile Health Screening Vehicles Market Volume K Units Forecast, by Clinic Type 2019 & 2032
- Table 5: Global Mobile Health Screening Vehicles Market Revenue billion Forecast, by Vehicle Type 2019 & 2032
- Table 6: Global Mobile Health Screening Vehicles Market Volume K Units Forecast, by Vehicle Type 2019 & 2032
- Table 7: Global Mobile Health Screening Vehicles Market Revenue billion Forecast, by Design Layout 2019 & 2032
- Table 8: Global Mobile Health Screening Vehicles Market Volume K Units Forecast, by Design Layout 2019 & 2032
- Table 9: Global Mobile Health Screening Vehicles Market Revenue billion Forecast, by Region 2019 & 2032
- Table 10: Global Mobile Health Screening Vehicles Market Volume K Units Forecast, by Region 2019 & 2032
- Table 11: Global Mobile Health Screening Vehicles Market Revenue billion Forecast, by Country 2019 & 2032
- Table 12: Global Mobile Health Screening Vehicles Market Volume K Units Forecast, by Country 2019 & 2032
- Table 13: United States Mobile Health Screening Vehicles Market Revenue (billion) Forecast, by Application 2019 & 2032
- Table 14: United States Mobile Health Screening Vehicles Market Volume (K Units) Forecast, by Application 2019 & 2032
- Table 15: Canada Mobile Health Screening Vehicles Market Revenue (billion) Forecast, by Application 2019 & 2032
- Table 16: Canada Mobile Health Screening Vehicles Market Volume (K Units) Forecast, by Application 2019 & 2032
- Table 17: Mexico Mobile Health Screening Vehicles Market Revenue (billion) Forecast, by Application 2019 & 2032
- Table 18: Mexico Mobile Health Screening Vehicles Market Volume (K Units) Forecast, by Application 2019 & 2032
- Table 19: Global Mobile Health Screening Vehicles Market Revenue billion Forecast, by Country 2019 & 2032
- Table 20: Global Mobile Health Screening Vehicles Market Volume K Units Forecast, by Country 2019 & 2032
- Table 21: Brazil Mobile Health Screening Vehicles Market Revenue (billion) Forecast, by Application 2019 & 2032
- Table 22: Brazil Mobile Health Screening Vehicles Market Volume (K Units) Forecast, by Application 2019 & 2032
- Table 23: Mexico Mobile Health Screening Vehicles Market Revenue (billion) Forecast, by Application 2019 & 2032
- Table 24: Mexico Mobile Health Screening Vehicles Market Volume (K Units) Forecast, by Application 2019 & 2032
- Table 25: Rest of South America Mobile Health Screening Vehicles Market Revenue (billion) Forecast, by Application 2019 & 2032
- Table 26: Rest of South America Mobile Health Screening Vehicles Market Volume (K Units) Forecast, by Application 2019 & 2032
- Table 27: Global Mobile Health Screening Vehicles Market Revenue billion Forecast, by Country 2019 & 2032
- Table 28: Global Mobile Health Screening Vehicles Market Volume K Units Forecast, by Country 2019 & 2032
- Table 29: Germany Mobile Health Screening Vehicles Market Revenue (billion) Forecast, by Application 2019 & 2032
- Table 30: Germany Mobile Health Screening Vehicles Market Volume (K Units) Forecast, by Application 2019 & 2032
- Table 31: United Kingdom Mobile Health Screening Vehicles Market Revenue (billion) Forecast, by Application 2019 & 2032
- Table 32: United Kingdom Mobile Health Screening Vehicles Market Volume (K Units) Forecast, by Application 2019 & 2032
- Table 33: France Mobile Health Screening Vehicles Market Revenue (billion) Forecast, by Application 2019 & 2032
- Table 34: France Mobile Health Screening Vehicles Market Volume (K Units) Forecast, by Application 2019 & 2032
- Table 35: Italy Mobile Health Screening Vehicles Market Revenue (billion) Forecast, by Application 2019 & 2032
- Table 36: Italy Mobile Health Screening Vehicles Market Volume (K Units) Forecast, by Application 2019 & 2032
- Table 37: Spain Mobile Health Screening Vehicles Market Revenue (billion) Forecast, by Application 2019 & 2032
- Table 38: Spain Mobile Health Screening Vehicles Market Volume (K Units) Forecast, by Application 2019 & 2032
- Table 39: Rest of Europe Mobile Health Screening Vehicles Market Revenue (billion) Forecast, by Application 2019 & 2032
- Table 40: Rest of Europe Mobile Health Screening Vehicles Market Volume (K Units) Forecast, by Application 2019 & 2032
- Table 41: Global Mobile Health Screening Vehicles Market Revenue billion Forecast, by Country 2019 & 2032
- Table 42: Global Mobile Health Screening Vehicles Market Volume K Units Forecast, by Country 2019 & 2032
- Table 43: China Mobile Health Screening Vehicles Market Revenue (billion) Forecast, by Application 2019 & 2032
- Table 44: China Mobile Health Screening Vehicles Market Volume (K Units) Forecast, by Application 2019 & 2032
- Table 45: Japan Mobile Health Screening Vehicles Market Revenue (billion) Forecast, by Application 2019 & 2032
- Table 46: Japan Mobile Health Screening Vehicles Market Volume (K Units) Forecast, by Application 2019 & 2032
- Table 47: India Mobile Health Screening Vehicles Market Revenue (billion) Forecast, by Application 2019 & 2032
- Table 48: India Mobile Health Screening Vehicles Market Volume (K Units) Forecast, by Application 2019 & 2032
- Table 49: South Korea Mobile Health Screening Vehicles Market Revenue (billion) Forecast, by Application 2019 & 2032
- Table 50: South Korea Mobile Health Screening Vehicles Market Volume (K Units) Forecast, by Application 2019 & 2032
- Table 51: Taiwan Mobile Health Screening Vehicles Market Revenue (billion) Forecast, by Application 2019 & 2032
- Table 52: Taiwan Mobile Health Screening Vehicles Market Volume (K Units) Forecast, by Application 2019 & 2032
- Table 53: Australia Mobile Health Screening Vehicles Market Revenue (billion) Forecast, by Application 2019 & 2032
- Table 54: Australia Mobile Health Screening Vehicles Market Volume (K Units) Forecast, by Application 2019 & 2032
- Table 55: Rest of Asia-Pacific Mobile Health Screening Vehicles Market Revenue (billion) Forecast, by Application 2019 & 2032
- Table 56: Rest of Asia-Pacific Mobile Health Screening Vehicles Market Volume (K Units) Forecast, by Application 2019 & 2032
- Table 57: Global Mobile Health Screening Vehicles Market Revenue billion Forecast, by Country 2019 & 2032
- Table 58: Global Mobile Health Screening Vehicles Market Volume K Units Forecast, by Country 2019 & 2032
- Table 59: Middle East Mobile Health Screening Vehicles Market Revenue (billion) Forecast, by Application 2019 & 2032
- Table 60: Middle East Mobile Health Screening Vehicles Market Volume (K Units) Forecast, by Application 2019 & 2032
- Table 61: Africa Mobile Health Screening Vehicles Market Revenue (billion) Forecast, by Application 2019 & 2032
- Table 62: Africa Mobile Health Screening Vehicles Market Volume (K Units) Forecast, by Application 2019 & 2032
- Table 63: Global Mobile Health Screening Vehicles Market Revenue billion Forecast, by Clinic Type 2019 & 2032
- Table 64: Global Mobile Health Screening Vehicles Market Volume K Units Forecast, by Clinic Type 2019 & 2032
- Table 65: Global Mobile Health Screening Vehicles Market Revenue billion Forecast, by Vehicle Type 2019 & 2032
- Table 66: Global Mobile Health Screening Vehicles Market Volume K Units Forecast, by Vehicle Type 2019 & 2032
- Table 67: Global Mobile Health Screening Vehicles Market Revenue billion Forecast, by Design Layout 2019 & 2032
- Table 68: Global Mobile Health Screening Vehicles Market Volume K Units Forecast, by Design Layout 2019 & 2032
- Table 69: Global Mobile Health Screening Vehicles Market Revenue billion Forecast, by Country 2019 & 2032
- Table 70: Global Mobile Health Screening Vehicles Market Volume K Units Forecast, by Country 2019 & 2032
- Table 71: United States Mobile Health Screening Vehicles Market Revenue (billion) Forecast, by Application 2019 & 2032
- Table 72: United States Mobile Health Screening Vehicles Market Volume (K Units) Forecast, by Application 2019 & 2032
- Table 73: Canada Mobile Health Screening Vehicles Market Revenue (billion) Forecast, by Application 2019 & 2032
- Table 74: Canada Mobile Health Screening Vehicles Market Volume (K Units) Forecast, by Application 2019 & 2032
- Table 75: Mexico Mobile Health Screening Vehicles Market Revenue (billion) Forecast, by Application 2019 & 2032
- Table 76: Mexico Mobile Health Screening Vehicles Market Volume (K Units) Forecast, by Application 2019 & 2032
- Table 77: Global Mobile Health Screening Vehicles Market Revenue billion Forecast, by Clinic Type 2019 & 2032
- Table 78: Global Mobile Health Screening Vehicles Market Volume K Units Forecast, by Clinic Type 2019 & 2032
- Table 79: Global Mobile Health Screening Vehicles Market Revenue billion Forecast, by Vehicle Type 2019 & 2032
- Table 80: Global Mobile Health Screening Vehicles Market Volume K Units Forecast, by Vehicle Type 2019 & 2032
- Table 81: Global Mobile Health Screening Vehicles Market Revenue billion Forecast, by Design Layout 2019 & 2032
- Table 82: Global Mobile Health Screening Vehicles Market Volume K Units Forecast, by Design Layout 2019 & 2032
- Table 83: Global Mobile Health Screening Vehicles Market Revenue billion Forecast, by Country 2019 & 2032
- Table 84: Global Mobile Health Screening Vehicles Market Volume K Units Forecast, by Country 2019 & 2032
- Table 85: Germany Mobile Health Screening Vehicles Market Revenue (billion) Forecast, by Application 2019 & 2032
- Table 86: Germany Mobile Health Screening Vehicles Market Volume (K Units) Forecast, by Application 2019 & 2032
- Table 87: United Kingdom Mobile Health Screening Vehicles Market Revenue (billion) Forecast, by Application 2019 & 2032
- Table 88: United Kingdom Mobile Health Screening Vehicles Market Volume (K Units) Forecast, by Application 2019 & 2032
- Table 89: France Mobile Health Screening Vehicles Market Revenue (billion) Forecast, by Application 2019 & 2032
- Table 90: France Mobile Health Screening Vehicles Market Volume (K Units) Forecast, by Application 2019 & 2032
- Table 91: Italy Mobile Health Screening Vehicles Market Revenue (billion) Forecast, by Application 2019 & 2032
- Table 92: Italy Mobile Health Screening Vehicles Market Volume (K Units) Forecast, by Application 2019 & 2032
- Table 93: Spain Mobile Health Screening Vehicles Market Revenue (billion) Forecast, by Application 2019 & 2032
- Table 94: Spain Mobile Health Screening Vehicles Market Volume (K Units) Forecast, by Application 2019 & 2032
- Table 95: Rest of Europe Mobile Health Screening Vehicles Market Revenue (billion) Forecast, by Application 2019 & 2032
- Table 96: Rest of Europe Mobile Health Screening Vehicles Market Volume (K Units) Forecast, by Application 2019 & 2032
- Table 97: Global Mobile Health Screening Vehicles Market Revenue billion Forecast, by Clinic Type 2019 & 2032
- Table 98: Global Mobile Health Screening Vehicles Market Volume K Units Forecast, by Clinic Type 2019 & 2032
- Table 99: Global Mobile Health Screening Vehicles Market Revenue billion Forecast, by Vehicle Type 2019 & 2032
- Table 100: Global Mobile Health Screening Vehicles Market Volume K Units Forecast, by Vehicle Type 2019 & 2032
- Table 101: Global Mobile Health Screening Vehicles Market Revenue billion Forecast, by Design Layout 2019 & 2032
- Table 102: Global Mobile Health Screening Vehicles Market Volume K Units Forecast, by Design Layout 2019 & 2032
- Table 103: Global Mobile Health Screening Vehicles Market Revenue billion Forecast, by Country 2019 & 2032
- Table 104: Global Mobile Health Screening Vehicles Market Volume K Units Forecast, by Country 2019 & 2032
- Table 105: China Mobile Health Screening Vehicles Market Revenue (billion) Forecast, by Application 2019 & 2032
- Table 106: China Mobile Health Screening Vehicles Market Volume (K Units) Forecast, by Application 2019 & 2032
- Table 107: Japan Mobile Health Screening Vehicles Market Revenue (billion) Forecast, by Application 2019 & 2032
- Table 108: Japan Mobile Health Screening Vehicles Market Volume (K Units) Forecast, by Application 2019 & 2032
- Table 109: India Mobile Health Screening Vehicles Market Revenue (billion) Forecast, by Application 2019 & 2032
- Table 110: India Mobile Health Screening Vehicles Market Volume (K Units) Forecast, by Application 2019 & 2032
- Table 111: Australia Mobile Health Screening Vehicles Market Revenue (billion) Forecast, by Application 2019 & 2032
- Table 112: Australia Mobile Health Screening Vehicles Market Volume (K Units) Forecast, by Application 2019 & 2032
- Table 113: South Korea Mobile Health Screening Vehicles Market Revenue (billion) Forecast, by Application 2019 & 2032
- Table 114: South Korea Mobile Health Screening Vehicles Market Volume (K Units) Forecast, by Application 2019 & 2032
- Table 115: Rest of Asia Pacific Mobile Health Screening Vehicles Market Revenue (billion) Forecast, by Application 2019 & 2032
- Table 116: Rest of Asia Pacific Mobile Health Screening Vehicles Market Volume (K Units) Forecast, by Application 2019 & 2032
- Table 117: Global Mobile Health Screening Vehicles Market Revenue billion Forecast, by Clinic Type 2019 & 2032
- Table 118: Global Mobile Health Screening Vehicles Market Volume K Units Forecast, by Clinic Type 2019 & 2032
- Table 119: Global Mobile Health Screening Vehicles Market Revenue billion Forecast, by Vehicle Type 2019 & 2032
- Table 120: Global Mobile Health Screening Vehicles Market Volume K Units Forecast, by Vehicle Type 2019 & 2032
- Table 121: Global Mobile Health Screening Vehicles Market Revenue billion Forecast, by Design Layout 2019 & 2032
- Table 122: Global Mobile Health Screening Vehicles Market Volume K Units Forecast, by Design Layout 2019 & 2032
- Table 123: Global Mobile Health Screening Vehicles Market Revenue billion Forecast, by Country 2019 & 2032
- Table 124: Global Mobile Health Screening Vehicles Market Volume K Units Forecast, by Country 2019 & 2032
- Table 125: GCC Mobile Health Screening Vehicles Market Revenue (billion) Forecast, by Application 2019 & 2032
- Table 126: GCC Mobile Health Screening Vehicles Market Volume (K Units) Forecast, by Application 2019 & 2032
- Table 127: South Africa Mobile Health Screening Vehicles Market Revenue (billion) Forecast, by Application 2019 & 2032
- Table 128: South Africa Mobile Health Screening Vehicles Market Volume (K Units) Forecast, by Application 2019 & 2032
- Table 129: Rest of Middle East and Africa Mobile Health Screening Vehicles Market Revenue (billion) Forecast, by Application 2019 & 2032
- Table 130: Rest of Middle East and Africa Mobile Health Screening Vehicles Market Volume (K Units) Forecast, by Application 2019 & 2032
- Table 131: Global Mobile Health Screening Vehicles Market Revenue billion Forecast, by Clinic Type 2019 & 2032
- Table 132: Global Mobile Health Screening Vehicles Market Volume K Units Forecast, by Clinic Type 2019 & 2032
- Table 133: Global Mobile Health Screening Vehicles Market Revenue billion Forecast, by Vehicle Type 2019 & 2032
- Table 134: Global Mobile Health Screening Vehicles Market Volume K Units Forecast, by Vehicle Type 2019 & 2032
- Table 135: Global Mobile Health Screening Vehicles Market Revenue billion Forecast, by Design Layout 2019 & 2032
- Table 136: Global Mobile Health Screening Vehicles Market Volume K Units Forecast, by Design Layout 2019 & 2032
- Table 137: Global Mobile Health Screening Vehicles Market Revenue billion Forecast, by Country 2019 & 2032
- Table 138: Global Mobile Health Screening Vehicles Market Volume K Units Forecast, by Country 2019 & 2032
- Table 139: Brazil Mobile Health Screening Vehicles Market Revenue (billion) Forecast, by Application 2019 & 2032
- Table 140: Brazil Mobile Health Screening Vehicles Market Volume (K Units) Forecast, by Application 2019 & 2032
- Table 141: Argentina Mobile Health Screening Vehicles Market Revenue (billion) Forecast, by Application 2019 & 2032
- Table 142: Argentina Mobile Health Screening Vehicles Market Volume (K Units) Forecast, by Application 2019 & 2032
- Table 143: Rest of South America Mobile Health Screening Vehicles Market Revenue (billion) Forecast, by Application 2019 & 2032
- Table 144: Rest of South America Mobile Health Screening Vehicles Market Volume (K Units) Forecast, by Application 2019 & 2032
Frequently Asked Questions
1. What is the projected Compound Annual Growth Rate (CAGR) of the Mobile Health Screening Vehicles Market?
The projected CAGR is approximately 20.00%.
2. Which companies are prominent players in the Mobile Health Screening Vehicles Market?
Key companies in the market include Johnson Medical International Sdn Bhd, EMS Mobile Systems Inc, Medical Coaches, CVR Industries USA Inc, LifeLine Mobile Inc, Farber Specialty Vehicles, MinFound Medical Systems Co Ltd, Matthews Specialty Vehicles, ADI Mobile Health, Odulair LLC.
3. What are the main segments of the Mobile Health Screening Vehicles Market?
The market segments include Clinic Type, Vehicle Type, Design Layout.
4. Can you provide details about the market size?
The market size is estimated to be USD XX billion as of 2022.
5. What are some drivers contributing to market growth?
Cost-effective and Easy Remote Patient Monitoring; Rising Burden of Chronic Diseases and Emergency Cases; Subsequent Rise in Geriatric Population.
6. What are the notable trends driving market growth?
Geriatric Care by Clinic Type is Expected to Witness Growth Over the Forecast Period.
7. Are there any restraints impacting market growth?
Inablity to Cater Large Number of Patients.
8. Can you provide examples of recent developments in the market?
In July 2022, Aster DM Foundation launched Aster Volunteers Mobile Medical Clinic, the first initiative under Mission Barmer 2022. This project was being undertaken in collaboration with Ruma Devi Foundation and Human Welfare Foundation, in the village of Barmer, in Rajasthan, India.
9. What pricing options are available for accessing the report?
Pricing options include single-user, multi-user, and enterprise licenses priced at USD 4750, USD 5250, and USD 8750 respectively.
10. Is the market size provided in terms of value or volume?
The market size is provided in terms of value, measured in billion and volume, measured in K Units.
11. Are there any specific market keywords associated with the report?
Yes, the market keyword associated with the report is "Mobile Health Screening Vehicles Market," which aids in identifying and referencing the specific market segment covered.
12. How do I determine which pricing option suits my needs best?
The pricing options vary based on user requirements and access needs. Individual users may opt for single-user licenses, while businesses requiring broader access may choose multi-user or enterprise licenses for cost-effective access to the report.
13. Are there any additional resources or data provided in the Mobile Health Screening Vehicles Market report?
While the report offers comprehensive insights, it's advisable to review the specific contents or supplementary materials provided to ascertain if additional resources or data are available.
14. How can I stay updated on further developments or reports in the Mobile Health Screening Vehicles Market?
To stay informed about further developments, trends, and reports in the Mobile Health Screening Vehicles Market, consider subscribing to industry newsletters, following relevant companies and organizations, or regularly checking reputable industry news sources and publications.
Methodology
Step 1 - Identification of Relevant Samples Size from Population Database


Step 2 - Approaches for Defining Global Market Size (Value, Volume* & Price*)

Note*: In applicable scenarios
Step 3 - Data Sources
Primary Research
- Web Analytics
- Survey Reports
- Research Institute
- Latest Research Reports
- Opinion Leaders
Secondary Research
- Annual Reports
- White Paper
- Latest Press Release
- Industry Association
- Paid Database
- Investor Presentations

Step 4 - Data Triangulation
Involves using different sources of information in order to increase the validity of a study
These sources are likely to be stakeholders in a program - participants, other researchers, program staff, other community members, and so on.
Then we put all data in single framework & apply various statistical tools to find out the dynamic on the market.
During the analysis stage, feedback from the stakeholder groups would be compared to determine areas of agreement as well as areas of divergence


