
Key Insights
The global myopia and presbyopia treatment market, valued at $26.13 billion in 2025, is projected to experience robust growth, driven by several key factors. The rising prevalence of myopia and presbyopia, particularly in aging populations across North America, Europe, and Asia-Pacific, is a significant driver. Technological advancements in refractive surgery (LASIK, SMILE), contact lens technology (multifocal, orthokeratology), and pharmaceutical interventions are expanding treatment options and improving patient outcomes, further fueling market expansion. Increased awareness of vision correction solutions and rising disposable incomes in emerging economies are contributing to higher treatment adoption rates. The market segmentation reveals a substantial demand for prescription lenses, followed by contact lenses, with surgical interventions and medication occupying niche segments. Competitive pressures among established players like EssilorLuxottica, Johnson & Johnson Vision, and Alcon, coupled with the emergence of innovative companies, are shaping the market landscape. Further growth will likely be influenced by the ongoing research and development efforts focused on innovative treatments for myopia progression and presbyopia management.
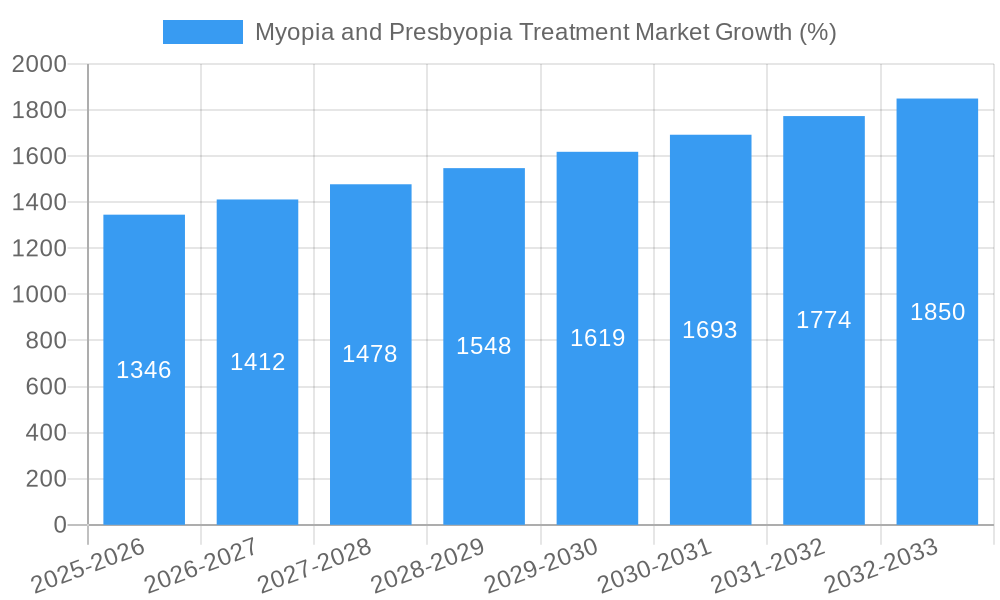
The forecast period (2025-2033) anticipates a consistent expansion of the market, propelled by factors including improved healthcare infrastructure in developing nations, the growing adoption of advanced diagnostic tools, and increased access to ophthalmological services. However, the high cost of advanced treatments, particularly refractive surgeries, may represent a restraint in certain regions. The market is anticipated to witness regional variations in growth, with Asia-Pacific expected to dominate due to its large population base and increasing prevalence of vision disorders. North America and Europe are also expected to showcase considerable growth due to advanced healthcare facilities and higher per capita healthcare spending. Continuous innovation in minimally invasive surgical procedures and the development of more effective, less invasive medication could significantly impact the market's future trajectory. The market's success will hinge on the successful balance between affordability and accessibility of treatments, with a focus on improved patient outcomes and quality of life.
Myopia and Presbyopia Treatment Market: A Comprehensive Report (2019-2033)
This comprehensive report provides an in-depth analysis of the Myopia and Presbyopia Treatment Market, offering invaluable insights for industry stakeholders, investors, and strategic decision-makers. Covering the period from 2019 to 2033, with a base year of 2025 and a forecast period of 2025-2033, this report meticulously examines market trends, competitive landscapes, and future growth potential. The total market size is projected to reach xx Million by 2033.
Myopia and Presbyopia Treatment Market Concentration & Innovation
The Myopia and Presbyopia Treatment Market is characterized by a moderately concentrated landscape with several major players dominating the market share. Key players such as EssilorLuxottica, Johnson & Johnson Vision, and Alcon hold significant market share, driven by their extensive product portfolios and strong brand recognition. However, the market also features several smaller, specialized companies focused on innovative treatment modalities. Market concentration is further influenced by the regulatory landscape, impacting market entry and expansion strategies for companies.
Market Concentration Metrics (Estimated 2025):
- Top 5 players hold approximately xx% of the market share.
- Average market share of top 10 players: xx%
Innovation Drivers:
- Advancements in refractive surgery techniques (e.g., LASIK, SMILE).
- Development of novel ophthalmic medications for myopia and presbyopia management.
- Growing adoption of contact lenses with advanced features (e.g., multifocal, orthokeratology).
- Increased research and development in gene therapy and other emerging treatments.
M&A Activities: The market has witnessed several significant mergers and acquisitions in recent years, primarily focused on expanding product portfolios, strengthening market presence, and accessing new technologies. While precise M&A deal values are not publicly available for all transactions, the estimated total value of M&A deals in the past five years is approximately xx Million.
Regulatory Frameworks and Substitutes: Stringent regulatory approvals for new treatments and devices are a crucial factor influencing market dynamics. The availability of alternative treatments (e.g., spectacles for mild myopia and presbyopia) also plays a role in market segmentation and growth. End-user trends toward minimally invasive procedures and personalized treatment plans further shape market demand.
Myopia and Presbyopia Treatment Market Industry Trends & Insights
The Myopia and Presbyopia Treatment Market is experiencing significant growth, driven by several key factors. The rising prevalence of myopia and presbyopia globally, fueled by increased screen time and aging populations, is a primary driver. This is further compounded by increasing disposable incomes and improved healthcare infrastructure in developing economies leading to higher demand for vision correction solutions. Technological advancements in treatment modalities are also contributing to market expansion. The market demonstrates a steady CAGR of xx% from 2025 to 2033, with market penetration expected to reach xx% by 2033. Competitive dynamics are shaped by the introduction of innovative products, strategic partnerships, and pricing strategies. Consumer preferences shift towards convenient, effective, and minimally invasive treatments, creating opportunities for new product development and market entry.
Dominant Markets & Segments in Myopia and Presbyopia Treatment Market
The North American and European markets currently dominate the Myopia and Presbyopia Treatment Market, driven by high prevalence rates, advanced healthcare infrastructure, and high per-capita healthcare expenditure. Within these regions, the United States and Germany are significant markets. The Asia Pacific region is projected to demonstrate significant growth in the forecast period due to rising prevalence rates and increasing healthcare expenditure.
Dominant Segments:
- Disease Type: Presbyopia currently holds a larger market share compared to myopia due to the aging global population. However, myopia is exhibiting strong growth due to rising prevalence among younger populations.
- Treatment Type: Prescription lenses continue to hold the largest market share, followed by contact lenses. Surgical treatments are experiencing growth, driven by technological advancements and improved outcomes. Medication-based treatments show emerging growth potential with the introduction of new drugs.
Key Drivers for Dominant Regions:
- North America: High disposable income, advanced healthcare infrastructure, and a significant elderly population.
- Europe: Well-established healthcare systems, high awareness of vision correction options, and significant investment in healthcare research.
- Asia Pacific: Rapidly growing middle class, increasing healthcare expenditure, and high prevalence rates in some countries.
Myopia and Presbyopia Treatment Market Product Developments
Recent years have witnessed significant product innovations in the Myopia and Presbyopia Treatment Market, including advanced contact lenses with features like multifocality and scleral lenses, refined surgical techniques minimizing invasiveness and recovery time, and novel ophthalmic medications with improved efficacy and safety profiles. These advancements address the growing demand for effective, convenient, and less invasive treatment options. The development of personalized treatment plans tailored to individual needs further enhances market appeal and fosters increased patient satisfaction. The market is witnessing a growing integration of technology, such as AI-powered diagnostic tools and advanced imaging systems, enhancing treatment precision and efficacy.
Report Scope & Segmentation Analysis
This report provides a comprehensive segmentation of the Myopia and Presbyopia Treatment Market across disease type (Myopia and Presbyopia) and treatment type (Prescription Lenses, Contact Lenses, Surgery, and Medication). Each segment is analyzed based on market size, growth projections, and competitive dynamics. The report offers a detailed insight into the individual market segments, highlighting the factors driving growth and future trends within each category. For example, the surgery segment is projected to witness faster growth due to technological advancements, while the medication segment is anticipated to grow gradually as innovative treatments gain market traction.
Key Drivers of Myopia and Presbyopia Treatment Market Growth
Several factors are driving the growth of the Myopia and Presbyopia Treatment Market. The increasing prevalence of myopia and presbyopia globally, due to factors like increased screen time and an aging population, is a key driver. Technological advancements in treatment options, including minimally invasive surgeries and advanced contact lenses, are creating demand. Rising disposable incomes and improved healthcare infrastructure in developing economies are contributing to market expansion. Government initiatives promoting eye health and vision correction programs also impact market growth.
Challenges in the Myopia and Presbyopia Treatment Market Sector
The Myopia and Presbyopia Treatment Market faces several challenges, including the high cost of advanced treatments limiting accessibility for a significant portion of the population. Stringent regulatory approvals for new products increase development timelines and costs. Competition from established players and new entrants impacts market share. Supply chain disruptions and fluctuations in raw material costs can pose challenges. Additionally, maintaining patient compliance with long-term treatment regimens for myopia management presents a considerable hurdle.
Emerging Opportunities in Myopia and Presbyopia Treatment Market
The Myopia and Presbyopia Treatment Market presents several emerging opportunities, including the development of personalized treatment strategies tailored to individual patient needs. The growing use of telemedicine and remote patient monitoring offers potential for expanding access to care. Advancements in gene therapy and other innovative technologies offer long-term treatment possibilities. Further exploration and development of non-invasive myopia management techniques hold significant promise. The rising focus on preventive care and early intervention strategies presents opportunities to develop new products and services.
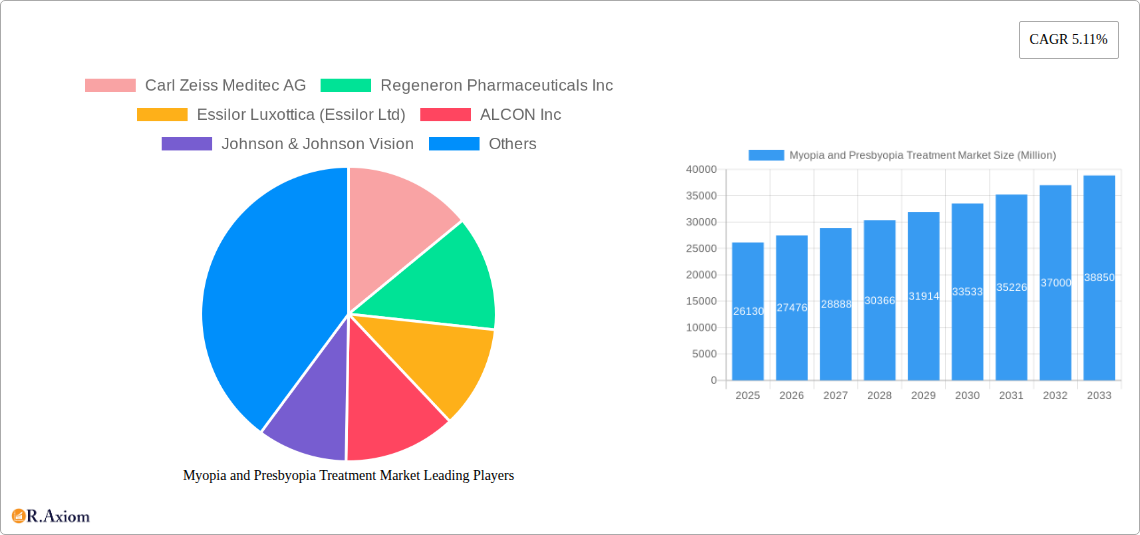
Leading Players in the Myopia and Presbyopia Treatment Market Market
- Carl Zeiss Meditec AG
- Regeneron Pharmaceuticals Inc
- Essilor Luxottica (Essilor Ltd)
- ALCON Inc
- Johnson & Johnson Vision
- Zeimer Ophthalmic Systems AG
- Orasis Pharmaceuticals
- AbbVie
- The Cooper Companies Inc
- Topcon Corporation
- NIDEK CO LTD
- Bausch Health Companies Inc
- Sydnexis
Key Developments in Myopia and Presbyopia Treatment Market Industry
- October 2021: Allergan (AbbVie) receives FDA approval for Vuity (pilocarpine hydrochloride ophthalmic solution) 1.25% for presbyopia treatment. This significantly expands treatment options for presbyopia and introduces a novel medication approach.
- May 2021: Johnson & Johnson Vision receives FDA approval for ACUVUE Abiliti Overnight Therapeutic Lenses for myopia management in children. This launch offers a convenient and non-invasive option for myopia control.
Strategic Outlook for Myopia and Presbyopia Treatment Market Market
The Myopia and Presbyopia Treatment Market is poised for continued growth, driven by technological advancements, increasing prevalence rates, and rising healthcare expenditure. Strategic partnerships, mergers and acquisitions, and expansion into emerging markets will further shape the market landscape. A focus on personalized treatment, preventive care, and the development of innovative technologies will be crucial for success in this dynamic market. The market offers significant opportunities for companies focused on developing effective and affordable treatment solutions.
Myopia and Presbyopia Treatment Market Segmentation
-
1. Disease Type
- 1.1. Myopia
- 1.2. Presbyopia
-
2. Treatment Type
- 2.1. Prescription Lenses
- 2.2. Contact Lenses
- 2.3. Surgery
- 2.4. Medication
Myopia and Presbyopia Treatment Market Segmentation By Geography
-
1. North America
- 1.1. United States
- 1.2. Canada
- 1.3. Mexico
-
2. Europe
- 2.1. Germany
- 2.2. United Kingdom
- 2.3. France
- 2.4. Italy
- 2.5. Spain
- 2.6. Rest of Europe
-
3. Asia Pacific
- 3.1. China
- 3.2. Japan
- 3.3. India
- 3.4. Australia
- 3.5. South Korea
- 3.6. Rest of Asia Pacific
-
4. Middle East and Africa
- 4.1. GCC
- 4.2. South Africa
- 4.3. Rest of Middle East and Africa
-
5. South America
- 5.1. Brazil
- 5.2. Argentina
- 5.3. Rest of South America
Myopia and Presbyopia Treatment Market REPORT HIGHLIGHTS
| Aspects | Details |
|---|---|
| Study Period | 2019-2033 |
| Base Year | 2024 |
| Estimated Year | 2025 |
| Forecast Period | 2025-2033 |
| Historical Period | 2019-2024 |
| Growth Rate | CAGR of 5.11% from 2019-2033 |
| Segmentation |
|
Table of Contents
- 1. Introduction
- 1.1. Research Scope
- 1.2. Market Segmentation
- 1.3. Research Methodology
- 1.4. Definitions and Assumptions
- 2. Executive Summary
- 2.1. Introduction
- 3. Market Dynamics
- 3.1. Introduction
- 3.2. Market Drivers
- 3.2.1. Increasing Cases of Vision Impairment; Rising Geriatric Population
- 3.3. Market Restrains
- 3.3.1. Lack of Early Diagnosis; High Cost of Treatment
- 3.4. Market Trends
- 3.4.1. Myopia is Expected to Hold Significant Market Share in the Disease Type Segment
- 4. Market Factor Analysis
- 4.1. Porters Five Forces
- 4.2. Supply/Value Chain
- 4.3. PESTEL analysis
- 4.4. Market Entropy
- 4.5. Patent/Trademark Analysis
- 5. Global Myopia and Presbyopia Treatment Market Analysis, Insights and Forecast, 2019-2031
- 5.1. Market Analysis, Insights and Forecast - by Disease Type
- 5.1.1. Myopia
- 5.1.2. Presbyopia
- 5.2. Market Analysis, Insights and Forecast - by Treatment Type
- 5.2.1. Prescription Lenses
- 5.2.2. Contact Lenses
- 5.2.3. Surgery
- 5.2.4. Medication
- 5.3. Market Analysis, Insights and Forecast - by Region
- 5.3.1. North America
- 5.3.2. Europe
- 5.3.3. Asia Pacific
- 5.3.4. Middle East and Africa
- 5.3.5. South America
- 5.1. Market Analysis, Insights and Forecast - by Disease Type
- 6. North America Myopia and Presbyopia Treatment Market Analysis, Insights and Forecast, 2019-2031
- 6.1. Market Analysis, Insights and Forecast - by Disease Type
- 6.1.1. Myopia
- 6.1.2. Presbyopia
- 6.2. Market Analysis, Insights and Forecast - by Treatment Type
- 6.2.1. Prescription Lenses
- 6.2.2. Contact Lenses
- 6.2.3. Surgery
- 6.2.4. Medication
- 6.1. Market Analysis, Insights and Forecast - by Disease Type
- 7. Europe Myopia and Presbyopia Treatment Market Analysis, Insights and Forecast, 2019-2031
- 7.1. Market Analysis, Insights and Forecast - by Disease Type
- 7.1.1. Myopia
- 7.1.2. Presbyopia
- 7.2. Market Analysis, Insights and Forecast - by Treatment Type
- 7.2.1. Prescription Lenses
- 7.2.2. Contact Lenses
- 7.2.3. Surgery
- 7.2.4. Medication
- 7.1. Market Analysis, Insights and Forecast - by Disease Type
- 8. Asia Pacific Myopia and Presbyopia Treatment Market Analysis, Insights and Forecast, 2019-2031
- 8.1. Market Analysis, Insights and Forecast - by Disease Type
- 8.1.1. Myopia
- 8.1.2. Presbyopia
- 8.2. Market Analysis, Insights and Forecast - by Treatment Type
- 8.2.1. Prescription Lenses
- 8.2.2. Contact Lenses
- 8.2.3. Surgery
- 8.2.4. Medication
- 8.1. Market Analysis, Insights and Forecast - by Disease Type
- 9. Middle East and Africa Myopia and Presbyopia Treatment Market Analysis, Insights and Forecast, 2019-2031
- 9.1. Market Analysis, Insights and Forecast - by Disease Type
- 9.1.1. Myopia
- 9.1.2. Presbyopia
- 9.2. Market Analysis, Insights and Forecast - by Treatment Type
- 9.2.1. Prescription Lenses
- 9.2.2. Contact Lenses
- 9.2.3. Surgery
- 9.2.4. Medication
- 9.1. Market Analysis, Insights and Forecast - by Disease Type
- 10. South America Myopia and Presbyopia Treatment Market Analysis, Insights and Forecast, 2019-2031
- 10.1. Market Analysis, Insights and Forecast - by Disease Type
- 10.1.1. Myopia
- 10.1.2. Presbyopia
- 10.2. Market Analysis, Insights and Forecast - by Treatment Type
- 10.2.1. Prescription Lenses
- 10.2.2. Contact Lenses
- 10.2.3. Surgery
- 10.2.4. Medication
- 10.1. Market Analysis, Insights and Forecast - by Disease Type
- 11. North America Myopia and Presbyopia Treatment Market Analysis, Insights and Forecast, 2019-2031
- 11.1. Market Analysis, Insights and Forecast - By Country/Sub-region
- 11.1.1 United States
- 11.1.2 Canada
- 11.1.3 Mexico
- 12. Europe Myopia and Presbyopia Treatment Market Analysis, Insights and Forecast, 2019-2031
- 12.1. Market Analysis, Insights and Forecast - By Country/Sub-region
- 12.1.1 Germany
- 12.1.2 United Kingdom
- 12.1.3 France
- 12.1.4 Italy
- 12.1.5 Spain
- 12.1.6 Rest of Europe
- 13. Asia Pacific Myopia and Presbyopia Treatment Market Analysis, Insights and Forecast, 2019-2031
- 13.1. Market Analysis, Insights and Forecast - By Country/Sub-region
- 13.1.1 China
- 13.1.2 Japan
- 13.1.3 India
- 13.1.4 Australia
- 13.1.5 South Korea
- 13.1.6 Rest of Asia Pacific
- 14. Middle East and Africa Myopia and Presbyopia Treatment Market Analysis, Insights and Forecast, 2019-2031
- 14.1. Market Analysis, Insights and Forecast - By Country/Sub-region
- 14.1.1 GCC
- 14.1.2 South Africa
- 14.1.3 Rest of Middle East and Africa
- 15. South America Myopia and Presbyopia Treatment Market Analysis, Insights and Forecast, 2019-2031
- 15.1. Market Analysis, Insights and Forecast - By Country/Sub-region
- 15.1.1 Brazil
- 15.1.2 Argentina
- 15.1.3 Rest of South America
- 16. Competitive Analysis
- 16.1. Global Market Share Analysis 2024
- 16.2. Company Profiles
- 16.2.1 Carl Zeiss Meditec AG
- 16.2.1.1. Overview
- 16.2.1.2. Products
- 16.2.1.3. SWOT Analysis
- 16.2.1.4. Recent Developments
- 16.2.1.5. Financials (Based on Availability)
- 16.2.2 Regeneron Pharmaceuticals Inc
- 16.2.2.1. Overview
- 16.2.2.2. Products
- 16.2.2.3. SWOT Analysis
- 16.2.2.4. Recent Developments
- 16.2.2.5. Financials (Based on Availability)
- 16.2.3 Essilor Luxottica (Essilor Ltd)
- 16.2.3.1. Overview
- 16.2.3.2. Products
- 16.2.3.3. SWOT Analysis
- 16.2.3.4. Recent Developments
- 16.2.3.5. Financials (Based on Availability)
- 16.2.4 ALCON Inc
- 16.2.4.1. Overview
- 16.2.4.2. Products
- 16.2.4.3. SWOT Analysis
- 16.2.4.4. Recent Developments
- 16.2.4.5. Financials (Based on Availability)
- 16.2.5 Johnson & Johnson Vision
- 16.2.5.1. Overview
- 16.2.5.2. Products
- 16.2.5.3. SWOT Analysis
- 16.2.5.4. Recent Developments
- 16.2.5.5. Financials (Based on Availability)
- 16.2.6 Zeimer Ophthalmic Systems AG
- 16.2.6.1. Overview
- 16.2.6.2. Products
- 16.2.6.3. SWOT Analysis
- 16.2.6.4. Recent Developments
- 16.2.6.5. Financials (Based on Availability)
- 16.2.7 Orasis Pharmaceuticals
- 16.2.7.1. Overview
- 16.2.7.2. Products
- 16.2.7.3. SWOT Analysis
- 16.2.7.4. Recent Developments
- 16.2.7.5. Financials (Based on Availability)
- 16.2.8 AbbVie
- 16.2.8.1. Overview
- 16.2.8.2. Products
- 16.2.8.3. SWOT Analysis
- 16.2.8.4. Recent Developments
- 16.2.8.5. Financials (Based on Availability)
- 16.2.9 The Cooper Companies Inc
- 16.2.9.1. Overview
- 16.2.9.2. Products
- 16.2.9.3. SWOT Analysis
- 16.2.9.4. Recent Developments
- 16.2.9.5. Financials (Based on Availability)
- 16.2.10 Topcon Corporation
- 16.2.10.1. Overview
- 16.2.10.2. Products
- 16.2.10.3. SWOT Analysis
- 16.2.10.4. Recent Developments
- 16.2.10.5. Financials (Based on Availability)
- 16.2.11 NIDEK CO LTD
- 16.2.11.1. Overview
- 16.2.11.2. Products
- 16.2.11.3. SWOT Analysis
- 16.2.11.4. Recent Developments
- 16.2.11.5. Financials (Based on Availability)
- 16.2.12 Bausch Health Companies Inc
- 16.2.12.1. Overview
- 16.2.12.2. Products
- 16.2.12.3. SWOT Analysis
- 16.2.12.4. Recent Developments
- 16.2.12.5. Financials (Based on Availability)
- 16.2.13 Sydnexis
- 16.2.13.1. Overview
- 16.2.13.2. Products
- 16.2.13.3. SWOT Analysis
- 16.2.13.4. Recent Developments
- 16.2.13.5. Financials (Based on Availability)
- 16.2.1 Carl Zeiss Meditec AG
List of Figures
- Figure 1: Global Myopia and Presbyopia Treatment Market Revenue Breakdown (Million, %) by Region 2024 & 2032
- Figure 2: Global Myopia and Presbyopia Treatment Market Volume Breakdown (K Unit, %) by Region 2024 & 2032
- Figure 3: North America Myopia and Presbyopia Treatment Market Revenue (Million), by Country 2024 & 2032
- Figure 4: North America Myopia and Presbyopia Treatment Market Volume (K Unit), by Country 2024 & 2032
- Figure 5: North America Myopia and Presbyopia Treatment Market Revenue Share (%), by Country 2024 & 2032
- Figure 6: North America Myopia and Presbyopia Treatment Market Volume Share (%), by Country 2024 & 2032
- Figure 7: Europe Myopia and Presbyopia Treatment Market Revenue (Million), by Country 2024 & 2032
- Figure 8: Europe Myopia and Presbyopia Treatment Market Volume (K Unit), by Country 2024 & 2032
- Figure 9: Europe Myopia and Presbyopia Treatment Market Revenue Share (%), by Country 2024 & 2032
- Figure 10: Europe Myopia and Presbyopia Treatment Market Volume Share (%), by Country 2024 & 2032
- Figure 11: Asia Pacific Myopia and Presbyopia Treatment Market Revenue (Million), by Country 2024 & 2032
- Figure 12: Asia Pacific Myopia and Presbyopia Treatment Market Volume (K Unit), by Country 2024 & 2032
- Figure 13: Asia Pacific Myopia and Presbyopia Treatment Market Revenue Share (%), by Country 2024 & 2032
- Figure 14: Asia Pacific Myopia and Presbyopia Treatment Market Volume Share (%), by Country 2024 & 2032
- Figure 15: Middle East and Africa Myopia and Presbyopia Treatment Market Revenue (Million), by Country 2024 & 2032
- Figure 16: Middle East and Africa Myopia and Presbyopia Treatment Market Volume (K Unit), by Country 2024 & 2032
- Figure 17: Middle East and Africa Myopia and Presbyopia Treatment Market Revenue Share (%), by Country 2024 & 2032
- Figure 18: Middle East and Africa Myopia and Presbyopia Treatment Market Volume Share (%), by Country 2024 & 2032
- Figure 19: South America Myopia and Presbyopia Treatment Market Revenue (Million), by Country 2024 & 2032
- Figure 20: South America Myopia and Presbyopia Treatment Market Volume (K Unit), by Country 2024 & 2032
- Figure 21: South America Myopia and Presbyopia Treatment Market Revenue Share (%), by Country 2024 & 2032
- Figure 22: South America Myopia and Presbyopia Treatment Market Volume Share (%), by Country 2024 & 2032
- Figure 23: North America Myopia and Presbyopia Treatment Market Revenue (Million), by Disease Type 2024 & 2032
- Figure 24: North America Myopia and Presbyopia Treatment Market Volume (K Unit), by Disease Type 2024 & 2032
- Figure 25: North America Myopia and Presbyopia Treatment Market Revenue Share (%), by Disease Type 2024 & 2032
- Figure 26: North America Myopia and Presbyopia Treatment Market Volume Share (%), by Disease Type 2024 & 2032
- Figure 27: North America Myopia and Presbyopia Treatment Market Revenue (Million), by Treatment Type 2024 & 2032
- Figure 28: North America Myopia and Presbyopia Treatment Market Volume (K Unit), by Treatment Type 2024 & 2032
- Figure 29: North America Myopia and Presbyopia Treatment Market Revenue Share (%), by Treatment Type 2024 & 2032
- Figure 30: North America Myopia and Presbyopia Treatment Market Volume Share (%), by Treatment Type 2024 & 2032
- Figure 31: North America Myopia and Presbyopia Treatment Market Revenue (Million), by Country 2024 & 2032
- Figure 32: North America Myopia and Presbyopia Treatment Market Volume (K Unit), by Country 2024 & 2032
- Figure 33: North America Myopia and Presbyopia Treatment Market Revenue Share (%), by Country 2024 & 2032
- Figure 34: North America Myopia and Presbyopia Treatment Market Volume Share (%), by Country 2024 & 2032
- Figure 35: Europe Myopia and Presbyopia Treatment Market Revenue (Million), by Disease Type 2024 & 2032
- Figure 36: Europe Myopia and Presbyopia Treatment Market Volume (K Unit), by Disease Type 2024 & 2032
- Figure 37: Europe Myopia and Presbyopia Treatment Market Revenue Share (%), by Disease Type 2024 & 2032
- Figure 38: Europe Myopia and Presbyopia Treatment Market Volume Share (%), by Disease Type 2024 & 2032
- Figure 39: Europe Myopia and Presbyopia Treatment Market Revenue (Million), by Treatment Type 2024 & 2032
- Figure 40: Europe Myopia and Presbyopia Treatment Market Volume (K Unit), by Treatment Type 2024 & 2032
- Figure 41: Europe Myopia and Presbyopia Treatment Market Revenue Share (%), by Treatment Type 2024 & 2032
- Figure 42: Europe Myopia and Presbyopia Treatment Market Volume Share (%), by Treatment Type 2024 & 2032
- Figure 43: Europe Myopia and Presbyopia Treatment Market Revenue (Million), by Country 2024 & 2032
- Figure 44: Europe Myopia and Presbyopia Treatment Market Volume (K Unit), by Country 2024 & 2032
- Figure 45: Europe Myopia and Presbyopia Treatment Market Revenue Share (%), by Country 2024 & 2032
- Figure 46: Europe Myopia and Presbyopia Treatment Market Volume Share (%), by Country 2024 & 2032
- Figure 47: Asia Pacific Myopia and Presbyopia Treatment Market Revenue (Million), by Disease Type 2024 & 2032
- Figure 48: Asia Pacific Myopia and Presbyopia Treatment Market Volume (K Unit), by Disease Type 2024 & 2032
- Figure 49: Asia Pacific Myopia and Presbyopia Treatment Market Revenue Share (%), by Disease Type 2024 & 2032
- Figure 50: Asia Pacific Myopia and Presbyopia Treatment Market Volume Share (%), by Disease Type 2024 & 2032
- Figure 51: Asia Pacific Myopia and Presbyopia Treatment Market Revenue (Million), by Treatment Type 2024 & 2032
- Figure 52: Asia Pacific Myopia and Presbyopia Treatment Market Volume (K Unit), by Treatment Type 2024 & 2032
- Figure 53: Asia Pacific Myopia and Presbyopia Treatment Market Revenue Share (%), by Treatment Type 2024 & 2032
- Figure 54: Asia Pacific Myopia and Presbyopia Treatment Market Volume Share (%), by Treatment Type 2024 & 2032
- Figure 55: Asia Pacific Myopia and Presbyopia Treatment Market Revenue (Million), by Country 2024 & 2032
- Figure 56: Asia Pacific Myopia and Presbyopia Treatment Market Volume (K Unit), by Country 2024 & 2032
- Figure 57: Asia Pacific Myopia and Presbyopia Treatment Market Revenue Share (%), by Country 2024 & 2032
- Figure 58: Asia Pacific Myopia and Presbyopia Treatment Market Volume Share (%), by Country 2024 & 2032
- Figure 59: Middle East and Africa Myopia and Presbyopia Treatment Market Revenue (Million), by Disease Type 2024 & 2032
- Figure 60: Middle East and Africa Myopia and Presbyopia Treatment Market Volume (K Unit), by Disease Type 2024 & 2032
- Figure 61: Middle East and Africa Myopia and Presbyopia Treatment Market Revenue Share (%), by Disease Type 2024 & 2032
- Figure 62: Middle East and Africa Myopia and Presbyopia Treatment Market Volume Share (%), by Disease Type 2024 & 2032
- Figure 63: Middle East and Africa Myopia and Presbyopia Treatment Market Revenue (Million), by Treatment Type 2024 & 2032
- Figure 64: Middle East and Africa Myopia and Presbyopia Treatment Market Volume (K Unit), by Treatment Type 2024 & 2032
- Figure 65: Middle East and Africa Myopia and Presbyopia Treatment Market Revenue Share (%), by Treatment Type 2024 & 2032
- Figure 66: Middle East and Africa Myopia and Presbyopia Treatment Market Volume Share (%), by Treatment Type 2024 & 2032
- Figure 67: Middle East and Africa Myopia and Presbyopia Treatment Market Revenue (Million), by Country 2024 & 2032
- Figure 68: Middle East and Africa Myopia and Presbyopia Treatment Market Volume (K Unit), by Country 2024 & 2032
- Figure 69: Middle East and Africa Myopia and Presbyopia Treatment Market Revenue Share (%), by Country 2024 & 2032
- Figure 70: Middle East and Africa Myopia and Presbyopia Treatment Market Volume Share (%), by Country 2024 & 2032
- Figure 71: South America Myopia and Presbyopia Treatment Market Revenue (Million), by Disease Type 2024 & 2032
- Figure 72: South America Myopia and Presbyopia Treatment Market Volume (K Unit), by Disease Type 2024 & 2032
- Figure 73: South America Myopia and Presbyopia Treatment Market Revenue Share (%), by Disease Type 2024 & 2032
- Figure 74: South America Myopia and Presbyopia Treatment Market Volume Share (%), by Disease Type 2024 & 2032
- Figure 75: South America Myopia and Presbyopia Treatment Market Revenue (Million), by Treatment Type 2024 & 2032
- Figure 76: South America Myopia and Presbyopia Treatment Market Volume (K Unit), by Treatment Type 2024 & 2032
- Figure 77: South America Myopia and Presbyopia Treatment Market Revenue Share (%), by Treatment Type 2024 & 2032
- Figure 78: South America Myopia and Presbyopia Treatment Market Volume Share (%), by Treatment Type 2024 & 2032
- Figure 79: South America Myopia and Presbyopia Treatment Market Revenue (Million), by Country 2024 & 2032
- Figure 80: South America Myopia and Presbyopia Treatment Market Volume (K Unit), by Country 2024 & 2032
- Figure 81: South America Myopia and Presbyopia Treatment Market Revenue Share (%), by Country 2024 & 2032
- Figure 82: South America Myopia and Presbyopia Treatment Market Volume Share (%), by Country 2024 & 2032
List of Tables
- Table 1: Global Myopia and Presbyopia Treatment Market Revenue Million Forecast, by Region 2019 & 2032
- Table 2: Global Myopia and Presbyopia Treatment Market Volume K Unit Forecast, by Region 2019 & 2032
- Table 3: Global Myopia and Presbyopia Treatment Market Revenue Million Forecast, by Disease Type 2019 & 2032
- Table 4: Global Myopia and Presbyopia Treatment Market Volume K Unit Forecast, by Disease Type 2019 & 2032
- Table 5: Global Myopia and Presbyopia Treatment Market Revenue Million Forecast, by Treatment Type 2019 & 2032
- Table 6: Global Myopia and Presbyopia Treatment Market Volume K Unit Forecast, by Treatment Type 2019 & 2032
- Table 7: Global Myopia and Presbyopia Treatment Market Revenue Million Forecast, by Region 2019 & 2032
- Table 8: Global Myopia and Presbyopia Treatment Market Volume K Unit Forecast, by Region 2019 & 2032
- Table 9: Global Myopia and Presbyopia Treatment Market Revenue Million Forecast, by Country 2019 & 2032
- Table 10: Global Myopia and Presbyopia Treatment Market Volume K Unit Forecast, by Country 2019 & 2032
- Table 11: United States Myopia and Presbyopia Treatment Market Revenue (Million) Forecast, by Application 2019 & 2032
- Table 12: United States Myopia and Presbyopia Treatment Market Volume (K Unit) Forecast, by Application 2019 & 2032
- Table 13: Canada Myopia and Presbyopia Treatment Market Revenue (Million) Forecast, by Application 2019 & 2032
- Table 14: Canada Myopia and Presbyopia Treatment Market Volume (K Unit) Forecast, by Application 2019 & 2032
- Table 15: Mexico Myopia and Presbyopia Treatment Market Revenue (Million) Forecast, by Application 2019 & 2032
- Table 16: Mexico Myopia and Presbyopia Treatment Market Volume (K Unit) Forecast, by Application 2019 & 2032
- Table 17: Global Myopia and Presbyopia Treatment Market Revenue Million Forecast, by Country 2019 & 2032
- Table 18: Global Myopia and Presbyopia Treatment Market Volume K Unit Forecast, by Country 2019 & 2032
- Table 19: Germany Myopia and Presbyopia Treatment Market Revenue (Million) Forecast, by Application 2019 & 2032
- Table 20: Germany Myopia and Presbyopia Treatment Market Volume (K Unit) Forecast, by Application 2019 & 2032
- Table 21: United Kingdom Myopia and Presbyopia Treatment Market Revenue (Million) Forecast, by Application 2019 & 2032
- Table 22: United Kingdom Myopia and Presbyopia Treatment Market Volume (K Unit) Forecast, by Application 2019 & 2032
- Table 23: France Myopia and Presbyopia Treatment Market Revenue (Million) Forecast, by Application 2019 & 2032
- Table 24: France Myopia and Presbyopia Treatment Market Volume (K Unit) Forecast, by Application 2019 & 2032
- Table 25: Italy Myopia and Presbyopia Treatment Market Revenue (Million) Forecast, by Application 2019 & 2032
- Table 26: Italy Myopia and Presbyopia Treatment Market Volume (K Unit) Forecast, by Application 2019 & 2032
- Table 27: Spain Myopia and Presbyopia Treatment Market Revenue (Million) Forecast, by Application 2019 & 2032
- Table 28: Spain Myopia and Presbyopia Treatment Market Volume (K Unit) Forecast, by Application 2019 & 2032
- Table 29: Rest of Europe Myopia and Presbyopia Treatment Market Revenue (Million) Forecast, by Application 2019 & 2032
- Table 30: Rest of Europe Myopia and Presbyopia Treatment Market Volume (K Unit) Forecast, by Application 2019 & 2032
- Table 31: Global Myopia and Presbyopia Treatment Market Revenue Million Forecast, by Country 2019 & 2032
- Table 32: Global Myopia and Presbyopia Treatment Market Volume K Unit Forecast, by Country 2019 & 2032
- Table 33: China Myopia and Presbyopia Treatment Market Revenue (Million) Forecast, by Application 2019 & 2032
- Table 34: China Myopia and Presbyopia Treatment Market Volume (K Unit) Forecast, by Application 2019 & 2032
- Table 35: Japan Myopia and Presbyopia Treatment Market Revenue (Million) Forecast, by Application 2019 & 2032
- Table 36: Japan Myopia and Presbyopia Treatment Market Volume (K Unit) Forecast, by Application 2019 & 2032
- Table 37: India Myopia and Presbyopia Treatment Market Revenue (Million) Forecast, by Application 2019 & 2032
- Table 38: India Myopia and Presbyopia Treatment Market Volume (K Unit) Forecast, by Application 2019 & 2032
- Table 39: Australia Myopia and Presbyopia Treatment Market Revenue (Million) Forecast, by Application 2019 & 2032
- Table 40: Australia Myopia and Presbyopia Treatment Market Volume (K Unit) Forecast, by Application 2019 & 2032
- Table 41: South Korea Myopia and Presbyopia Treatment Market Revenue (Million) Forecast, by Application 2019 & 2032
- Table 42: South Korea Myopia and Presbyopia Treatment Market Volume (K Unit) Forecast, by Application 2019 & 2032
- Table 43: Rest of Asia Pacific Myopia and Presbyopia Treatment Market Revenue (Million) Forecast, by Application 2019 & 2032
- Table 44: Rest of Asia Pacific Myopia and Presbyopia Treatment Market Volume (K Unit) Forecast, by Application 2019 & 2032
- Table 45: Global Myopia and Presbyopia Treatment Market Revenue Million Forecast, by Country 2019 & 2032
- Table 46: Global Myopia and Presbyopia Treatment Market Volume K Unit Forecast, by Country 2019 & 2032
- Table 47: GCC Myopia and Presbyopia Treatment Market Revenue (Million) Forecast, by Application 2019 & 2032
- Table 48: GCC Myopia and Presbyopia Treatment Market Volume (K Unit) Forecast, by Application 2019 & 2032
- Table 49: South Africa Myopia and Presbyopia Treatment Market Revenue (Million) Forecast, by Application 2019 & 2032
- Table 50: South Africa Myopia and Presbyopia Treatment Market Volume (K Unit) Forecast, by Application 2019 & 2032
- Table 51: Rest of Middle East and Africa Myopia and Presbyopia Treatment Market Revenue (Million) Forecast, by Application 2019 & 2032
- Table 52: Rest of Middle East and Africa Myopia and Presbyopia Treatment Market Volume (K Unit) Forecast, by Application 2019 & 2032
- Table 53: Global Myopia and Presbyopia Treatment Market Revenue Million Forecast, by Country 2019 & 2032
- Table 54: Global Myopia and Presbyopia Treatment Market Volume K Unit Forecast, by Country 2019 & 2032
- Table 55: Brazil Myopia and Presbyopia Treatment Market Revenue (Million) Forecast, by Application 2019 & 2032
- Table 56: Brazil Myopia and Presbyopia Treatment Market Volume (K Unit) Forecast, by Application 2019 & 2032
- Table 57: Argentina Myopia and Presbyopia Treatment Market Revenue (Million) Forecast, by Application 2019 & 2032
- Table 58: Argentina Myopia and Presbyopia Treatment Market Volume (K Unit) Forecast, by Application 2019 & 2032
- Table 59: Rest of South America Myopia and Presbyopia Treatment Market Revenue (Million) Forecast, by Application 2019 & 2032
- Table 60: Rest of South America Myopia and Presbyopia Treatment Market Volume (K Unit) Forecast, by Application 2019 & 2032
- Table 61: Global Myopia and Presbyopia Treatment Market Revenue Million Forecast, by Disease Type 2019 & 2032
- Table 62: Global Myopia and Presbyopia Treatment Market Volume K Unit Forecast, by Disease Type 2019 & 2032
- Table 63: Global Myopia and Presbyopia Treatment Market Revenue Million Forecast, by Treatment Type 2019 & 2032
- Table 64: Global Myopia and Presbyopia Treatment Market Volume K Unit Forecast, by Treatment Type 2019 & 2032
- Table 65: Global Myopia and Presbyopia Treatment Market Revenue Million Forecast, by Country 2019 & 2032
- Table 66: Global Myopia and Presbyopia Treatment Market Volume K Unit Forecast, by Country 2019 & 2032
- Table 67: United States Myopia and Presbyopia Treatment Market Revenue (Million) Forecast, by Application 2019 & 2032
- Table 68: United States Myopia and Presbyopia Treatment Market Volume (K Unit) Forecast, by Application 2019 & 2032
- Table 69: Canada Myopia and Presbyopia Treatment Market Revenue (Million) Forecast, by Application 2019 & 2032
- Table 70: Canada Myopia and Presbyopia Treatment Market Volume (K Unit) Forecast, by Application 2019 & 2032
- Table 71: Mexico Myopia and Presbyopia Treatment Market Revenue (Million) Forecast, by Application 2019 & 2032
- Table 72: Mexico Myopia and Presbyopia Treatment Market Volume (K Unit) Forecast, by Application 2019 & 2032
- Table 73: Global Myopia and Presbyopia Treatment Market Revenue Million Forecast, by Disease Type 2019 & 2032
- Table 74: Global Myopia and Presbyopia Treatment Market Volume K Unit Forecast, by Disease Type 2019 & 2032
- Table 75: Global Myopia and Presbyopia Treatment Market Revenue Million Forecast, by Treatment Type 2019 & 2032
- Table 76: Global Myopia and Presbyopia Treatment Market Volume K Unit Forecast, by Treatment Type 2019 & 2032
- Table 77: Global Myopia and Presbyopia Treatment Market Revenue Million Forecast, by Country 2019 & 2032
- Table 78: Global Myopia and Presbyopia Treatment Market Volume K Unit Forecast, by Country 2019 & 2032
- Table 79: Germany Myopia and Presbyopia Treatment Market Revenue (Million) Forecast, by Application 2019 & 2032
- Table 80: Germany Myopia and Presbyopia Treatment Market Volume (K Unit) Forecast, by Application 2019 & 2032
- Table 81: United Kingdom Myopia and Presbyopia Treatment Market Revenue (Million) Forecast, by Application 2019 & 2032
- Table 82: United Kingdom Myopia and Presbyopia Treatment Market Volume (K Unit) Forecast, by Application 2019 & 2032
- Table 83: France Myopia and Presbyopia Treatment Market Revenue (Million) Forecast, by Application 2019 & 2032
- Table 84: France Myopia and Presbyopia Treatment Market Volume (K Unit) Forecast, by Application 2019 & 2032
- Table 85: Italy Myopia and Presbyopia Treatment Market Revenue (Million) Forecast, by Application 2019 & 2032
- Table 86: Italy Myopia and Presbyopia Treatment Market Volume (K Unit) Forecast, by Application 2019 & 2032
- Table 87: Spain Myopia and Presbyopia Treatment Market Revenue (Million) Forecast, by Application 2019 & 2032
- Table 88: Spain Myopia and Presbyopia Treatment Market Volume (K Unit) Forecast, by Application 2019 & 2032
- Table 89: Rest of Europe Myopia and Presbyopia Treatment Market Revenue (Million) Forecast, by Application 2019 & 2032
- Table 90: Rest of Europe Myopia and Presbyopia Treatment Market Volume (K Unit) Forecast, by Application 2019 & 2032
- Table 91: Global Myopia and Presbyopia Treatment Market Revenue Million Forecast, by Disease Type 2019 & 2032
- Table 92: Global Myopia and Presbyopia Treatment Market Volume K Unit Forecast, by Disease Type 2019 & 2032
- Table 93: Global Myopia and Presbyopia Treatment Market Revenue Million Forecast, by Treatment Type 2019 & 2032
- Table 94: Global Myopia and Presbyopia Treatment Market Volume K Unit Forecast, by Treatment Type 2019 & 2032
- Table 95: Global Myopia and Presbyopia Treatment Market Revenue Million Forecast, by Country 2019 & 2032
- Table 96: Global Myopia and Presbyopia Treatment Market Volume K Unit Forecast, by Country 2019 & 2032
- Table 97: China Myopia and Presbyopia Treatment Market Revenue (Million) Forecast, by Application 2019 & 2032
- Table 98: China Myopia and Presbyopia Treatment Market Volume (K Unit) Forecast, by Application 2019 & 2032
- Table 99: Japan Myopia and Presbyopia Treatment Market Revenue (Million) Forecast, by Application 2019 & 2032
- Table 100: Japan Myopia and Presbyopia Treatment Market Volume (K Unit) Forecast, by Application 2019 & 2032
- Table 101: India Myopia and Presbyopia Treatment Market Revenue (Million) Forecast, by Application 2019 & 2032
- Table 102: India Myopia and Presbyopia Treatment Market Volume (K Unit) Forecast, by Application 2019 & 2032
- Table 103: Australia Myopia and Presbyopia Treatment Market Revenue (Million) Forecast, by Application 2019 & 2032
- Table 104: Australia Myopia and Presbyopia Treatment Market Volume (K Unit) Forecast, by Application 2019 & 2032
- Table 105: South Korea Myopia and Presbyopia Treatment Market Revenue (Million) Forecast, by Application 2019 & 2032
- Table 106: South Korea Myopia and Presbyopia Treatment Market Volume (K Unit) Forecast, by Application 2019 & 2032
- Table 107: Rest of Asia Pacific Myopia and Presbyopia Treatment Market Revenue (Million) Forecast, by Application 2019 & 2032
- Table 108: Rest of Asia Pacific Myopia and Presbyopia Treatment Market Volume (K Unit) Forecast, by Application 2019 & 2032
- Table 109: Global Myopia and Presbyopia Treatment Market Revenue Million Forecast, by Disease Type 2019 & 2032
- Table 110: Global Myopia and Presbyopia Treatment Market Volume K Unit Forecast, by Disease Type 2019 & 2032
- Table 111: Global Myopia and Presbyopia Treatment Market Revenue Million Forecast, by Treatment Type 2019 & 2032
- Table 112: Global Myopia and Presbyopia Treatment Market Volume K Unit Forecast, by Treatment Type 2019 & 2032
- Table 113: Global Myopia and Presbyopia Treatment Market Revenue Million Forecast, by Country 2019 & 2032
- Table 114: Global Myopia and Presbyopia Treatment Market Volume K Unit Forecast, by Country 2019 & 2032
- Table 115: GCC Myopia and Presbyopia Treatment Market Revenue (Million) Forecast, by Application 2019 & 2032
- Table 116: GCC Myopia and Presbyopia Treatment Market Volume (K Unit) Forecast, by Application 2019 & 2032
- Table 117: South Africa Myopia and Presbyopia Treatment Market Revenue (Million) Forecast, by Application 2019 & 2032
- Table 118: South Africa Myopia and Presbyopia Treatment Market Volume (K Unit) Forecast, by Application 2019 & 2032
- Table 119: Rest of Middle East and Africa Myopia and Presbyopia Treatment Market Revenue (Million) Forecast, by Application 2019 & 2032
- Table 120: Rest of Middle East and Africa Myopia and Presbyopia Treatment Market Volume (K Unit) Forecast, by Application 2019 & 2032
- Table 121: Global Myopia and Presbyopia Treatment Market Revenue Million Forecast, by Disease Type 2019 & 2032
- Table 122: Global Myopia and Presbyopia Treatment Market Volume K Unit Forecast, by Disease Type 2019 & 2032
- Table 123: Global Myopia and Presbyopia Treatment Market Revenue Million Forecast, by Treatment Type 2019 & 2032
- Table 124: Global Myopia and Presbyopia Treatment Market Volume K Unit Forecast, by Treatment Type 2019 & 2032
- Table 125: Global Myopia and Presbyopia Treatment Market Revenue Million Forecast, by Country 2019 & 2032
- Table 126: Global Myopia and Presbyopia Treatment Market Volume K Unit Forecast, by Country 2019 & 2032
- Table 127: Brazil Myopia and Presbyopia Treatment Market Revenue (Million) Forecast, by Application 2019 & 2032
- Table 128: Brazil Myopia and Presbyopia Treatment Market Volume (K Unit) Forecast, by Application 2019 & 2032
- Table 129: Argentina Myopia and Presbyopia Treatment Market Revenue (Million) Forecast, by Application 2019 & 2032
- Table 130: Argentina Myopia and Presbyopia Treatment Market Volume (K Unit) Forecast, by Application 2019 & 2032
- Table 131: Rest of South America Myopia and Presbyopia Treatment Market Revenue (Million) Forecast, by Application 2019 & 2032
- Table 132: Rest of South America Myopia and Presbyopia Treatment Market Volume (K Unit) Forecast, by Application 2019 & 2032
Frequently Asked Questions
1. What is the projected Compound Annual Growth Rate (CAGR) of the Myopia and Presbyopia Treatment Market?
The projected CAGR is approximately 5.11%.
2. Which companies are prominent players in the Myopia and Presbyopia Treatment Market?
Key companies in the market include Carl Zeiss Meditec AG, Regeneron Pharmaceuticals Inc, Essilor Luxottica (Essilor Ltd), ALCON Inc, Johnson & Johnson Vision, Zeimer Ophthalmic Systems AG, Orasis Pharmaceuticals, AbbVie, The Cooper Companies Inc , Topcon Corporation, NIDEK CO LTD, Bausch Health Companies Inc, Sydnexis.
3. What are the main segments of the Myopia and Presbyopia Treatment Market?
The market segments include Disease Type, Treatment Type.
4. Can you provide details about the market size?
The market size is estimated to be USD 26.13 Million as of 2022.
5. What are some drivers contributing to market growth?
Increasing Cases of Vision Impairment; Rising Geriatric Population.
6. What are the notable trends driving market growth?
Myopia is Expected to Hold Significant Market Share in the Disease Type Segment.
7. Are there any restraints impacting market growth?
Lack of Early Diagnosis; High Cost of Treatment.
8. Can you provide examples of recent developments in the market?
In October 2021, Allergan, a subsidiary of AbbVie, received approval from the Food and Drug Administration for Vuity (pilocarpine hydrochloric acid ophthalmic solution) 1.25% for the treatment of presbyopia, also known as age-related blurry near vision, in adults.
9. What pricing options are available for accessing the report?
Pricing options include single-user, multi-user, and enterprise licenses priced at USD 4750, USD 5250, and USD 8750 respectively.
10. Is the market size provided in terms of value or volume?
The market size is provided in terms of value, measured in Million and volume, measured in K Unit.
11. Are there any specific market keywords associated with the report?
Yes, the market keyword associated with the report is "Myopia and Presbyopia Treatment Market," which aids in identifying and referencing the specific market segment covered.
12. How do I determine which pricing option suits my needs best?
The pricing options vary based on user requirements and access needs. Individual users may opt for single-user licenses, while businesses requiring broader access may choose multi-user or enterprise licenses for cost-effective access to the report.
13. Are there any additional resources or data provided in the Myopia and Presbyopia Treatment Market report?
While the report offers comprehensive insights, it's advisable to review the specific contents or supplementary materials provided to ascertain if additional resources or data are available.
14. How can I stay updated on further developments or reports in the Myopia and Presbyopia Treatment Market?
To stay informed about further developments, trends, and reports in the Myopia and Presbyopia Treatment Market, consider subscribing to industry newsletters, following relevant companies and organizations, or regularly checking reputable industry news sources and publications.
Methodology
Step 1 - Identification of Relevant Samples Size from Population Database


Step 2 - Approaches for Defining Global Market Size (Value, Volume* & Price*)

Note*: In applicable scenarios
Step 3 - Data Sources
Primary Research
- Web Analytics
- Survey Reports
- Research Institute
- Latest Research Reports
- Opinion Leaders
Secondary Research
- Annual Reports
- White Paper
- Latest Press Release
- Industry Association
- Paid Database
- Investor Presentations

Step 4 - Data Triangulation
Involves using different sources of information in order to increase the validity of a study
These sources are likely to be stakeholders in a program - participants, other researchers, program staff, other community members, and so on.
Then we put all data in single framework & apply various statistical tools to find out the dynamic on the market.
During the analysis stage, feedback from the stakeholder groups would be compared to determine areas of agreement as well as areas of divergence


