
Key Insights
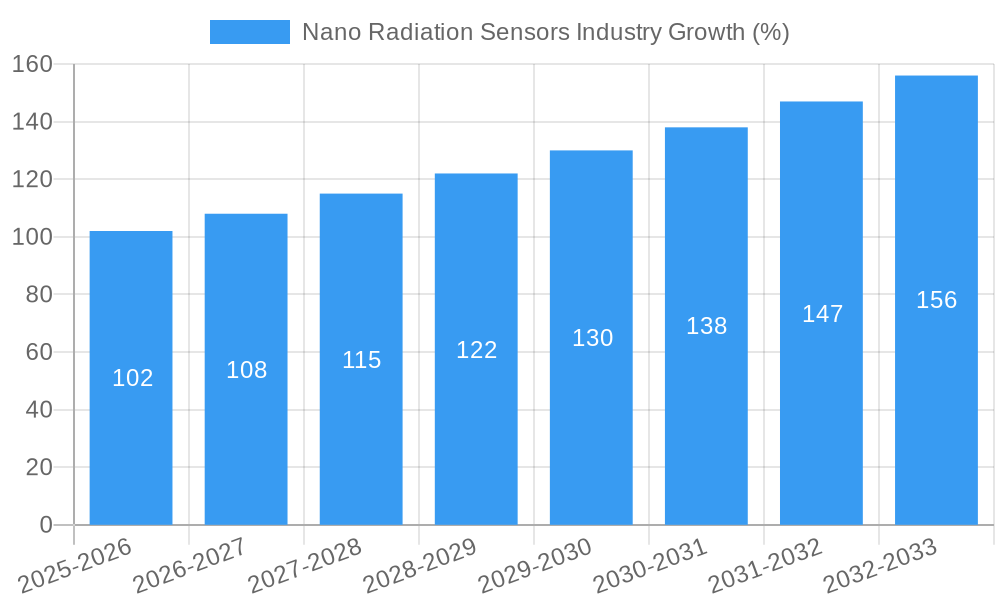
The nano radiation sensor market is experiencing robust growth, projected to reach a significant market size driven by increasing demand across diverse sectors. A compound annual growth rate (CAGR) of 6.72% from 2019 to 2024 indicates a healthy expansion trajectory. The market's segmentation reveals strong performance across applications like automotive (driven by advancements in autonomous driving and safety systems), healthcare (for medical imaging and radiation therapy monitoring), and industrial settings (for process control and safety monitoring). The prevalent detector types are scintillation and solid-state detectors, each catering to specific application needs based on sensitivity, cost-effectiveness, and operational requirements. Leading companies like Hamamatsu Photonics, Thermo Fisher Scientific, and Robert Bosch are at the forefront of innovation and market share, continuously developing advanced sensor technologies to meet evolving industry demands. Geographic distribution shows substantial market presence in North America and Europe, followed by rapidly growing markets in the Asia-Pacific region, particularly China and India, fueled by increasing industrialization and technological advancements. The market is expected to witness further growth due to ongoing research and development in materials science, leading to enhanced sensor performance and miniaturization. Challenges such as the high cost of certain advanced sensor technologies and the need for stringent regulatory compliance continue to shape the market landscape.
The forecast period of 2025-2033 anticipates continued expansion, driven by factors such as increasing government investments in research and development, stringent safety regulations across various industries, and the rising demand for high-precision radiation detection solutions. The market is expected to witness increased adoption of IoT-integrated nano radiation sensors, enabling real-time data acquisition and remote monitoring, further expanding its reach across diverse sectors. Competitive intensity is likely to remain high, with existing players focusing on strategic partnerships, acquisitions, and technological advancements to maintain a strong market position. The emergence of new materials and improved manufacturing processes will contribute to cost reductions and further market penetration across a broader range of applications. Overall, the future outlook for the nano radiation sensor market remains promising, with significant potential for growth and innovation in the coming years.
Nano Radiation Sensors Industry: A Comprehensive Market Report (2019-2033)
This comprehensive report provides a detailed analysis of the global Nano Radiation Sensors industry, offering invaluable insights for stakeholders across the value chain. The study covers the period from 2019 to 2033, with 2025 serving as the base and estimated year. The report meticulously examines market dynamics, competitive landscapes, and future growth trajectories, empowering businesses to make informed strategic decisions. The market is valued at xx Million in 2025 and is projected to reach xx Million by 2033, exhibiting a CAGR of xx% during the forecast period (2025-2033).
Nano Radiation Sensors Industry Market Concentration & Innovation
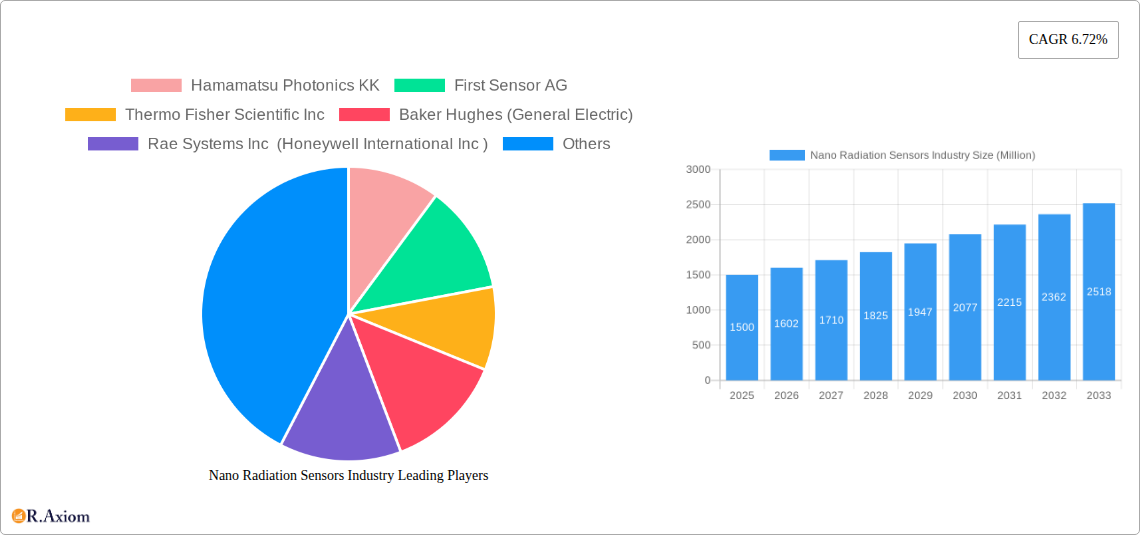
The Nano Radiation Sensors market exhibits a moderately concentrated landscape, with key players such as Hamamatsu Photonics KK, First Sensor AG, Thermo Fisher Scientific Inc, and others holding significant market share. The exact market share distribution for 2025 is currently under analysis, but preliminary data suggests that the top 5 players account for approximately xx% of the global market. Innovation is a crucial driver, fueled by advancements in materials science, miniaturization techniques, and increasing demand for high-sensitivity, low-power radiation detection across diverse applications.
Regulatory frameworks, particularly those concerning radiation safety and environmental protection, play a significant role in shaping market dynamics. The presence of substitute technologies, such as traditional radiation detectors, creates competitive pressure, prompting continuous innovation in nano-scale sensors to enhance performance and cost-effectiveness. End-user trends, including the growing adoption of radiation sensors in healthcare, automotive, and industrial applications, are driving market growth. Mergers and acquisitions (M&A) activity has been relatively modest in recent years, with deal values averaging xx Million per transaction, but this is expected to increase in the near future as competition intensifies. Significant M&A activity could lead to increased market consolidation.
Nano Radiation Sensors Industry Industry Trends & Insights
The Nano Radiation Sensors market is experiencing robust growth, primarily driven by the increasing demand for accurate and reliable radiation detection across various sectors. Technological advancements, such as the development of novel nanomaterials with superior sensitivity and selectivity, are significantly boosting market penetration. Consumer preferences are shifting towards smaller, more energy-efficient, and cost-effective radiation sensors, further fueling market expansion. The market's competitive dynamics are characterized by intense competition among established players and emerging startups, leading to continuous product innovation and price optimization. The global market is anticipated to experience significant expansion over the forecast period, with a projected CAGR of xx%, driven by the factors mentioned above. The market penetration rate is currently estimated at xx% and is projected to reach xx% by 2033.
Dominant Markets & Segments in Nano Radiation Sensors Industry
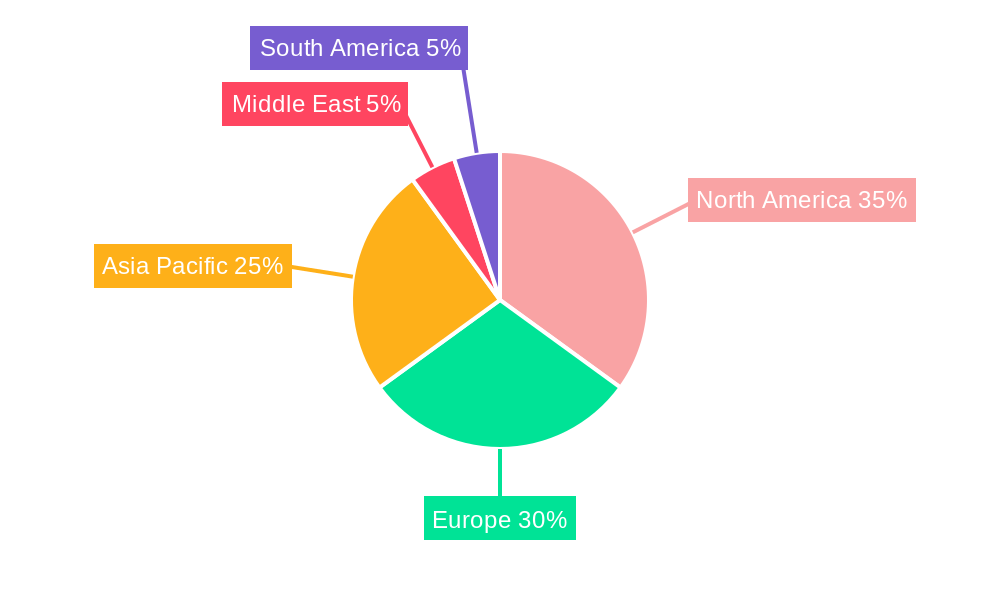
The Industrial application segment currently holds the largest market share within the Nano Radiation Sensors industry, driven by the increasing adoption of radiation sensors in various industrial processes, particularly in quality control and safety monitoring. The Healthcare segment is expected to experience significant growth over the forecast period, owing to the increasing use of radiation sensors in medical imaging and radiation therapy. Geographically, North America and Europe are currently the dominant markets, benefiting from well-established healthcare and industrial sectors, robust R&D infrastructure, and favorable regulatory environments.
Key Drivers for Industrial Segment Dominance:
- Stringent safety regulations in industrial settings.
- Growing automation and process optimization in manufacturing.
- Increased demand for real-time radiation monitoring.
Key Drivers for Healthcare Segment Growth:
- Rising prevalence of cancer and other radiation-related diseases.
- Advancements in medical imaging techniques.
- Growing demand for precise radiation therapy.
Key Drivers for North America and Europe Dominance:
- High disposable incomes.
- Advanced technological infrastructure.
- Stringent environmental regulations.
Among the types, Solid-state Detectors are currently the leading segment, owing to their advantages in terms of size, cost, and durability. However, Scintillation Detectors are anticipated to witness strong growth, driven by their superior sensitivity in certain applications.
Nano Radiation Sensors Industry Product Developments
Recent product developments in the nano radiation sensors market focus on enhancing sensitivity, reducing power consumption, and improving the integration capabilities of these sensors into existing systems. Miniaturization techniques and the use of advanced nanomaterials are key technological trends driving innovation. New applications are constantly emerging, particularly in the fields of environmental monitoring, security, and space exploration. The market is seeing a trend towards the development of sensors that can detect a wider range of radiation types, offering improved versatility and functionality. This focus on innovation ensures the sensors are well-suited to a variety of applications and needs.
Report Scope & Segmentation Analysis
This report segments the Nano Radiation Sensors market by Type (Scintillation Detectors, Solid-state Detectors) and Application (Automotive, Consumer Electronics, Healthcare, Industrial, Oil and Gas, Power Generation, Other Applications). Each segment is analyzed in detail, providing market size, growth projections, and competitive dynamics. The solid-state detectors segment is growing rapidly due to advancements in material science and manufacturing processes. The healthcare application segment is witnessing significant traction due to its use in radiation therapy and medical imaging.
Key Drivers of Nano Radiation Sensors Industry Growth
Several factors are driving the growth of the nano radiation sensors market. Technological advancements, particularly in nanomaterials and sensor fabrication techniques, are leading to improved sensor performance and reduced costs. The increasing demand for radiation detection in various industries, such as healthcare, industrial, and environmental monitoring, is boosting market growth. Favorable government regulations and funding for research and development in radiation detection technologies are creating further impetus for market expansion.
Challenges in the Nano Radiation Sensors Industry Sector
The nano radiation sensors market faces several challenges. The high cost of development and manufacturing can hinder market penetration. Supply chain complexities, particularly the sourcing of specialized nanomaterials, pose a significant hurdle. Intense competition among established players and new entrants puts pressure on pricing and margins. Furthermore, stringent regulatory requirements related to radiation safety and environmental compliance can impact the market.
Emerging Opportunities in Nano Radiation Sensors Industry
The nano radiation sensors industry presents several emerging opportunities. The development of highly sensitive and selective sensors for detecting low-level radiation holds significant potential. The integration of nano radiation sensors with other technologies, such as IoT and AI, offers scope for the development of smart radiation monitoring systems. New applications in areas like environmental monitoring, food safety, and homeland security are also opening up new avenues for market growth.
Leading Players in the Nano Radiation Sensors Industry Market
- Hamamatsu Photonics KK
- First Sensor AG
- Thermo Fisher Scientific Inc
- Baker Hughes (General Electric)
- Rae Systems Inc (Honeywell International Inc)
- Toshiba Corporation
- Robert Bosch GmbH
- Nihon Kessho Kogaku Co Ltd
- Analog Devices Inc
Key Developments in Nano Radiation Sensors Industry Industry
- January 2023: Thermo Fisher Scientific Inc. launched a new line of high-sensitivity nano radiation sensors for medical imaging applications.
- March 2022: Hamamatsu Photonics KK and First Sensor AG announced a joint venture to develop advanced nano radiation sensor technologies for the industrial sector.
- June 2021: A significant investment was made by several venture capitalists to accelerate the production and distribution of nano radiation sensors, impacting market dynamics. (xx Million USD)
Strategic Outlook for Nano Radiation Sensors Industry Market
The nano radiation sensors market is poised for significant growth in the coming years, driven by technological advancements, increasing demand across various applications, and favorable regulatory environments. The development of highly sensitive, low-power, and cost-effective sensors will be key to further market penetration. Strategic partnerships, mergers and acquisitions, and investment in R&D will play a crucial role in shaping the future of the industry. The market will continue its upward trajectory, with significant opportunities for innovation and market expansion.
Nano Radiation Sensors Industry Segmentation
-
1. Type
- 1.1. Scintillation Detectors
- 1.2. Solid-state Detectors
-
2. Application
- 2.1. Automotive
- 2.2. Consumer Electronics
- 2.3. Healthcare
- 2.4. Industrial
- 2.5. Oil and Gas
- 2.6. Power Generation
- 2.7. Other Applications
Nano Radiation Sensors Industry Segmentation By Geography
-
1. North America
- 1.1. US
- 1.2. Canada
-
2. Europe
- 2.1. Germany
- 2.2. UK
- 2.3. France
- 2.4. Russia
- 2.5. Spain
- 2.6. Italy
- 2.7. Rest of Europe
-
3. Asia Pacific
- 3.1. China
- 3.2. Japan
- 3.3. India
- 3.4. Rest of Asia Pacific
-
4. Latin America
- 4.1. Brazil
- 4.2. Argentina
- 4.3. Mexico
- 4.4. Rest of Latin America
- 5. Middle East
-
6. UAE
- 6.1. Saudi Arabia
- 6.2. South Africa
- 6.3. Rest of Middle East
Nano Radiation Sensors Industry REPORT HIGHLIGHTS
| Aspects | Details |
|---|---|
| Study Period | 2019-2033 |
| Base Year | 2024 |
| Estimated Year | 2025 |
| Forecast Period | 2025-2033 |
| Historical Period | 2019-2024 |
| Growth Rate | CAGR of 6.72% from 2019-2033 |
| Segmentation |
|
Table of Contents
- 1. Introduction
- 1.1. Research Scope
- 1.2. Market Segmentation
- 1.3. Research Methodology
- 1.4. Definitions and Assumptions
- 2. Executive Summary
- 2.1. Introduction
- 3. Market Dynamics
- 3.1. Introduction
- 3.2. Market Drivers
- 3.2.1. ; Growing Trend of Miniaturization Across Various Industries; Advancements in Nanotechnology Supported by Government Regulations
- 3.3. Market Restrains
- 3.3.1. ; Complexity in Manufacturing and Potential Risks Involved in Adopting Radiation Nanosensors
- 3.4. Market Trends
- 3.4.1. Consumer Electronics End User to Account for Largest Share
- 4. Market Factor Analysis
- 4.1. Porters Five Forces
- 4.2. Supply/Value Chain
- 4.3. PESTEL analysis
- 4.4. Market Entropy
- 4.5. Patent/Trademark Analysis
- 5. Global Nano Radiation Sensors Industry Analysis, Insights and Forecast, 2019-2031
- 5.1. Market Analysis, Insights and Forecast - by Type
- 5.1.1. Scintillation Detectors
- 5.1.2. Solid-state Detectors
- 5.2. Market Analysis, Insights and Forecast - by Application
- 5.2.1. Automotive
- 5.2.2. Consumer Electronics
- 5.2.3. Healthcare
- 5.2.4. Industrial
- 5.2.5. Oil and Gas
- 5.2.6. Power Generation
- 5.2.7. Other Applications
- 5.3. Market Analysis, Insights and Forecast - by Region
- 5.3.1. North America
- 5.3.2. Europe
- 5.3.3. Asia Pacific
- 5.3.4. Latin America
- 5.3.5. Middle East
- 5.3.6. UAE
- 5.1. Market Analysis, Insights and Forecast - by Type
- 6. North America Nano Radiation Sensors Industry Analysis, Insights and Forecast, 2019-2031
- 6.1. Market Analysis, Insights and Forecast - by Type
- 6.1.1. Scintillation Detectors
- 6.1.2. Solid-state Detectors
- 6.2. Market Analysis, Insights and Forecast - by Application
- 6.2.1. Automotive
- 6.2.2. Consumer Electronics
- 6.2.3. Healthcare
- 6.2.4. Industrial
- 6.2.5. Oil and Gas
- 6.2.6. Power Generation
- 6.2.7. Other Applications
- 6.1. Market Analysis, Insights and Forecast - by Type
- 7. Europe Nano Radiation Sensors Industry Analysis, Insights and Forecast, 2019-2031
- 7.1. Market Analysis, Insights and Forecast - by Type
- 7.1.1. Scintillation Detectors
- 7.1.2. Solid-state Detectors
- 7.2. Market Analysis, Insights and Forecast - by Application
- 7.2.1. Automotive
- 7.2.2. Consumer Electronics
- 7.2.3. Healthcare
- 7.2.4. Industrial
- 7.2.5. Oil and Gas
- 7.2.6. Power Generation
- 7.2.7. Other Applications
- 7.1. Market Analysis, Insights and Forecast - by Type
- 8. Asia Pacific Nano Radiation Sensors Industry Analysis, Insights and Forecast, 2019-2031
- 8.1. Market Analysis, Insights and Forecast - by Type
- 8.1.1. Scintillation Detectors
- 8.1.2. Solid-state Detectors
- 8.2. Market Analysis, Insights and Forecast - by Application
- 8.2.1. Automotive
- 8.2.2. Consumer Electronics
- 8.2.3. Healthcare
- 8.2.4. Industrial
- 8.2.5. Oil and Gas
- 8.2.6. Power Generation
- 8.2.7. Other Applications
- 8.1. Market Analysis, Insights and Forecast - by Type
- 9. Latin America Nano Radiation Sensors Industry Analysis, Insights and Forecast, 2019-2031
- 9.1. Market Analysis, Insights and Forecast - by Type
- 9.1.1. Scintillation Detectors
- 9.1.2. Solid-state Detectors
- 9.2. Market Analysis, Insights and Forecast - by Application
- 9.2.1. Automotive
- 9.2.2. Consumer Electronics
- 9.2.3. Healthcare
- 9.2.4. Industrial
- 9.2.5. Oil and Gas
- 9.2.6. Power Generation
- 9.2.7. Other Applications
- 9.1. Market Analysis, Insights and Forecast - by Type
- 10. Middle East Nano Radiation Sensors Industry Analysis, Insights and Forecast, 2019-2031
- 10.1. Market Analysis, Insights and Forecast - by Type
- 10.1.1. Scintillation Detectors
- 10.1.2. Solid-state Detectors
- 10.2. Market Analysis, Insights and Forecast - by Application
- 10.2.1. Automotive
- 10.2.2. Consumer Electronics
- 10.2.3. Healthcare
- 10.2.4. Industrial
- 10.2.5. Oil and Gas
- 10.2.6. Power Generation
- 10.2.7. Other Applications
- 10.1. Market Analysis, Insights and Forecast - by Type
- 11. UAE Nano Radiation Sensors Industry Analysis, Insights and Forecast, 2019-2031
- 11.1. Market Analysis, Insights and Forecast - by Type
- 11.1.1. Scintillation Detectors
- 11.1.2. Solid-state Detectors
- 11.2. Market Analysis, Insights and Forecast - by Application
- 11.2.1. Automotive
- 11.2.2. Consumer Electronics
- 11.2.3. Healthcare
- 11.2.4. Industrial
- 11.2.5. Oil and Gas
- 11.2.6. Power Generation
- 11.2.7. Other Applications
- 11.1. Market Analysis, Insights and Forecast - by Type
- 12. North America Nano Radiation Sensors Industry Analysis, Insights and Forecast, 2019-2031
- 12.1. Market Analysis, Insights and Forecast - By Country/Sub-region
- 12.1.1 US
- 12.1.2 Canada
- 13. Europe Nano Radiation Sensors Industry Analysis, Insights and Forecast, 2019-2031
- 13.1. Market Analysis, Insights and Forecast - By Country/Sub-region
- 13.1.1 Germany
- 13.1.2 UK
- 13.1.3 France
- 13.1.4 Russia
- 13.1.5 Spain
- 13.1.6 Italy
- 13.1.7 Rest of Europe
- 14. Asia Pacific Nano Radiation Sensors Industry Analysis, Insights and Forecast, 2019-2031
- 14.1. Market Analysis, Insights and Forecast - By Country/Sub-region
- 14.1.1 China
- 14.1.2 Japan
- 14.1.3 India
- 14.1.4 Rest of Asia Pacific
- 15. Middle East Nano Radiation Sensors Industry Analysis, Insights and Forecast, 2019-2031
- 15.1. Market Analysis, Insights and Forecast - By Country/Sub-region
- 15.1.1 United Arab Emirates
- 15.1.2 Saudi Arabia
- 15.1.3 Qatar
- 15.1.4 Israel
- 15.1.5 Egypt
- 15.1.6 Oman
- 15.1.7 Rest of Middle East
- 16. South America Nano Radiation Sensors Industry Analysis, Insights and Forecast, 2019-2031
- 16.1. Market Analysis, Insights and Forecast - By Country/Sub-region
- 16.1.1 Brazil
- 16.1.2 Argentina
- 16.1.3 Rest of South America
- 17. Competitive Analysis
- 17.1. Global Market Share Analysis 2024
- 17.2. Company Profiles
- 17.2.1 Hamamatsu Photonics KK
- 17.2.1.1. Overview
- 17.2.1.2. Products
- 17.2.1.3. SWOT Analysis
- 17.2.1.4. Recent Developments
- 17.2.1.5. Financials (Based on Availability)
- 17.2.2 First Sensor AG
- 17.2.2.1. Overview
- 17.2.2.2. Products
- 17.2.2.3. SWOT Analysis
- 17.2.2.4. Recent Developments
- 17.2.2.5. Financials (Based on Availability)
- 17.2.3 Thermo Fisher Scientific Inc
- 17.2.3.1. Overview
- 17.2.3.2. Products
- 17.2.3.3. SWOT Analysis
- 17.2.3.4. Recent Developments
- 17.2.3.5. Financials (Based on Availability)
- 17.2.4 Baker Hughes (General Electric)
- 17.2.4.1. Overview
- 17.2.4.2. Products
- 17.2.4.3. SWOT Analysis
- 17.2.4.4. Recent Developments
- 17.2.4.5. Financials (Based on Availability)
- 17.2.5 Rae Systems Inc (Honeywell International Inc )
- 17.2.5.1. Overview
- 17.2.5.2. Products
- 17.2.5.3. SWOT Analysis
- 17.2.5.4. Recent Developments
- 17.2.5.5. Financials (Based on Availability)
- 17.2.6 Toshiba Corporation
- 17.2.6.1. Overview
- 17.2.6.2. Products
- 17.2.6.3. SWOT Analysis
- 17.2.6.4. Recent Developments
- 17.2.6.5. Financials (Based on Availability)
- 17.2.7 Robert Bosch GmbH
- 17.2.7.1. Overview
- 17.2.7.2. Products
- 17.2.7.3. SWOT Analysis
- 17.2.7.4. Recent Developments
- 17.2.7.5. Financials (Based on Availability)
- 17.2.8 Nihon Kessho Kogaku Co Ltd
- 17.2.8.1. Overview
- 17.2.8.2. Products
- 17.2.8.3. SWOT Analysis
- 17.2.8.4. Recent Developments
- 17.2.8.5. Financials (Based on Availability)
- 17.2.9 Analog Devices Inc
- 17.2.9.1. Overview
- 17.2.9.2. Products
- 17.2.9.3. SWOT Analysis
- 17.2.9.4. Recent Developments
- 17.2.9.5. Financials (Based on Availability)
- 17.2.1 Hamamatsu Photonics KK
List of Figures
- Figure 1: Global Nano Radiation Sensors Industry Revenue Breakdown (Million, %) by Region 2024 & 2032
- Figure 2: North America Nano Radiation Sensors Industry Revenue (Million), by Country 2024 & 2032
- Figure 3: North America Nano Radiation Sensors Industry Revenue Share (%), by Country 2024 & 2032
- Figure 4: Europe Nano Radiation Sensors Industry Revenue (Million), by Country 2024 & 2032
- Figure 5: Europe Nano Radiation Sensors Industry Revenue Share (%), by Country 2024 & 2032
- Figure 6: Asia Pacific Nano Radiation Sensors Industry Revenue (Million), by Country 2024 & 2032
- Figure 7: Asia Pacific Nano Radiation Sensors Industry Revenue Share (%), by Country 2024 & 2032
- Figure 8: Middle East Nano Radiation Sensors Industry Revenue (Million), by Country 2024 & 2032
- Figure 9: Middle East Nano Radiation Sensors Industry Revenue Share (%), by Country 2024 & 2032
- Figure 10: South America Nano Radiation Sensors Industry Revenue (Million), by Country 2024 & 2032
- Figure 11: South America Nano Radiation Sensors Industry Revenue Share (%), by Country 2024 & 2032
- Figure 12: North America Nano Radiation Sensors Industry Revenue (Million), by Type 2024 & 2032
- Figure 13: North America Nano Radiation Sensors Industry Revenue Share (%), by Type 2024 & 2032
- Figure 14: North America Nano Radiation Sensors Industry Revenue (Million), by Application 2024 & 2032
- Figure 15: North America Nano Radiation Sensors Industry Revenue Share (%), by Application 2024 & 2032
- Figure 16: North America Nano Radiation Sensors Industry Revenue (Million), by Country 2024 & 2032
- Figure 17: North America Nano Radiation Sensors Industry Revenue Share (%), by Country 2024 & 2032
- Figure 18: Europe Nano Radiation Sensors Industry Revenue (Million), by Type 2024 & 2032
- Figure 19: Europe Nano Radiation Sensors Industry Revenue Share (%), by Type 2024 & 2032
- Figure 20: Europe Nano Radiation Sensors Industry Revenue (Million), by Application 2024 & 2032
- Figure 21: Europe Nano Radiation Sensors Industry Revenue Share (%), by Application 2024 & 2032
- Figure 22: Europe Nano Radiation Sensors Industry Revenue (Million), by Country 2024 & 2032
- Figure 23: Europe Nano Radiation Sensors Industry Revenue Share (%), by Country 2024 & 2032
- Figure 24: Asia Pacific Nano Radiation Sensors Industry Revenue (Million), by Type 2024 & 2032
- Figure 25: Asia Pacific Nano Radiation Sensors Industry Revenue Share (%), by Type 2024 & 2032
- Figure 26: Asia Pacific Nano Radiation Sensors Industry Revenue (Million), by Application 2024 & 2032
- Figure 27: Asia Pacific Nano Radiation Sensors Industry Revenue Share (%), by Application 2024 & 2032
- Figure 28: Asia Pacific Nano Radiation Sensors Industry Revenue (Million), by Country 2024 & 2032
- Figure 29: Asia Pacific Nano Radiation Sensors Industry Revenue Share (%), by Country 2024 & 2032
- Figure 30: Latin America Nano Radiation Sensors Industry Revenue (Million), by Type 2024 & 2032
- Figure 31: Latin America Nano Radiation Sensors Industry Revenue Share (%), by Type 2024 & 2032
- Figure 32: Latin America Nano Radiation Sensors Industry Revenue (Million), by Application 2024 & 2032
- Figure 33: Latin America Nano Radiation Sensors Industry Revenue Share (%), by Application 2024 & 2032
- Figure 34: Latin America Nano Radiation Sensors Industry Revenue (Million), by Country 2024 & 2032
- Figure 35: Latin America Nano Radiation Sensors Industry Revenue Share (%), by Country 2024 & 2032
- Figure 36: Middle East Nano Radiation Sensors Industry Revenue (Million), by Type 2024 & 2032
- Figure 37: Middle East Nano Radiation Sensors Industry Revenue Share (%), by Type 2024 & 2032
- Figure 38: Middle East Nano Radiation Sensors Industry Revenue (Million), by Application 2024 & 2032
- Figure 39: Middle East Nano Radiation Sensors Industry Revenue Share (%), by Application 2024 & 2032
- Figure 40: Middle East Nano Radiation Sensors Industry Revenue (Million), by Country 2024 & 2032
- Figure 41: Middle East Nano Radiation Sensors Industry Revenue Share (%), by Country 2024 & 2032
- Figure 42: UAE Nano Radiation Sensors Industry Revenue (Million), by Type 2024 & 2032
- Figure 43: UAE Nano Radiation Sensors Industry Revenue Share (%), by Type 2024 & 2032
- Figure 44: UAE Nano Radiation Sensors Industry Revenue (Million), by Application 2024 & 2032
- Figure 45: UAE Nano Radiation Sensors Industry Revenue Share (%), by Application 2024 & 2032
- Figure 46: UAE Nano Radiation Sensors Industry Revenue (Million), by Country 2024 & 2032
- Figure 47: UAE Nano Radiation Sensors Industry Revenue Share (%), by Country 2024 & 2032
List of Tables
- Table 1: Global Nano Radiation Sensors Industry Revenue Million Forecast, by Region 2019 & 2032
- Table 2: Global Nano Radiation Sensors Industry Revenue Million Forecast, by Type 2019 & 2032
- Table 3: Global Nano Radiation Sensors Industry Revenue Million Forecast, by Application 2019 & 2032
- Table 4: Global Nano Radiation Sensors Industry Revenue Million Forecast, by Region 2019 & 2032
- Table 5: Global Nano Radiation Sensors Industry Revenue Million Forecast, by Country 2019 & 2032
- Table 6: US Nano Radiation Sensors Industry Revenue (Million) Forecast, by Application 2019 & 2032
- Table 7: Canada Nano Radiation Sensors Industry Revenue (Million) Forecast, by Application 2019 & 2032
- Table 8: Global Nano Radiation Sensors Industry Revenue Million Forecast, by Country 2019 & 2032
- Table 9: Germany Nano Radiation Sensors Industry Revenue (Million) Forecast, by Application 2019 & 2032
- Table 10: UK Nano Radiation Sensors Industry Revenue (Million) Forecast, by Application 2019 & 2032
- Table 11: France Nano Radiation Sensors Industry Revenue (Million) Forecast, by Application 2019 & 2032
- Table 12: Russia Nano Radiation Sensors Industry Revenue (Million) Forecast, by Application 2019 & 2032
- Table 13: Spain Nano Radiation Sensors Industry Revenue (Million) Forecast, by Application 2019 & 2032
- Table 14: Italy Nano Radiation Sensors Industry Revenue (Million) Forecast, by Application 2019 & 2032
- Table 15: Rest of Europe Nano Radiation Sensors Industry Revenue (Million) Forecast, by Application 2019 & 2032
- Table 16: Global Nano Radiation Sensors Industry Revenue Million Forecast, by Country 2019 & 2032
- Table 17: China Nano Radiation Sensors Industry Revenue (Million) Forecast, by Application 2019 & 2032
- Table 18: Japan Nano Radiation Sensors Industry Revenue (Million) Forecast, by Application 2019 & 2032
- Table 19: India Nano Radiation Sensors Industry Revenue (Million) Forecast, by Application 2019 & 2032
- Table 20: Rest of Asia Pacific Nano Radiation Sensors Industry Revenue (Million) Forecast, by Application 2019 & 2032
- Table 21: Global Nano Radiation Sensors Industry Revenue Million Forecast, by Country 2019 & 2032
- Table 22: United Arab Emirates Nano Radiation Sensors Industry Revenue (Million) Forecast, by Application 2019 & 2032
- Table 23: Saudi Arabia Nano Radiation Sensors Industry Revenue (Million) Forecast, by Application 2019 & 2032
- Table 24: Qatar Nano Radiation Sensors Industry Revenue (Million) Forecast, by Application 2019 & 2032
- Table 25: Israel Nano Radiation Sensors Industry Revenue (Million) Forecast, by Application 2019 & 2032
- Table 26: Egypt Nano Radiation Sensors Industry Revenue (Million) Forecast, by Application 2019 & 2032
- Table 27: Oman Nano Radiation Sensors Industry Revenue (Million) Forecast, by Application 2019 & 2032
- Table 28: Rest of Middle East Nano Radiation Sensors Industry Revenue (Million) Forecast, by Application 2019 & 2032
- Table 29: Global Nano Radiation Sensors Industry Revenue Million Forecast, by Country 2019 & 2032
- Table 30: Brazil Nano Radiation Sensors Industry Revenue (Million) Forecast, by Application 2019 & 2032
- Table 31: Argentina Nano Radiation Sensors Industry Revenue (Million) Forecast, by Application 2019 & 2032
- Table 32: Rest of South America Nano Radiation Sensors Industry Revenue (Million) Forecast, by Application 2019 & 2032
- Table 33: Global Nano Radiation Sensors Industry Revenue Million Forecast, by Type 2019 & 2032
- Table 34: Global Nano Radiation Sensors Industry Revenue Million Forecast, by Application 2019 & 2032
- Table 35: Global Nano Radiation Sensors Industry Revenue Million Forecast, by Country 2019 & 2032
- Table 36: US Nano Radiation Sensors Industry Revenue (Million) Forecast, by Application 2019 & 2032
- Table 37: Canada Nano Radiation Sensors Industry Revenue (Million) Forecast, by Application 2019 & 2032
- Table 38: Global Nano Radiation Sensors Industry Revenue Million Forecast, by Type 2019 & 2032
- Table 39: Global Nano Radiation Sensors Industry Revenue Million Forecast, by Application 2019 & 2032
- Table 40: Global Nano Radiation Sensors Industry Revenue Million Forecast, by Country 2019 & 2032
- Table 41: Germany Nano Radiation Sensors Industry Revenue (Million) Forecast, by Application 2019 & 2032
- Table 42: UK Nano Radiation Sensors Industry Revenue (Million) Forecast, by Application 2019 & 2032
- Table 43: France Nano Radiation Sensors Industry Revenue (Million) Forecast, by Application 2019 & 2032
- Table 44: Russia Nano Radiation Sensors Industry Revenue (Million) Forecast, by Application 2019 & 2032
- Table 45: Spain Nano Radiation Sensors Industry Revenue (Million) Forecast, by Application 2019 & 2032
- Table 46: Italy Nano Radiation Sensors Industry Revenue (Million) Forecast, by Application 2019 & 2032
- Table 47: Rest of Europe Nano Radiation Sensors Industry Revenue (Million) Forecast, by Application 2019 & 2032
- Table 48: Global Nano Radiation Sensors Industry Revenue Million Forecast, by Type 2019 & 2032
- Table 49: Global Nano Radiation Sensors Industry Revenue Million Forecast, by Application 2019 & 2032
- Table 50: Global Nano Radiation Sensors Industry Revenue Million Forecast, by Country 2019 & 2032
- Table 51: China Nano Radiation Sensors Industry Revenue (Million) Forecast, by Application 2019 & 2032
- Table 52: Japan Nano Radiation Sensors Industry Revenue (Million) Forecast, by Application 2019 & 2032
- Table 53: India Nano Radiation Sensors Industry Revenue (Million) Forecast, by Application 2019 & 2032
- Table 54: Rest of Asia Pacific Nano Radiation Sensors Industry Revenue (Million) Forecast, by Application 2019 & 2032
- Table 55: Global Nano Radiation Sensors Industry Revenue Million Forecast, by Type 2019 & 2032
- Table 56: Global Nano Radiation Sensors Industry Revenue Million Forecast, by Application 2019 & 2032
- Table 57: Global Nano Radiation Sensors Industry Revenue Million Forecast, by Country 2019 & 2032
- Table 58: Brazil Nano Radiation Sensors Industry Revenue (Million) Forecast, by Application 2019 & 2032
- Table 59: Argentina Nano Radiation Sensors Industry Revenue (Million) Forecast, by Application 2019 & 2032
- Table 60: Mexico Nano Radiation Sensors Industry Revenue (Million) Forecast, by Application 2019 & 2032
- Table 61: Rest of Latin America Nano Radiation Sensors Industry Revenue (Million) Forecast, by Application 2019 & 2032
- Table 62: Global Nano Radiation Sensors Industry Revenue Million Forecast, by Type 2019 & 2032
- Table 63: Global Nano Radiation Sensors Industry Revenue Million Forecast, by Application 2019 & 2032
- Table 64: Global Nano Radiation Sensors Industry Revenue Million Forecast, by Country 2019 & 2032
- Table 65: Global Nano Radiation Sensors Industry Revenue Million Forecast, by Type 2019 & 2032
- Table 66: Global Nano Radiation Sensors Industry Revenue Million Forecast, by Application 2019 & 2032
- Table 67: Global Nano Radiation Sensors Industry Revenue Million Forecast, by Country 2019 & 2032
- Table 68: Saudi Arabia Nano Radiation Sensors Industry Revenue (Million) Forecast, by Application 2019 & 2032
- Table 69: South Africa Nano Radiation Sensors Industry Revenue (Million) Forecast, by Application 2019 & 2032
- Table 70: Rest of Middle East Nano Radiation Sensors Industry Revenue (Million) Forecast, by Application 2019 & 2032
Frequently Asked Questions
1. What is the projected Compound Annual Growth Rate (CAGR) of the Nano Radiation Sensors Industry?
The projected CAGR is approximately 6.72%.
2. Which companies are prominent players in the Nano Radiation Sensors Industry?
Key companies in the market include Hamamatsu Photonics KK, First Sensor AG, Thermo Fisher Scientific Inc, Baker Hughes (General Electric), Rae Systems Inc (Honeywell International Inc ), Toshiba Corporation, Robert Bosch GmbH, Nihon Kessho Kogaku Co Ltd, Analog Devices Inc.
3. What are the main segments of the Nano Radiation Sensors Industry?
The market segments include Type, Application.
4. Can you provide details about the market size?
The market size is estimated to be USD XX Million as of 2022.
5. What are some drivers contributing to market growth?
; Growing Trend of Miniaturization Across Various Industries; Advancements in Nanotechnology Supported by Government Regulations.
6. What are the notable trends driving market growth?
Consumer Electronics End User to Account for Largest Share.
7. Are there any restraints impacting market growth?
; Complexity in Manufacturing and Potential Risks Involved in Adopting Radiation Nanosensors.
8. Can you provide examples of recent developments in the market?
N/A
9. What pricing options are available for accessing the report?
Pricing options include single-user, multi-user, and enterprise licenses priced at USD 3800, USD 4500, and USD 5800 respectively.
10. Is the market size provided in terms of value or volume?
The market size is provided in terms of value, measured in Million.
11. Are there any specific market keywords associated with the report?
Yes, the market keyword associated with the report is "Nano Radiation Sensors Industry," which aids in identifying and referencing the specific market segment covered.
12. How do I determine which pricing option suits my needs best?
The pricing options vary based on user requirements and access needs. Individual users may opt for single-user licenses, while businesses requiring broader access may choose multi-user or enterprise licenses for cost-effective access to the report.
13. Are there any additional resources or data provided in the Nano Radiation Sensors Industry report?
While the report offers comprehensive insights, it's advisable to review the specific contents or supplementary materials provided to ascertain if additional resources or data are available.
14. How can I stay updated on further developments or reports in the Nano Radiation Sensors Industry?
To stay informed about further developments, trends, and reports in the Nano Radiation Sensors Industry, consider subscribing to industry newsletters, following relevant companies and organizations, or regularly checking reputable industry news sources and publications.
Methodology
Step 1 - Identification of Relevant Samples Size from Population Database


Step 2 - Approaches for Defining Global Market Size (Value, Volume* & Price*)

Note*: In applicable scenarios
Step 3 - Data Sources
Primary Research
- Web Analytics
- Survey Reports
- Research Institute
- Latest Research Reports
- Opinion Leaders
Secondary Research
- Annual Reports
- White Paper
- Latest Press Release
- Industry Association
- Paid Database
- Investor Presentations

Step 4 - Data Triangulation
Involves using different sources of information in order to increase the validity of a study
These sources are likely to be stakeholders in a program - participants, other researchers, program staff, other community members, and so on.
Then we put all data in single framework & apply various statistical tools to find out the dynamic on the market.
During the analysis stage, feedback from the stakeholder groups would be compared to determine areas of agreement as well as areas of divergence


