
Key Insights
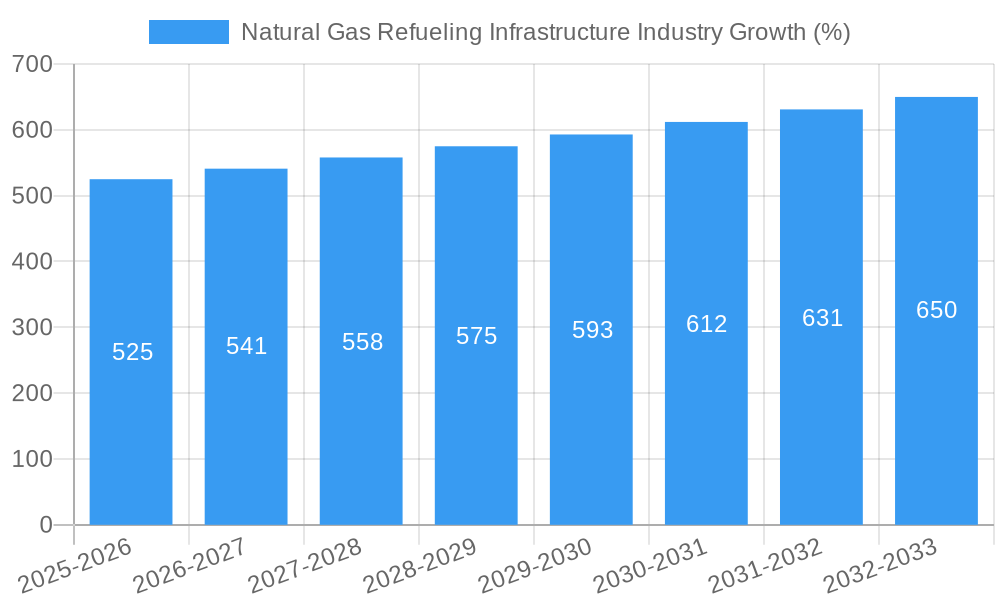
The Natural Gas Refueling Infrastructure market is experiencing robust growth, projected to maintain a CAGR exceeding 3.50% from 2025 to 2033. This expansion is fueled by several key drivers. Increasing environmental concerns and stringent emission regulations are pushing transportation sectors towards cleaner alternatives, with natural gas vehicles (NGVs) emerging as a significant player. Government incentives and subsidies aimed at promoting the adoption of NGVs are further accelerating market growth. Furthermore, advancements in refueling technologies, leading to improved efficiency and safety, are contributing to market expansion. The market is segmented by type into Compressed Natural Gas (CNG) and Liquefied Natural Gas (LNG) infrastructure, with CNG currently holding a larger market share due to lower initial investment costs and established infrastructure in many regions. However, LNG is expected to witness faster growth due to its higher energy density and suitability for long-haul transportation. Geographical expansion is also a major trend, with Asia-Pacific and North America projected as leading markets due to significant investments in NGV infrastructure and substantial government support. Challenges include the relatively high initial investment cost associated with establishing refueling stations, the need for robust safety measures, and the geographical limitations of natural gas pipelines. Despite these restraints, the long-term outlook for the Natural Gas Refueling Infrastructure market remains positive, driven by the continued shift towards sustainable transportation solutions.
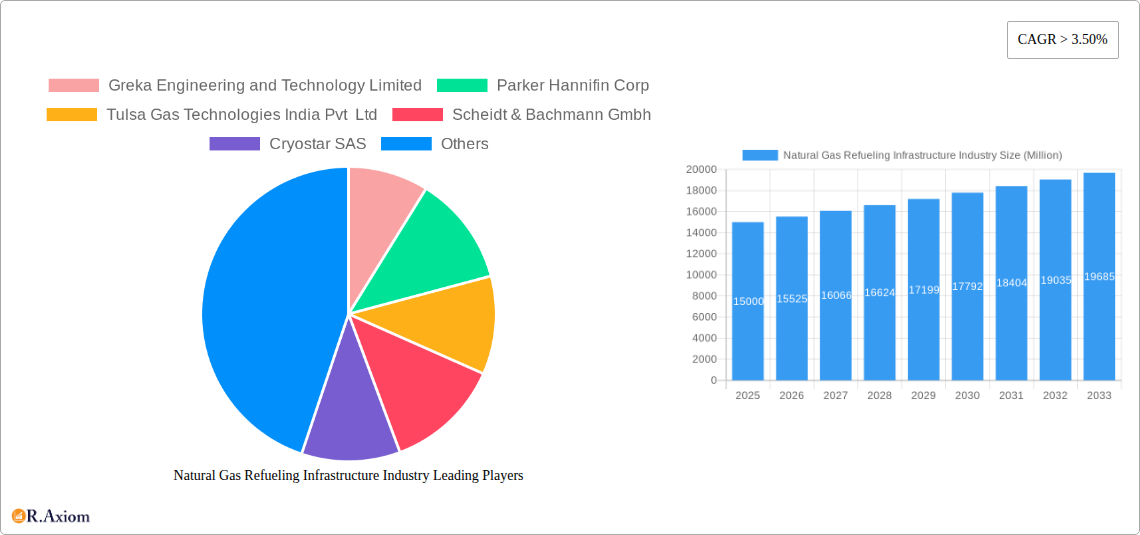
Major players such as Greka Engineering and Technology Limited, Parker Hannifin Corp, and others are actively shaping the market landscape through technological advancements, strategic partnerships, and geographic expansion. Competition is expected to intensify as new entrants emerge, particularly in developing economies with burgeoning NGV fleets. The market's success hinges on effective collaboration between governments, infrastructure developers, and private sector companies to address the existing challenges and create a sustainable ecosystem for natural gas refueling. Focusing on cost-effective solutions, enhancing safety protocols, and expanding the refueling network are crucial for unlocking the full potential of this burgeoning market. The development of standardized infrastructure and interoperability between different refueling systems will also be essential for long-term growth.
This in-depth report provides a comprehensive analysis of the Natural Gas Refueling Infrastructure industry, offering invaluable insights for stakeholders, investors, and industry professionals. The study covers the period from 2019 to 2033, with a focus on the forecast period of 2025-2033 and a base year of 2025. The report meticulously analyzes market trends, competitive dynamics, technological advancements, and regulatory landscapes, providing a clear roadmap for future growth and investment strategies. Market sizes are presented in Millions (USD).
Natural Gas Refueling Infrastructure Industry Market Concentration & Innovation
The natural gas refueling infrastructure market exhibits a moderately concentrated landscape, with a few major players holding significant market share. Greka Engineering and Technology Limited, Parker Hannifin Corp, and Clean Energy Fuels collectively account for an estimated xx% of the global market in 2025. Innovation is driven primarily by advancements in CNG and LNG technologies, focusing on improved efficiency, safety, and reduced emissions. Stringent environmental regulations are pushing the industry towards cleaner and more sustainable refueling solutions. The market has witnessed several mergers and acquisitions (M&A) in recent years, with deal values exceeding $xx Million in the historical period (2019-2024). These activities aim to expand market reach, enhance technological capabilities, and secure a larger share of the growing market. Key product substitutes include electric vehicle charging infrastructure and hydrogen refueling stations, posing a competitive challenge. End-user trends show a growing preference for CNG and LNG vehicles in specific sectors such as transportation and logistics.
- Market Share (2025 Estimate): Top 3 players: xx%
- M&A Deal Value (2019-2024): > $xx Million
- Key Innovation Drivers: Improved efficiency, enhanced safety, emission reduction technologies.
- Regulatory Impact: Stringent environmental regulations driving adoption of cleaner technologies.
Natural Gas Refueling Infrastructure Industry Industry Trends & Insights
The natural gas refueling infrastructure market is experiencing robust growth, driven by increasing demand for natural gas vehicles and supportive government policies aimed at reducing greenhouse gas emissions. The industry is witnessing a significant shift towards LNG due to its higher energy density compared to CNG. The Compound Annual Growth Rate (CAGR) for the market is projected to be xx% during the forecast period (2025-2033). Market penetration of CNG and LNG refueling stations is gradually increasing, particularly in regions with favorable government incentives. Technological disruptions, such as the development of more efficient and compact refueling equipment, are accelerating market expansion. Consumer preferences are shifting towards vehicles with lower operating costs and reduced environmental impact, making natural gas a compelling alternative. Competitive dynamics are characterized by intense rivalry among established players and the emergence of new entrants, particularly in developing economies.
Dominant Markets & Segments in Natural Gas Refueling Infrastructure Industry
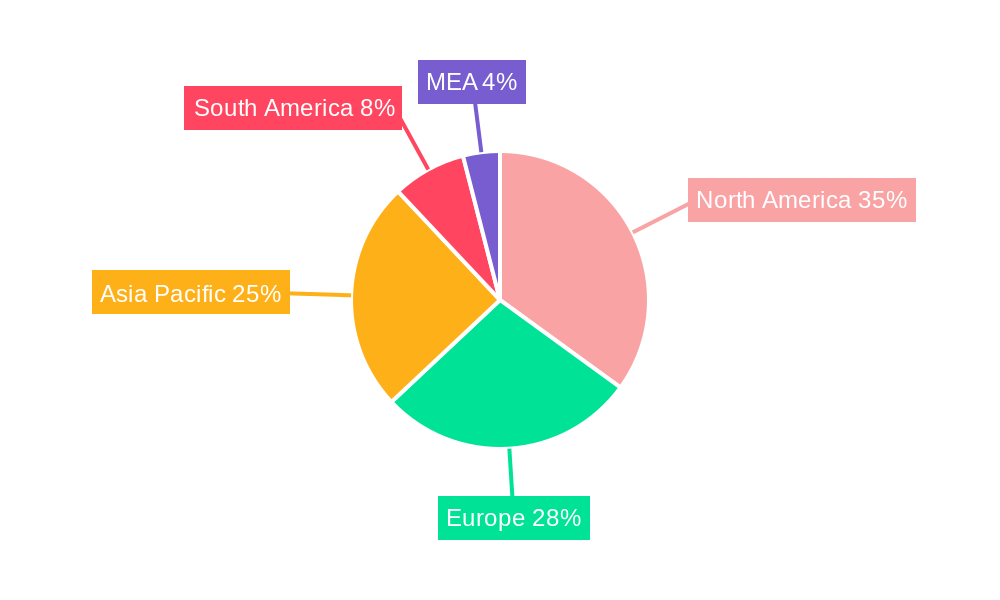
The natural gas refueling infrastructure market is dominated by regions with established natural gas networks and supportive government policies. Specifically, [Region Name] leads the market globally, driven by a combination of factors:
- Key Drivers in [Region Name]:
- Favorable government policies and substantial investments in infrastructure development.
- Strong presence of major players in the region.
- High demand for natural gas vehicles in the transportation sector.
The LNG segment is expected to exhibit higher growth compared to CNG due to its superior energy density and suitability for long-haul transportation. The dominance of this segment is likely to be sustained throughout the forecast period due to continuous technological enhancements and increasing demand in regions with extensive long-distance transportation networks.
Natural Gas Refueling Infrastructure Industry Product Developments
Recent product innovations have focused on improving the efficiency, safety, and durability of CNG and LNG refueling equipment. These developments include the introduction of more compact and modular refueling stations, advanced cryogenic storage tanks, and improved dispensing systems. The key competitive advantages are centered around enhanced safety features, reduced installation costs, and lower operating expenses, thus addressing market needs for cost-effectiveness and environmental responsibility. Technological trends like automation and remote monitoring are being incorporated, enhancing operational efficiency and optimizing maintenance schedules.
Report Scope & Segmentation Analysis
This report segments the natural gas refueling infrastructure market primarily by type of natural gas:
Compressed Natural Gas (CNG): The CNG segment is characterized by relatively lower capital investment requirements compared to LNG, making it attractive for smaller-scale deployments. However, its lower energy density limits its suitability for long-haul transportation. The market size for CNG is projected to reach $xx Million by 2033, with a CAGR of xx%.
Liquefied Natural Gas (LNG): The LNG segment is expected to witness significant growth due to its higher energy density and suitability for long-distance transportation. The market size for LNG is projected to reach $xx Million by 2033, with a CAGR of xx%. The competitive landscape in this segment is characterized by intense rivalry among established players and the entry of new players seeking to leverage the growth potential.
Key Drivers of Natural Gas Refueling Infrastructure Industry Growth
The growth of the natural gas refueling infrastructure industry is driven by several key factors. Government incentives and regulations promoting the adoption of cleaner transportation fuels play a significant role. The increasing demand for natural gas vehicles, particularly in the heavy-duty transportation sector, is a major driver. Technological advancements leading to more efficient and cost-effective refueling equipment further stimulate market growth. Finally, the relatively lower cost of natural gas compared to other fuels makes it an attractive alternative.
Challenges in the Natural Gas Refueling Infrastructure Industry Sector
The industry faces challenges such as high initial investment costs for infrastructure development, particularly for LNG facilities. Supply chain disruptions can impact the availability of critical components, hindering project timelines. Competition from alternative fuels, including electricity and hydrogen, poses a significant threat. Furthermore, regulatory uncertainties and evolving environmental standards can impact investment decisions and market growth trajectories, potentially resulting in a xx% reduction in projected growth if not addressed effectively.
Emerging Opportunities in Natural Gas Refueling Infrastructure Industry
Significant opportunities exist in emerging markets with growing transportation sectors and a need for cleaner fuels. The development of innovative refueling technologies, such as mobile refueling units, can address infrastructure limitations. Integration of smart technologies for real-time monitoring and optimization of refueling operations offers substantial potential. Moreover, the expansion into niche markets, such as maritime and rail transportation, represents promising avenues for growth.
Leading Players in the Natural Gas Refueling Infrastructure Industry Market
- Greka Engineering and Technology Limited
- Parker Hannifin Corp
- Tulsa Gas Technologies India Pvt Ltd
- Scheidt & Bachmann Gmbh
- Cryostar SAS
- Sanki Industry Group
- Tatsuno Europe AS
- Gilbarco Inc
- Clean Energy Fuels
- FTI International Group Inc
Key Developments in Natural Gas Refueling Infrastructure Industry Industry
- January 2023: Parker Hannifin Corp announced a new line of high-efficiency CNG compressors.
- June 2022: Clean Energy Fuels partnered with a major trucking company to expand its LNG refueling network.
- October 2021: Gilbarco Inc launched a new generation of CNG dispensers with enhanced safety features.
- (Further key developments with dates will be included in the full report.)
Strategic Outlook for Natural Gas Refueling Infrastructure Industry Market
The natural gas refueling infrastructure market is poised for continued growth, driven by increasing demand for natural gas vehicles and supportive government policies. Technological advancements, coupled with strategic partnerships and investments in infrastructure development, will play a crucial role in shaping the industry's future. Expanding into new markets and exploring innovative applications, particularly in the heavy-duty transportation sector and maritime, will create significant growth opportunities in the coming years. The focus on sustainability and emission reduction will continue to drive innovation and adoption of more efficient and environmentally friendly refueling technologies.
Natural Gas Refueling Infrastructure Industry Segmentation
-
1. Type of Natural Gas
- 1.1. Compressed Natural Gas (CNG)
- 1.2. Liquefied Natural Gas (LNG)
Natural Gas Refueling Infrastructure Industry Segmentation By Geography
- 1. North America
- 2. Europe
- 3. Asia Pacific
- 4. South America
- 5. Middle East and Africa
Natural Gas Refueling Infrastructure Industry REPORT HIGHLIGHTS
| Aspects | Details |
|---|---|
| Study Period | 2019-2033 |
| Base Year | 2024 |
| Estimated Year | 2025 |
| Forecast Period | 2025-2033 |
| Historical Period | 2019-2024 |
| Growth Rate | CAGR of > 3.50% from 2019-2033 |
| Segmentation |
|
Table of Contents
- 1. Introduction
- 1.1. Research Scope
- 1.2. Market Segmentation
- 1.3. Research Methodology
- 1.4. Definitions and Assumptions
- 2. Executive Summary
- 2.1. Introduction
- 3. Market Dynamics
- 3.1. Introduction
- 3.2. Market Drivers
- 3.2.1. 4.; Corporate Sustainability Goals4.; Stringent Regultions and Compliance
- 3.3. Market Restrains
- 3.3.1. 4.; High Complexity in Carbon Accounting
- 3.4. Market Trends
- 3.4.1. Compressed Natural Gas to Dominate the Market
- 4. Market Factor Analysis
- 4.1. Porters Five Forces
- 4.2. Supply/Value Chain
- 4.3. PESTEL analysis
- 4.4. Market Entropy
- 4.5. Patent/Trademark Analysis
- 5. Global Natural Gas Refueling Infrastructure Industry Analysis, Insights and Forecast, 2019-2031
- 5.1. Market Analysis, Insights and Forecast - by Type of Natural Gas
- 5.1.1. Compressed Natural Gas (CNG)
- 5.1.2. Liquefied Natural Gas (LNG)
- 5.2. Market Analysis, Insights and Forecast - by Region
- 5.2.1. North America
- 5.2.2. Europe
- 5.2.3. Asia Pacific
- 5.2.4. South America
- 5.2.5. Middle East and Africa
- 5.1. Market Analysis, Insights and Forecast - by Type of Natural Gas
- 6. North America Natural Gas Refueling Infrastructure Industry Analysis, Insights and Forecast, 2019-2031
- 6.1. Market Analysis, Insights and Forecast - by Type of Natural Gas
- 6.1.1. Compressed Natural Gas (CNG)
- 6.1.2. Liquefied Natural Gas (LNG)
- 6.1. Market Analysis, Insights and Forecast - by Type of Natural Gas
- 7. Europe Natural Gas Refueling Infrastructure Industry Analysis, Insights and Forecast, 2019-2031
- 7.1. Market Analysis, Insights and Forecast - by Type of Natural Gas
- 7.1.1. Compressed Natural Gas (CNG)
- 7.1.2. Liquefied Natural Gas (LNG)
- 7.1. Market Analysis, Insights and Forecast - by Type of Natural Gas
- 8. Asia Pacific Natural Gas Refueling Infrastructure Industry Analysis, Insights and Forecast, 2019-2031
- 8.1. Market Analysis, Insights and Forecast - by Type of Natural Gas
- 8.1.1. Compressed Natural Gas (CNG)
- 8.1.2. Liquefied Natural Gas (LNG)
- 8.1. Market Analysis, Insights and Forecast - by Type of Natural Gas
- 9. South America Natural Gas Refueling Infrastructure Industry Analysis, Insights and Forecast, 2019-2031
- 9.1. Market Analysis, Insights and Forecast - by Type of Natural Gas
- 9.1.1. Compressed Natural Gas (CNG)
- 9.1.2. Liquefied Natural Gas (LNG)
- 9.1. Market Analysis, Insights and Forecast - by Type of Natural Gas
- 10. Middle East and Africa Natural Gas Refueling Infrastructure Industry Analysis, Insights and Forecast, 2019-2031
- 10.1. Market Analysis, Insights and Forecast - by Type of Natural Gas
- 10.1.1. Compressed Natural Gas (CNG)
- 10.1.2. Liquefied Natural Gas (LNG)
- 10.1. Market Analysis, Insights and Forecast - by Type of Natural Gas
- 11. North America Natural Gas Refueling Infrastructure Industry Analysis, Insights and Forecast, 2019-2031
- 11.1. Market Analysis, Insights and Forecast - By Country/Sub-region
- 11.1.1 United States
- 11.1.2 Canada
- 11.1.3 Mexico
- 12. Europe Natural Gas Refueling Infrastructure Industry Analysis, Insights and Forecast, 2019-2031
- 12.1. Market Analysis, Insights and Forecast - By Country/Sub-region
- 12.1.1 Germany
- 12.1.2 United Kingdom
- 12.1.3 France
- 12.1.4 Spain
- 12.1.5 Italy
- 12.1.6 Spain
- 12.1.7 Belgium
- 12.1.8 Netherland
- 12.1.9 Nordics
- 12.1.10 Rest of Europe
- 13. Asia Pacific Natural Gas Refueling Infrastructure Industry Analysis, Insights and Forecast, 2019-2031
- 13.1. Market Analysis, Insights and Forecast - By Country/Sub-region
- 13.1.1 China
- 13.1.2 Japan
- 13.1.3 India
- 13.1.4 South Korea
- 13.1.5 Southeast Asia
- 13.1.6 Australia
- 13.1.7 Indonesia
- 13.1.8 Phillipes
- 13.1.9 Singapore
- 13.1.10 Thailandc
- 13.1.11 Rest of Asia Pacific
- 14. South America Natural Gas Refueling Infrastructure Industry Analysis, Insights and Forecast, 2019-2031
- 14.1. Market Analysis, Insights and Forecast - By Country/Sub-region
- 14.1.1 Brazil
- 14.1.2 Argentina
- 14.1.3 Peru
- 14.1.4 Chile
- 14.1.5 Colombia
- 14.1.6 Ecuador
- 14.1.7 Venezuela
- 14.1.8 Rest of South America
- 15. MEA Natural Gas Refueling Infrastructure Industry Analysis, Insights and Forecast, 2019-2031
- 15.1. Market Analysis, Insights and Forecast - By Country/Sub-region
- 15.1.1 United Arab Emirates
- 15.1.2 Saudi Arabia
- 15.1.3 South Africa
- 15.1.4 Rest of Middle East and Africa
- 16. Competitive Analysis
- 16.1. Global Market Share Analysis 2024
- 16.2. Company Profiles
- 16.2.1 Greka Engineering and Technology Limited
- 16.2.1.1. Overview
- 16.2.1.2. Products
- 16.2.1.3. SWOT Analysis
- 16.2.1.4. Recent Developments
- 16.2.1.5. Financials (Based on Availability)
- 16.2.2 Parker Hannifin Corp
- 16.2.2.1. Overview
- 16.2.2.2. Products
- 16.2.2.3. SWOT Analysis
- 16.2.2.4. Recent Developments
- 16.2.2.5. Financials (Based on Availability)
- 16.2.3 Tulsa Gas Technologies India Pvt Ltd
- 16.2.3.1. Overview
- 16.2.3.2. Products
- 16.2.3.3. SWOT Analysis
- 16.2.3.4. Recent Developments
- 16.2.3.5. Financials (Based on Availability)
- 16.2.4 Scheidt & Bachmann Gmbh
- 16.2.4.1. Overview
- 16.2.4.2. Products
- 16.2.4.3. SWOT Analysis
- 16.2.4.4. Recent Developments
- 16.2.4.5. Financials (Based on Availability)
- 16.2.5 Cryostar SAS
- 16.2.5.1. Overview
- 16.2.5.2. Products
- 16.2.5.3. SWOT Analysis
- 16.2.5.4. Recent Developments
- 16.2.5.5. Financials (Based on Availability)
- 16.2.6 Sanki Industry Group
- 16.2.6.1. Overview
- 16.2.6.2. Products
- 16.2.6.3. SWOT Analysis
- 16.2.6.4. Recent Developments
- 16.2.6.5. Financials (Based on Availability)
- 16.2.7 Tatsuno Europe AS
- 16.2.7.1. Overview
- 16.2.7.2. Products
- 16.2.7.3. SWOT Analysis
- 16.2.7.4. Recent Developments
- 16.2.7.5. Financials (Based on Availability)
- 16.2.8 Gilbarco Inc
- 16.2.8.1. Overview
- 16.2.8.2. Products
- 16.2.8.3. SWOT Analysis
- 16.2.8.4. Recent Developments
- 16.2.8.5. Financials (Based on Availability)
- 16.2.9 Clean Energy Fuels
- 16.2.9.1. Overview
- 16.2.9.2. Products
- 16.2.9.3. SWOT Analysis
- 16.2.9.4. Recent Developments
- 16.2.9.5. Financials (Based on Availability)
- 16.2.10 FTI International Group Inc
- 16.2.10.1. Overview
- 16.2.10.2. Products
- 16.2.10.3. SWOT Analysis
- 16.2.10.4. Recent Developments
- 16.2.10.5. Financials (Based on Availability)
- 16.2.1 Greka Engineering and Technology Limited
List of Figures
- Figure 1: Global Natural Gas Refueling Infrastructure Industry Revenue Breakdown (Million, %) by Region 2024 & 2032
- Figure 2: North America Natural Gas Refueling Infrastructure Industry Revenue (Million), by Country 2024 & 2032
- Figure 3: North America Natural Gas Refueling Infrastructure Industry Revenue Share (%), by Country 2024 & 2032
- Figure 4: Europe Natural Gas Refueling Infrastructure Industry Revenue (Million), by Country 2024 & 2032
- Figure 5: Europe Natural Gas Refueling Infrastructure Industry Revenue Share (%), by Country 2024 & 2032
- Figure 6: Asia Pacific Natural Gas Refueling Infrastructure Industry Revenue (Million), by Country 2024 & 2032
- Figure 7: Asia Pacific Natural Gas Refueling Infrastructure Industry Revenue Share (%), by Country 2024 & 2032
- Figure 8: South America Natural Gas Refueling Infrastructure Industry Revenue (Million), by Country 2024 & 2032
- Figure 9: South America Natural Gas Refueling Infrastructure Industry Revenue Share (%), by Country 2024 & 2032
- Figure 10: MEA Natural Gas Refueling Infrastructure Industry Revenue (Million), by Country 2024 & 2032
- Figure 11: MEA Natural Gas Refueling Infrastructure Industry Revenue Share (%), by Country 2024 & 2032
- Figure 12: North America Natural Gas Refueling Infrastructure Industry Revenue (Million), by Type of Natural Gas 2024 & 2032
- Figure 13: North America Natural Gas Refueling Infrastructure Industry Revenue Share (%), by Type of Natural Gas 2024 & 2032
- Figure 14: North America Natural Gas Refueling Infrastructure Industry Revenue (Million), by Country 2024 & 2032
- Figure 15: North America Natural Gas Refueling Infrastructure Industry Revenue Share (%), by Country 2024 & 2032
- Figure 16: Europe Natural Gas Refueling Infrastructure Industry Revenue (Million), by Type of Natural Gas 2024 & 2032
- Figure 17: Europe Natural Gas Refueling Infrastructure Industry Revenue Share (%), by Type of Natural Gas 2024 & 2032
- Figure 18: Europe Natural Gas Refueling Infrastructure Industry Revenue (Million), by Country 2024 & 2032
- Figure 19: Europe Natural Gas Refueling Infrastructure Industry Revenue Share (%), by Country 2024 & 2032
- Figure 20: Asia Pacific Natural Gas Refueling Infrastructure Industry Revenue (Million), by Type of Natural Gas 2024 & 2032
- Figure 21: Asia Pacific Natural Gas Refueling Infrastructure Industry Revenue Share (%), by Type of Natural Gas 2024 & 2032
- Figure 22: Asia Pacific Natural Gas Refueling Infrastructure Industry Revenue (Million), by Country 2024 & 2032
- Figure 23: Asia Pacific Natural Gas Refueling Infrastructure Industry Revenue Share (%), by Country 2024 & 2032
- Figure 24: South America Natural Gas Refueling Infrastructure Industry Revenue (Million), by Type of Natural Gas 2024 & 2032
- Figure 25: South America Natural Gas Refueling Infrastructure Industry Revenue Share (%), by Type of Natural Gas 2024 & 2032
- Figure 26: South America Natural Gas Refueling Infrastructure Industry Revenue (Million), by Country 2024 & 2032
- Figure 27: South America Natural Gas Refueling Infrastructure Industry Revenue Share (%), by Country 2024 & 2032
- Figure 28: Middle East and Africa Natural Gas Refueling Infrastructure Industry Revenue (Million), by Type of Natural Gas 2024 & 2032
- Figure 29: Middle East and Africa Natural Gas Refueling Infrastructure Industry Revenue Share (%), by Type of Natural Gas 2024 & 2032
- Figure 30: Middle East and Africa Natural Gas Refueling Infrastructure Industry Revenue (Million), by Country 2024 & 2032
- Figure 31: Middle East and Africa Natural Gas Refueling Infrastructure Industry Revenue Share (%), by Country 2024 & 2032
List of Tables
- Table 1: Global Natural Gas Refueling Infrastructure Industry Revenue Million Forecast, by Region 2019 & 2032
- Table 2: Global Natural Gas Refueling Infrastructure Industry Revenue Million Forecast, by Type of Natural Gas 2019 & 2032
- Table 3: Global Natural Gas Refueling Infrastructure Industry Revenue Million Forecast, by Region 2019 & 2032
- Table 4: Global Natural Gas Refueling Infrastructure Industry Revenue Million Forecast, by Country 2019 & 2032
- Table 5: United States Natural Gas Refueling Infrastructure Industry Revenue (Million) Forecast, by Application 2019 & 2032
- Table 6: Canada Natural Gas Refueling Infrastructure Industry Revenue (Million) Forecast, by Application 2019 & 2032
- Table 7: Mexico Natural Gas Refueling Infrastructure Industry Revenue (Million) Forecast, by Application 2019 & 2032
- Table 8: Global Natural Gas Refueling Infrastructure Industry Revenue Million Forecast, by Country 2019 & 2032
- Table 9: Germany Natural Gas Refueling Infrastructure Industry Revenue (Million) Forecast, by Application 2019 & 2032
- Table 10: United Kingdom Natural Gas Refueling Infrastructure Industry Revenue (Million) Forecast, by Application 2019 & 2032
- Table 11: France Natural Gas Refueling Infrastructure Industry Revenue (Million) Forecast, by Application 2019 & 2032
- Table 12: Spain Natural Gas Refueling Infrastructure Industry Revenue (Million) Forecast, by Application 2019 & 2032
- Table 13: Italy Natural Gas Refueling Infrastructure Industry Revenue (Million) Forecast, by Application 2019 & 2032
- Table 14: Spain Natural Gas Refueling Infrastructure Industry Revenue (Million) Forecast, by Application 2019 & 2032
- Table 15: Belgium Natural Gas Refueling Infrastructure Industry Revenue (Million) Forecast, by Application 2019 & 2032
- Table 16: Netherland Natural Gas Refueling Infrastructure Industry Revenue (Million) Forecast, by Application 2019 & 2032
- Table 17: Nordics Natural Gas Refueling Infrastructure Industry Revenue (Million) Forecast, by Application 2019 & 2032
- Table 18: Rest of Europe Natural Gas Refueling Infrastructure Industry Revenue (Million) Forecast, by Application 2019 & 2032
- Table 19: Global Natural Gas Refueling Infrastructure Industry Revenue Million Forecast, by Country 2019 & 2032
- Table 20: China Natural Gas Refueling Infrastructure Industry Revenue (Million) Forecast, by Application 2019 & 2032
- Table 21: Japan Natural Gas Refueling Infrastructure Industry Revenue (Million) Forecast, by Application 2019 & 2032
- Table 22: India Natural Gas Refueling Infrastructure Industry Revenue (Million) Forecast, by Application 2019 & 2032
- Table 23: South Korea Natural Gas Refueling Infrastructure Industry Revenue (Million) Forecast, by Application 2019 & 2032
- Table 24: Southeast Asia Natural Gas Refueling Infrastructure Industry Revenue (Million) Forecast, by Application 2019 & 2032
- Table 25: Australia Natural Gas Refueling Infrastructure Industry Revenue (Million) Forecast, by Application 2019 & 2032
- Table 26: Indonesia Natural Gas Refueling Infrastructure Industry Revenue (Million) Forecast, by Application 2019 & 2032
- Table 27: Phillipes Natural Gas Refueling Infrastructure Industry Revenue (Million) Forecast, by Application 2019 & 2032
- Table 28: Singapore Natural Gas Refueling Infrastructure Industry Revenue (Million) Forecast, by Application 2019 & 2032
- Table 29: Thailandc Natural Gas Refueling Infrastructure Industry Revenue (Million) Forecast, by Application 2019 & 2032
- Table 30: Rest of Asia Pacific Natural Gas Refueling Infrastructure Industry Revenue (Million) Forecast, by Application 2019 & 2032
- Table 31: Global Natural Gas Refueling Infrastructure Industry Revenue Million Forecast, by Country 2019 & 2032
- Table 32: Brazil Natural Gas Refueling Infrastructure Industry Revenue (Million) Forecast, by Application 2019 & 2032
- Table 33: Argentina Natural Gas Refueling Infrastructure Industry Revenue (Million) Forecast, by Application 2019 & 2032
- Table 34: Peru Natural Gas Refueling Infrastructure Industry Revenue (Million) Forecast, by Application 2019 & 2032
- Table 35: Chile Natural Gas Refueling Infrastructure Industry Revenue (Million) Forecast, by Application 2019 & 2032
- Table 36: Colombia Natural Gas Refueling Infrastructure Industry Revenue (Million) Forecast, by Application 2019 & 2032
- Table 37: Ecuador Natural Gas Refueling Infrastructure Industry Revenue (Million) Forecast, by Application 2019 & 2032
- Table 38: Venezuela Natural Gas Refueling Infrastructure Industry Revenue (Million) Forecast, by Application 2019 & 2032
- Table 39: Rest of South America Natural Gas Refueling Infrastructure Industry Revenue (Million) Forecast, by Application 2019 & 2032
- Table 40: Global Natural Gas Refueling Infrastructure Industry Revenue Million Forecast, by Country 2019 & 2032
- Table 41: United Arab Emirates Natural Gas Refueling Infrastructure Industry Revenue (Million) Forecast, by Application 2019 & 2032
- Table 42: Saudi Arabia Natural Gas Refueling Infrastructure Industry Revenue (Million) Forecast, by Application 2019 & 2032
- Table 43: South Africa Natural Gas Refueling Infrastructure Industry Revenue (Million) Forecast, by Application 2019 & 2032
- Table 44: Rest of Middle East and Africa Natural Gas Refueling Infrastructure Industry Revenue (Million) Forecast, by Application 2019 & 2032
- Table 45: Global Natural Gas Refueling Infrastructure Industry Revenue Million Forecast, by Type of Natural Gas 2019 & 2032
- Table 46: Global Natural Gas Refueling Infrastructure Industry Revenue Million Forecast, by Country 2019 & 2032
- Table 47: Global Natural Gas Refueling Infrastructure Industry Revenue Million Forecast, by Type of Natural Gas 2019 & 2032
- Table 48: Global Natural Gas Refueling Infrastructure Industry Revenue Million Forecast, by Country 2019 & 2032
- Table 49: Global Natural Gas Refueling Infrastructure Industry Revenue Million Forecast, by Type of Natural Gas 2019 & 2032
- Table 50: Global Natural Gas Refueling Infrastructure Industry Revenue Million Forecast, by Country 2019 & 2032
- Table 51: Global Natural Gas Refueling Infrastructure Industry Revenue Million Forecast, by Type of Natural Gas 2019 & 2032
- Table 52: Global Natural Gas Refueling Infrastructure Industry Revenue Million Forecast, by Country 2019 & 2032
- Table 53: Global Natural Gas Refueling Infrastructure Industry Revenue Million Forecast, by Type of Natural Gas 2019 & 2032
- Table 54: Global Natural Gas Refueling Infrastructure Industry Revenue Million Forecast, by Country 2019 & 2032
Frequently Asked Questions
1. What is the projected Compound Annual Growth Rate (CAGR) of the Natural Gas Refueling Infrastructure Industry?
The projected CAGR is approximately > 3.50%.
2. Which companies are prominent players in the Natural Gas Refueling Infrastructure Industry?
Key companies in the market include Greka Engineering and Technology Limited, Parker Hannifin Corp, Tulsa Gas Technologies India Pvt Ltd, Scheidt & Bachmann Gmbh, Cryostar SAS, Sanki Industry Group, Tatsuno Europe AS, Gilbarco Inc, Clean Energy Fuels, FTI International Group Inc.
3. What are the main segments of the Natural Gas Refueling Infrastructure Industry?
The market segments include Type of Natural Gas.
4. Can you provide details about the market size?
The market size is estimated to be USD XX Million as of 2022.
5. What are some drivers contributing to market growth?
4.; Corporate Sustainability Goals4.; Stringent Regultions and Compliance.
6. What are the notable trends driving market growth?
Compressed Natural Gas to Dominate the Market.
7. Are there any restraints impacting market growth?
4.; High Complexity in Carbon Accounting.
8. Can you provide examples of recent developments in the market?
N/A
9. What pricing options are available for accessing the report?
Pricing options include single-user, multi-user, and enterprise licenses priced at USD 4750, USD 5250, and USD 8750 respectively.
10. Is the market size provided in terms of value or volume?
The market size is provided in terms of value, measured in Million.
11. Are there any specific market keywords associated with the report?
Yes, the market keyword associated with the report is "Natural Gas Refueling Infrastructure Industry," which aids in identifying and referencing the specific market segment covered.
12. How do I determine which pricing option suits my needs best?
The pricing options vary based on user requirements and access needs. Individual users may opt for single-user licenses, while businesses requiring broader access may choose multi-user or enterprise licenses for cost-effective access to the report.
13. Are there any additional resources or data provided in the Natural Gas Refueling Infrastructure Industry report?
While the report offers comprehensive insights, it's advisable to review the specific contents or supplementary materials provided to ascertain if additional resources or data are available.
14. How can I stay updated on further developments or reports in the Natural Gas Refueling Infrastructure Industry?
To stay informed about further developments, trends, and reports in the Natural Gas Refueling Infrastructure Industry, consider subscribing to industry newsletters, following relevant companies and organizations, or regularly checking reputable industry news sources and publications.
Methodology
Step 1 - Identification of Relevant Samples Size from Population Database


Step 2 - Approaches for Defining Global Market Size (Value, Volume* & Price*)

Note*: In applicable scenarios
Step 3 - Data Sources
Primary Research
- Web Analytics
- Survey Reports
- Research Institute
- Latest Research Reports
- Opinion Leaders
Secondary Research
- Annual Reports
- White Paper
- Latest Press Release
- Industry Association
- Paid Database
- Investor Presentations

Step 4 - Data Triangulation
Involves using different sources of information in order to increase the validity of a study
These sources are likely to be stakeholders in a program - participants, other researchers, program staff, other community members, and so on.
Then we put all data in single framework & apply various statistical tools to find out the dynamic on the market.
During the analysis stage, feedback from the stakeholder groups would be compared to determine areas of agreement as well as areas of divergence


