
Key Insights
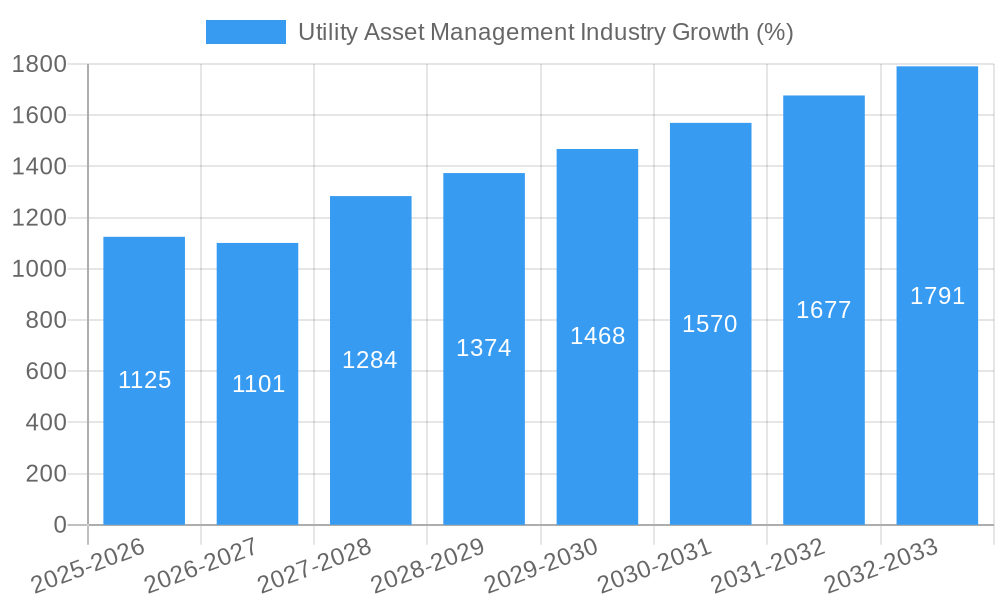
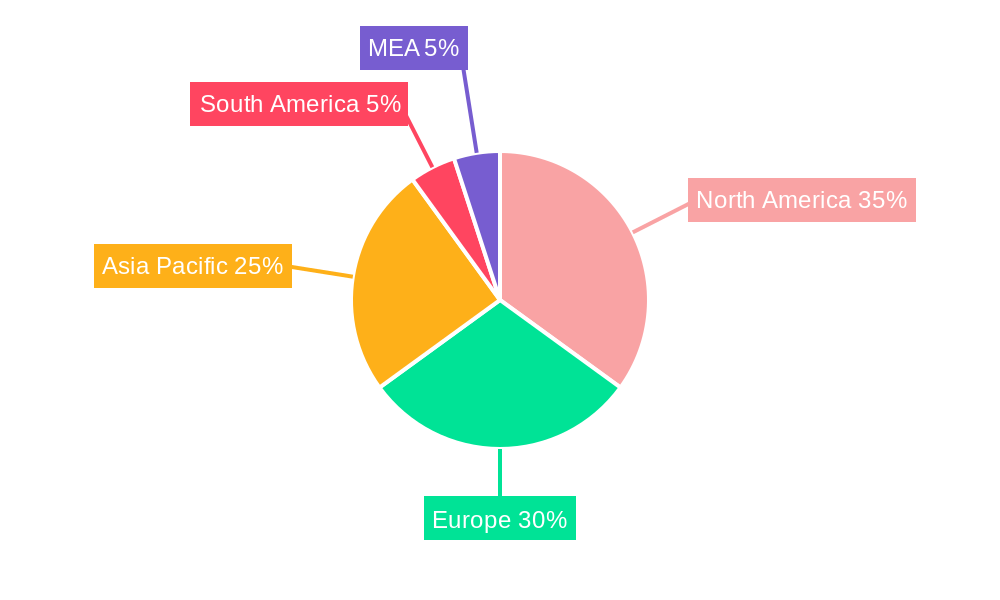
The Utility Asset Management (UAM) market is experiencing robust growth, driven by the increasing need for efficient and reliable electricity grids amidst aging infrastructure and rising energy demands. A compound annual growth rate (CAGR) exceeding 7.5% from 2019 to 2024 suggests a significant market expansion. This growth is propelled by several factors, including the adoption of advanced technologies like AI and IoT for predictive maintenance, the increasing pressure on utilities to improve operational efficiency and reduce costs, and stricter regulatory compliance requirements focusing on grid modernization and resilience. The market is segmented by utility type (public and private) and application (transformers, substations, and transmission & distribution networks), with significant opportunities across all segments. North America and Europe currently hold substantial market shares, but the Asia-Pacific region is projected to experience significant growth due to rapid infrastructure development and expanding energy consumption in countries like China and India. Public utilities represent a larger market segment due to their extensive asset portfolios and higher regulatory scrutiny. The deployment of smart grid technologies is a key trend, facilitating data-driven decision-making and improving asset performance. However, high initial investment costs associated with implementing UAM solutions and the need for skilled workforce capable of managing these advanced systems can pose challenges to market growth.
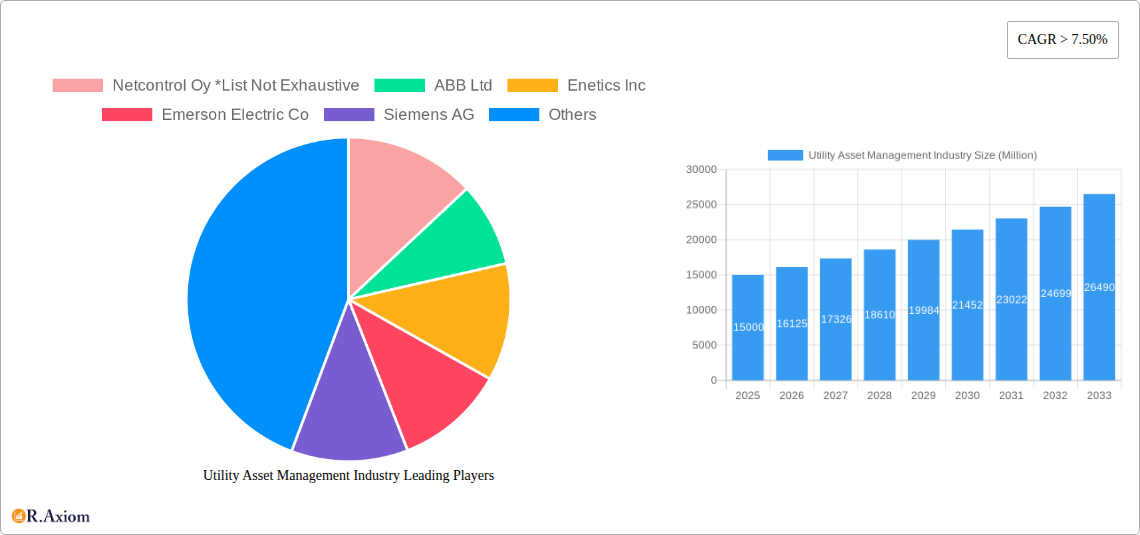
The competitive landscape is characterized by a mix of established players like ABB, Siemens, and General Electric, alongside specialized technology providers such as Netcontrol Oy and Sentient Energy. These companies are continuously innovating to offer comprehensive UAM solutions encompassing hardware, software, and services. The market is witnessing a shift towards cloud-based solutions, offering improved scalability, data accessibility, and cost-effectiveness. The forecast period (2025-2033) is expected to witness continued expansion, driven by government initiatives promoting grid modernization, increased investments in renewable energy infrastructure, and the growing adoption of digital transformation strategies within the utility sector. Strategic partnerships and mergers & acquisitions are anticipated to reshape the competitive landscape during this period. Overall, the UAM market presents a compelling investment opportunity with significant growth potential across various geographical regions and application segments.
Utility Asset Management Industry: A Comprehensive Market Report (2019-2033)
This in-depth report provides a comprehensive analysis of the Utility Asset Management industry, covering market size, segmentation, growth drivers, challenges, and key players. The study period spans from 2019 to 2033, with 2025 as the base and estimated year. The forecast period is 2025-2033, and the historical period covers 2019-2024. The report offers actionable insights for industry stakeholders, investors, and businesses seeking to navigate this dynamic market. The total market size in 2025 is estimated at $XX Million, with projections reaching $YY Million by 2033.
Utility Asset Management Industry Market Concentration & Innovation
The Utility Asset Management industry exhibits a moderately concentrated market structure, with several major players holding significant market share. While precise market share figures for each company are proprietary data, we estimate that the top 5 players collectively hold approximately 60% of the global market in 2025. This concentration is driven by substantial investments in R&D, leading to advanced technological solutions and strong brand recognition. However, the market also accommodates several smaller, specialized players catering to niche segments.
Innovation Drivers:
- Rapid advancements in IoT, AI, and Big Data analytics.
- Increasing focus on grid modernization and smart grid initiatives.
- Growing demand for improved operational efficiency and reduced downtime.
- Stringent regulatory compliance requirements driving the adoption of advanced asset management systems.
Regulatory Frameworks & M&A Activities: Government regulations play a crucial role in shaping the industry landscape, particularly concerning data security, interoperability standards, and grid modernization initiatives. The value of M&A deals in the past five years has totalled approximately $ZZ Million, indicating considerable consolidation and expansion within the sector. These activities often involve the acquisition of smaller, specialized firms by larger, established players to broaden their product portfolios and geographic reach.
Product Substitutes & End-User Trends: While no direct substitutes exist for comprehensive utility asset management systems, the increasing availability of cloud-based solutions presents an alternative to traditional on-premise systems. End-user trends are shifting towards greater data transparency, predictive maintenance capabilities, and integrated solutions.
Utility Asset Management Industry Industry Trends & Insights
The Utility Asset Management industry is experiencing robust growth, fueled by several key trends. The Compound Annual Growth Rate (CAGR) for the forecast period (2025-2033) is projected at xx%. This growth is driven by the increasing complexity of utility grids, the growing integration of renewable energy sources, and the growing importance of enhancing grid resilience and reliability.
Market penetration of advanced asset management systems is steadily increasing, particularly amongst larger utilities. However, smaller utilities face challenges in adopting such solutions due to financial constraints and a lack of technical expertise.
Technological disruptions, including the adoption of IoT sensors, AI-powered predictive maintenance, and digital twins, are transforming the way utilities manage their assets. Consumer preferences are increasingly aligned with reliable service delivery, improved grid resilience, and environmentally sustainable practices. Competitive dynamics are marked by intense competition between established players and emerging technology providers.
Dominant Markets & Segments in Utility Asset Management Industry
North America currently holds the largest market share in the global Utility Asset Management industry, driven by significant investments in grid modernization and the adoption of advanced technologies. Within this region, the United States is the dominant market.
Key Drivers:
- Public Utility Segment: Strong governmental support for grid modernization and investments in smart grid technologies drive significant growth within this segment. The market size for the Public Utility segment is estimated at $XX Million in 2025.
- Private Utility Segment: The increasing focus on operational efficiency and cost reduction is a primary driver of growth in the Private Utility segment, estimated at $YY Million in 2025.
- Application Segments: The Transmission & Distribution Network segment commands the largest market share due to its vast infrastructure and critical role in ensuring reliable electricity supply. The Transformer and Sub-Station segments are also witnessing substantial growth, driven by the need for enhanced monitoring and predictive maintenance.
Utility Asset Management Industry Product Developments
Recent product innovations focus on integrating advanced analytics, AI, and machine learning capabilities into asset management platforms. This allows for predictive maintenance, optimized resource allocation, and improved decision-making. Key competitive advantages include enhanced data visualization, real-time monitoring capabilities, and seamless integration with existing utility systems. The market is seeing a rise in cloud-based solutions, promoting scalability, cost-effectiveness, and improved data accessibility.
Report Scope & Segmentation Analysis
This report provides a detailed segmentation analysis of the Utility Asset Management market based on Utility Type (Public and Private) and Application (Transformer, Sub-Station, Transmission & Distribution Network). Growth projections for each segment are included, alongside market size estimations and competitive analyses. The Public Utility segment is projected to experience a CAGR of xx%, while the Private Utility segment is expected to grow at a CAGR of yy%. Within applications, the Transmission & Distribution Network segment is expected to dominate, followed by the Transformer and Sub-Station segments. Competitive dynamics vary across segments, with intense competition observed in the Transmission & Distribution Network segment.
Key Drivers of Utility Asset Management Industry Growth
The growth of the Utility Asset Management industry is primarily driven by factors such as:
- Technological advancements: IoT, AI, and big data analytics enable proactive asset management, reducing downtime and improving operational efficiency.
- Economic factors: Increased energy demand and the rising cost of power outages create a compelling case for investment in advanced asset management solutions.
- Regulatory mandates: Governments are increasingly emphasizing grid modernization and the adoption of smart grid technologies.
Challenges in the Utility Asset Management Industry Sector
The industry faces challenges such as:
- High initial investment costs: Implementing advanced asset management systems requires significant upfront investment, which can be a barrier for smaller utilities.
- Data security and privacy concerns: The increasing reliance on connected devices and data analytics raises concerns about cybersecurity and data privacy.
- Integration complexities: Integrating new systems with legacy infrastructure can be technically challenging and time-consuming.
Emerging Opportunities in Utility Asset Management Industry
Several emerging opportunities exist within the industry, including:
- Expansion into developing economies: Developing nations are undergoing rapid infrastructure development, creating significant market potential for asset management solutions.
- Growth of microgrids and distributed energy resources: The increasing adoption of microgrids and DERs necessitates sophisticated asset management strategies.
- Development of advanced analytics and predictive maintenance tools: Further advancements in AI and machine learning can lead to more effective and proactive asset management.
Leading Players in the Utility Asset Management Industry Market
- Netcontrol Oy
- ABB Ltd
- Enetics Inc
- Emerson Electric Co
- Siemens AG
- Aclara Technologies LLC
- Lindsey Manufacturing Co
- Sentient Energy Inc
- General Electric Company
- S&C Electric Company
Key Developments in Utility Asset Management Industry Industry
September 2022: An electricity utility in Seguin, Texas, implemented a comprehensive monitoring and control system integrating SCADA, Outage Management System software, AMI technology, GIS Mapping, and energy efficiency software to improve customer reliability and manage dispersed networks. This highlights the increasing adoption of integrated solutions for enhanced grid management.
May 2022: GE Digital launched its Distributed Energy Resource Management System (DERMS), designed to support utilities in integrating and optimizing Distributed Energy Resources (DERs) while maintaining grid safety and resilience. This demonstrates the growing importance of DERMS in managing the evolving energy landscape.
Strategic Outlook for Utility Asset Management Industry Market
The Utility Asset Management industry is poised for continued growth, driven by technological advancements, increasing energy demand, and the imperative to modernize aging infrastructure. The focus on predictive maintenance, data analytics, and grid resilience will shape future market dynamics. Opportunities exist for players offering innovative solutions that improve operational efficiency, reduce downtime, and enhance grid stability. The market will see continued consolidation through M&A activities as larger companies seek to expand their market share and technological capabilities.
Utility Asset Management Industry Segmentation
-
1. Application
- 1.1. Transformer
- 1.2. Sub-Station
- 1.3. Transimission & Distribution Network
-
2. Utility Type
- 2.1. Public Utility
- 2.2. Private Utility
Utility Asset Management Industry Segmentation By Geography
- 1. North America
- 2. Asia Pacific
- 3. Europe
- 4. South America
- 5. Middle East and Africa
Utility Asset Management Industry REPORT HIGHLIGHTS
| Aspects | Details |
|---|---|
| Study Period | 2019-2033 |
| Base Year | 2024 |
| Estimated Year | 2025 |
| Forecast Period | 2025-2033 |
| Historical Period | 2019-2024 |
| Growth Rate | CAGR of > 7.50% from 2019-2033 |
| Segmentation |
|
Table of Contents
- 1. Introduction
- 1.1. Research Scope
- 1.2. Market Segmentation
- 1.3. Research Methodology
- 1.4. Definitions and Assumptions
- 2. Executive Summary
- 2.1. Introduction
- 3. Market Dynamics
- 3.1. Introduction
- 3.2. Market Drivers
- 3.2.1. 4.; Several Government Plans for the Energy Transition in the Region
- 3.3. Market Restrains
- 3.3.1. 4.; Increasing Adoption of Self-generated Renewable Power in the Residential and Commercial Sectors
- 3.4. Market Trends
- 3.4.1. Transformer to Witness Significant Growth
- 4. Market Factor Analysis
- 4.1. Porters Five Forces
- 4.2. Supply/Value Chain
- 4.3. PESTEL analysis
- 4.4. Market Entropy
- 4.5. Patent/Trademark Analysis
- 5. Global Utility Asset Management Industry Analysis, Insights and Forecast, 2019-2031
- 5.1. Market Analysis, Insights and Forecast - by Application
- 5.1.1. Transformer
- 5.1.2. Sub-Station
- 5.1.3. Transimission & Distribution Network
- 5.2. Market Analysis, Insights and Forecast - by Utility Type
- 5.2.1. Public Utility
- 5.2.2. Private Utility
- 5.3. Market Analysis, Insights and Forecast - by Region
- 5.3.1. North America
- 5.3.2. Asia Pacific
- 5.3.3. Europe
- 5.3.4. South America
- 5.3.5. Middle East and Africa
- 5.1. Market Analysis, Insights and Forecast - by Application
- 6. North America Utility Asset Management Industry Analysis, Insights and Forecast, 2019-2031
- 6.1. Market Analysis, Insights and Forecast - by Application
- 6.1.1. Transformer
- 6.1.2. Sub-Station
- 6.1.3. Transimission & Distribution Network
- 6.2. Market Analysis, Insights and Forecast - by Utility Type
- 6.2.1. Public Utility
- 6.2.2. Private Utility
- 6.1. Market Analysis, Insights and Forecast - by Application
- 7. Asia Pacific Utility Asset Management Industry Analysis, Insights and Forecast, 2019-2031
- 7.1. Market Analysis, Insights and Forecast - by Application
- 7.1.1. Transformer
- 7.1.2. Sub-Station
- 7.1.3. Transimission & Distribution Network
- 7.2. Market Analysis, Insights and Forecast - by Utility Type
- 7.2.1. Public Utility
- 7.2.2. Private Utility
- 7.1. Market Analysis, Insights and Forecast - by Application
- 8. Europe Utility Asset Management Industry Analysis, Insights and Forecast, 2019-2031
- 8.1. Market Analysis, Insights and Forecast - by Application
- 8.1.1. Transformer
- 8.1.2. Sub-Station
- 8.1.3. Transimission & Distribution Network
- 8.2. Market Analysis, Insights and Forecast - by Utility Type
- 8.2.1. Public Utility
- 8.2.2. Private Utility
- 8.1. Market Analysis, Insights and Forecast - by Application
- 9. South America Utility Asset Management Industry Analysis, Insights and Forecast, 2019-2031
- 9.1. Market Analysis, Insights and Forecast - by Application
- 9.1.1. Transformer
- 9.1.2. Sub-Station
- 9.1.3. Transimission & Distribution Network
- 9.2. Market Analysis, Insights and Forecast - by Utility Type
- 9.2.1. Public Utility
- 9.2.2. Private Utility
- 9.1. Market Analysis, Insights and Forecast - by Application
- 10. Middle East and Africa Utility Asset Management Industry Analysis, Insights and Forecast, 2019-2031
- 10.1. Market Analysis, Insights and Forecast - by Application
- 10.1.1. Transformer
- 10.1.2. Sub-Station
- 10.1.3. Transimission & Distribution Network
- 10.2. Market Analysis, Insights and Forecast - by Utility Type
- 10.2.1. Public Utility
- 10.2.2. Private Utility
- 10.1. Market Analysis, Insights and Forecast - by Application
- 11. North America Utility Asset Management Industry Analysis, Insights and Forecast, 2019-2031
- 11.1. Market Analysis, Insights and Forecast - By Country/Sub-region
- 11.1.1 United States
- 11.1.2 Canada
- 11.1.3 Mexico
- 12. Europe Utility Asset Management Industry Analysis, Insights and Forecast, 2019-2031
- 12.1. Market Analysis, Insights and Forecast - By Country/Sub-region
- 12.1.1 Germany
- 12.1.2 United Kingdom
- 12.1.3 France
- 12.1.4 Spain
- 12.1.5 Italy
- 12.1.6 Spain
- 12.1.7 Belgium
- 12.1.8 Netherland
- 12.1.9 Nordics
- 12.1.10 Rest of Europe
- 13. Asia Pacific Utility Asset Management Industry Analysis, Insights and Forecast, 2019-2031
- 13.1. Market Analysis, Insights and Forecast - By Country/Sub-region
- 13.1.1 China
- 13.1.2 Japan
- 13.1.3 India
- 13.1.4 South Korea
- 13.1.5 Southeast Asia
- 13.1.6 Australia
- 13.1.7 Indonesia
- 13.1.8 Phillipes
- 13.1.9 Singapore
- 13.1.10 Thailandc
- 13.1.11 Rest of Asia Pacific
- 14. South America Utility Asset Management Industry Analysis, Insights and Forecast, 2019-2031
- 14.1. Market Analysis, Insights and Forecast - By Country/Sub-region
- 14.1.1 Brazil
- 14.1.2 Argentina
- 14.1.3 Peru
- 14.1.4 Chile
- 14.1.5 Colombia
- 14.1.6 Ecuador
- 14.1.7 Venezuela
- 14.1.8 Rest of South America
- 15. North America Utility Asset Management Industry Analysis, Insights and Forecast, 2019-2031
- 15.1. Market Analysis, Insights and Forecast - By Country/Sub-region
- 15.1.1 United States
- 15.1.2 Canada
- 15.1.3 Mexico
- 16. MEA Utility Asset Management Industry Analysis, Insights and Forecast, 2019-2031
- 16.1. Market Analysis, Insights and Forecast - By Country/Sub-region
- 16.1.1 United Arab Emirates
- 16.1.2 Saudi Arabia
- 16.1.3 South Africa
- 16.1.4 Rest of Middle East and Africa
- 17. Competitive Analysis
- 17.1. Global Market Share Analysis 2024
- 17.2. Company Profiles
- 17.2.1 Netcontrol Oy *List Not Exhaustive
- 17.2.1.1. Overview
- 17.2.1.2. Products
- 17.2.1.3. SWOT Analysis
- 17.2.1.4. Recent Developments
- 17.2.1.5. Financials (Based on Availability)
- 17.2.2 ABB Ltd
- 17.2.2.1. Overview
- 17.2.2.2. Products
- 17.2.2.3. SWOT Analysis
- 17.2.2.4. Recent Developments
- 17.2.2.5. Financials (Based on Availability)
- 17.2.3 Enetics Inc
- 17.2.3.1. Overview
- 17.2.3.2. Products
- 17.2.3.3. SWOT Analysis
- 17.2.3.4. Recent Developments
- 17.2.3.5. Financials (Based on Availability)
- 17.2.4 Emerson Electric Co
- 17.2.4.1. Overview
- 17.2.4.2. Products
- 17.2.4.3. SWOT Analysis
- 17.2.4.4. Recent Developments
- 17.2.4.5. Financials (Based on Availability)
- 17.2.5 Siemens AG
- 17.2.5.1. Overview
- 17.2.5.2. Products
- 17.2.5.3. SWOT Analysis
- 17.2.5.4. Recent Developments
- 17.2.5.5. Financials (Based on Availability)
- 17.2.6 Aclara Technologies LLC
- 17.2.6.1. Overview
- 17.2.6.2. Products
- 17.2.6.3. SWOT Analysis
- 17.2.6.4. Recent Developments
- 17.2.6.5. Financials (Based on Availability)
- 17.2.7 Lindsey Manufacturing Co
- 17.2.7.1. Overview
- 17.2.7.2. Products
- 17.2.7.3. SWOT Analysis
- 17.2.7.4. Recent Developments
- 17.2.7.5. Financials (Based on Availability)
- 17.2.8 Sentient Energy Inc
- 17.2.8.1. Overview
- 17.2.8.2. Products
- 17.2.8.3. SWOT Analysis
- 17.2.8.4. Recent Developments
- 17.2.8.5. Financials (Based on Availability)
- 17.2.9 General Electric Company
- 17.2.9.1. Overview
- 17.2.9.2. Products
- 17.2.9.3. SWOT Analysis
- 17.2.9.4. Recent Developments
- 17.2.9.5. Financials (Based on Availability)
- 17.2.10 S&C Electric Company
- 17.2.10.1. Overview
- 17.2.10.2. Products
- 17.2.10.3. SWOT Analysis
- 17.2.10.4. Recent Developments
- 17.2.10.5. Financials (Based on Availability)
- 17.2.1 Netcontrol Oy *List Not Exhaustive
List of Figures
- Figure 1: Global Utility Asset Management Industry Revenue Breakdown (Million, %) by Region 2024 & 2032
- Figure 2: North America Utility Asset Management Industry Revenue (Million), by Country 2024 & 2032
- Figure 3: North America Utility Asset Management Industry Revenue Share (%), by Country 2024 & 2032
- Figure 4: Europe Utility Asset Management Industry Revenue (Million), by Country 2024 & 2032
- Figure 5: Europe Utility Asset Management Industry Revenue Share (%), by Country 2024 & 2032
- Figure 6: Asia Pacific Utility Asset Management Industry Revenue (Million), by Country 2024 & 2032
- Figure 7: Asia Pacific Utility Asset Management Industry Revenue Share (%), by Country 2024 & 2032
- Figure 8: South America Utility Asset Management Industry Revenue (Million), by Country 2024 & 2032
- Figure 9: South America Utility Asset Management Industry Revenue Share (%), by Country 2024 & 2032
- Figure 10: North America Utility Asset Management Industry Revenue (Million), by Country 2024 & 2032
- Figure 11: North America Utility Asset Management Industry Revenue Share (%), by Country 2024 & 2032
- Figure 12: MEA Utility Asset Management Industry Revenue (Million), by Country 2024 & 2032
- Figure 13: MEA Utility Asset Management Industry Revenue Share (%), by Country 2024 & 2032
- Figure 14: North America Utility Asset Management Industry Revenue (Million), by Application 2024 & 2032
- Figure 15: North America Utility Asset Management Industry Revenue Share (%), by Application 2024 & 2032
- Figure 16: North America Utility Asset Management Industry Revenue (Million), by Utility Type 2024 & 2032
- Figure 17: North America Utility Asset Management Industry Revenue Share (%), by Utility Type 2024 & 2032
- Figure 18: North America Utility Asset Management Industry Revenue (Million), by Country 2024 & 2032
- Figure 19: North America Utility Asset Management Industry Revenue Share (%), by Country 2024 & 2032
- Figure 20: Asia Pacific Utility Asset Management Industry Revenue (Million), by Application 2024 & 2032
- Figure 21: Asia Pacific Utility Asset Management Industry Revenue Share (%), by Application 2024 & 2032
- Figure 22: Asia Pacific Utility Asset Management Industry Revenue (Million), by Utility Type 2024 & 2032
- Figure 23: Asia Pacific Utility Asset Management Industry Revenue Share (%), by Utility Type 2024 & 2032
- Figure 24: Asia Pacific Utility Asset Management Industry Revenue (Million), by Country 2024 & 2032
- Figure 25: Asia Pacific Utility Asset Management Industry Revenue Share (%), by Country 2024 & 2032
- Figure 26: Europe Utility Asset Management Industry Revenue (Million), by Application 2024 & 2032
- Figure 27: Europe Utility Asset Management Industry Revenue Share (%), by Application 2024 & 2032
- Figure 28: Europe Utility Asset Management Industry Revenue (Million), by Utility Type 2024 & 2032
- Figure 29: Europe Utility Asset Management Industry Revenue Share (%), by Utility Type 2024 & 2032
- Figure 30: Europe Utility Asset Management Industry Revenue (Million), by Country 2024 & 2032
- Figure 31: Europe Utility Asset Management Industry Revenue Share (%), by Country 2024 & 2032
- Figure 32: South America Utility Asset Management Industry Revenue (Million), by Application 2024 & 2032
- Figure 33: South America Utility Asset Management Industry Revenue Share (%), by Application 2024 & 2032
- Figure 34: South America Utility Asset Management Industry Revenue (Million), by Utility Type 2024 & 2032
- Figure 35: South America Utility Asset Management Industry Revenue Share (%), by Utility Type 2024 & 2032
- Figure 36: South America Utility Asset Management Industry Revenue (Million), by Country 2024 & 2032
- Figure 37: South America Utility Asset Management Industry Revenue Share (%), by Country 2024 & 2032
- Figure 38: Middle East and Africa Utility Asset Management Industry Revenue (Million), by Application 2024 & 2032
- Figure 39: Middle East and Africa Utility Asset Management Industry Revenue Share (%), by Application 2024 & 2032
- Figure 40: Middle East and Africa Utility Asset Management Industry Revenue (Million), by Utility Type 2024 & 2032
- Figure 41: Middle East and Africa Utility Asset Management Industry Revenue Share (%), by Utility Type 2024 & 2032
- Figure 42: Middle East and Africa Utility Asset Management Industry Revenue (Million), by Country 2024 & 2032
- Figure 43: Middle East and Africa Utility Asset Management Industry Revenue Share (%), by Country 2024 & 2032
List of Tables
- Table 1: Global Utility Asset Management Industry Revenue Million Forecast, by Region 2019 & 2032
- Table 2: Global Utility Asset Management Industry Revenue Million Forecast, by Application 2019 & 2032
- Table 3: Global Utility Asset Management Industry Revenue Million Forecast, by Utility Type 2019 & 2032
- Table 4: Global Utility Asset Management Industry Revenue Million Forecast, by Region 2019 & 2032
- Table 5: Global Utility Asset Management Industry Revenue Million Forecast, by Country 2019 & 2032
- Table 6: United States Utility Asset Management Industry Revenue (Million) Forecast, by Application 2019 & 2032
- Table 7: Canada Utility Asset Management Industry Revenue (Million) Forecast, by Application 2019 & 2032
- Table 8: Mexico Utility Asset Management Industry Revenue (Million) Forecast, by Application 2019 & 2032
- Table 9: Global Utility Asset Management Industry Revenue Million Forecast, by Country 2019 & 2032
- Table 10: Germany Utility Asset Management Industry Revenue (Million) Forecast, by Application 2019 & 2032
- Table 11: United Kingdom Utility Asset Management Industry Revenue (Million) Forecast, by Application 2019 & 2032
- Table 12: France Utility Asset Management Industry Revenue (Million) Forecast, by Application 2019 & 2032
- Table 13: Spain Utility Asset Management Industry Revenue (Million) Forecast, by Application 2019 & 2032
- Table 14: Italy Utility Asset Management Industry Revenue (Million) Forecast, by Application 2019 & 2032
- Table 15: Spain Utility Asset Management Industry Revenue (Million) Forecast, by Application 2019 & 2032
- Table 16: Belgium Utility Asset Management Industry Revenue (Million) Forecast, by Application 2019 & 2032
- Table 17: Netherland Utility Asset Management Industry Revenue (Million) Forecast, by Application 2019 & 2032
- Table 18: Nordics Utility Asset Management Industry Revenue (Million) Forecast, by Application 2019 & 2032
- Table 19: Rest of Europe Utility Asset Management Industry Revenue (Million) Forecast, by Application 2019 & 2032
- Table 20: Global Utility Asset Management Industry Revenue Million Forecast, by Country 2019 & 2032
- Table 21: China Utility Asset Management Industry Revenue (Million) Forecast, by Application 2019 & 2032
- Table 22: Japan Utility Asset Management Industry Revenue (Million) Forecast, by Application 2019 & 2032
- Table 23: India Utility Asset Management Industry Revenue (Million) Forecast, by Application 2019 & 2032
- Table 24: South Korea Utility Asset Management Industry Revenue (Million) Forecast, by Application 2019 & 2032
- Table 25: Southeast Asia Utility Asset Management Industry Revenue (Million) Forecast, by Application 2019 & 2032
- Table 26: Australia Utility Asset Management Industry Revenue (Million) Forecast, by Application 2019 & 2032
- Table 27: Indonesia Utility Asset Management Industry Revenue (Million) Forecast, by Application 2019 & 2032
- Table 28: Phillipes Utility Asset Management Industry Revenue (Million) Forecast, by Application 2019 & 2032
- Table 29: Singapore Utility Asset Management Industry Revenue (Million) Forecast, by Application 2019 & 2032
- Table 30: Thailandc Utility Asset Management Industry Revenue (Million) Forecast, by Application 2019 & 2032
- Table 31: Rest of Asia Pacific Utility Asset Management Industry Revenue (Million) Forecast, by Application 2019 & 2032
- Table 32: Global Utility Asset Management Industry Revenue Million Forecast, by Country 2019 & 2032
- Table 33: Brazil Utility Asset Management Industry Revenue (Million) Forecast, by Application 2019 & 2032
- Table 34: Argentina Utility Asset Management Industry Revenue (Million) Forecast, by Application 2019 & 2032
- Table 35: Peru Utility Asset Management Industry Revenue (Million) Forecast, by Application 2019 & 2032
- Table 36: Chile Utility Asset Management Industry Revenue (Million) Forecast, by Application 2019 & 2032
- Table 37: Colombia Utility Asset Management Industry Revenue (Million) Forecast, by Application 2019 & 2032
- Table 38: Ecuador Utility Asset Management Industry Revenue (Million) Forecast, by Application 2019 & 2032
- Table 39: Venezuela Utility Asset Management Industry Revenue (Million) Forecast, by Application 2019 & 2032
- Table 40: Rest of South America Utility Asset Management Industry Revenue (Million) Forecast, by Application 2019 & 2032
- Table 41: Global Utility Asset Management Industry Revenue Million Forecast, by Country 2019 & 2032
- Table 42: United States Utility Asset Management Industry Revenue (Million) Forecast, by Application 2019 & 2032
- Table 43: Canada Utility Asset Management Industry Revenue (Million) Forecast, by Application 2019 & 2032
- Table 44: Mexico Utility Asset Management Industry Revenue (Million) Forecast, by Application 2019 & 2032
- Table 45: Global Utility Asset Management Industry Revenue Million Forecast, by Country 2019 & 2032
- Table 46: United Arab Emirates Utility Asset Management Industry Revenue (Million) Forecast, by Application 2019 & 2032
- Table 47: Saudi Arabia Utility Asset Management Industry Revenue (Million) Forecast, by Application 2019 & 2032
- Table 48: South Africa Utility Asset Management Industry Revenue (Million) Forecast, by Application 2019 & 2032
- Table 49: Rest of Middle East and Africa Utility Asset Management Industry Revenue (Million) Forecast, by Application 2019 & 2032
- Table 50: Global Utility Asset Management Industry Revenue Million Forecast, by Application 2019 & 2032
- Table 51: Global Utility Asset Management Industry Revenue Million Forecast, by Utility Type 2019 & 2032
- Table 52: Global Utility Asset Management Industry Revenue Million Forecast, by Country 2019 & 2032
- Table 53: Global Utility Asset Management Industry Revenue Million Forecast, by Application 2019 & 2032
- Table 54: Global Utility Asset Management Industry Revenue Million Forecast, by Utility Type 2019 & 2032
- Table 55: Global Utility Asset Management Industry Revenue Million Forecast, by Country 2019 & 2032
- Table 56: Global Utility Asset Management Industry Revenue Million Forecast, by Application 2019 & 2032
- Table 57: Global Utility Asset Management Industry Revenue Million Forecast, by Utility Type 2019 & 2032
- Table 58: Global Utility Asset Management Industry Revenue Million Forecast, by Country 2019 & 2032
- Table 59: Global Utility Asset Management Industry Revenue Million Forecast, by Application 2019 & 2032
- Table 60: Global Utility Asset Management Industry Revenue Million Forecast, by Utility Type 2019 & 2032
- Table 61: Global Utility Asset Management Industry Revenue Million Forecast, by Country 2019 & 2032
- Table 62: Global Utility Asset Management Industry Revenue Million Forecast, by Application 2019 & 2032
- Table 63: Global Utility Asset Management Industry Revenue Million Forecast, by Utility Type 2019 & 2032
- Table 64: Global Utility Asset Management Industry Revenue Million Forecast, by Country 2019 & 2032
Frequently Asked Questions
1. What is the projected Compound Annual Growth Rate (CAGR) of the Utility Asset Management Industry?
The projected CAGR is approximately > 7.50%.
2. Which companies are prominent players in the Utility Asset Management Industry?
Key companies in the market include Netcontrol Oy *List Not Exhaustive, ABB Ltd, Enetics Inc, Emerson Electric Co, Siemens AG, Aclara Technologies LLC, Lindsey Manufacturing Co, Sentient Energy Inc, General Electric Company, S&C Electric Company.
3. What are the main segments of the Utility Asset Management Industry?
The market segments include Application, Utility Type.
4. Can you provide details about the market size?
The market size is estimated to be USD XX Million as of 2022.
5. What are some drivers contributing to market growth?
4.; Several Government Plans for the Energy Transition in the Region.
6. What are the notable trends driving market growth?
Transformer to Witness Significant Growth.
7. Are there any restraints impacting market growth?
4.; Increasing Adoption of Self-generated Renewable Power in the Residential and Commercial Sectors.
8. Can you provide examples of recent developments in the market?
September 2022: An electricity utility in Seguin, Texas, installed a complete monitoring and control system. The utility installed a SCADA system and integrated it with Outage Management System software, Advanced Metering Infrastructure (AMI) technology, GIS Mapping, and energy efficiency software to improve customer reliability. This system would help the utility to manage the vast and dispersed networks.
9. What pricing options are available for accessing the report?
Pricing options include single-user, multi-user, and enterprise licenses priced at USD 4750, USD 5250, and USD 8750 respectively.
10. Is the market size provided in terms of value or volume?
The market size is provided in terms of value, measured in Million.
11. Are there any specific market keywords associated with the report?
Yes, the market keyword associated with the report is "Utility Asset Management Industry," which aids in identifying and referencing the specific market segment covered.
12. How do I determine which pricing option suits my needs best?
The pricing options vary based on user requirements and access needs. Individual users may opt for single-user licenses, while businesses requiring broader access may choose multi-user or enterprise licenses for cost-effective access to the report.
13. Are there any additional resources or data provided in the Utility Asset Management Industry report?
While the report offers comprehensive insights, it's advisable to review the specific contents or supplementary materials provided to ascertain if additional resources or data are available.
14. How can I stay updated on further developments or reports in the Utility Asset Management Industry?
To stay informed about further developments, trends, and reports in the Utility Asset Management Industry, consider subscribing to industry newsletters, following relevant companies and organizations, or regularly checking reputable industry news sources and publications.
Methodology
Step 1 - Identification of Relevant Samples Size from Population Database


Step 2 - Approaches for Defining Global Market Size (Value, Volume* & Price*)

Note*: In applicable scenarios
Step 3 - Data Sources
Primary Research
- Web Analytics
- Survey Reports
- Research Institute
- Latest Research Reports
- Opinion Leaders
Secondary Research
- Annual Reports
- White Paper
- Latest Press Release
- Industry Association
- Paid Database
- Investor Presentations

Step 4 - Data Triangulation
Involves using different sources of information in order to increase the validity of a study
These sources are likely to be stakeholders in a program - participants, other researchers, program staff, other community members, and so on.
Then we put all data in single framework & apply various statistical tools to find out the dynamic on the market.
During the analysis stage, feedback from the stakeholder groups would be compared to determine areas of agreement as well as areas of divergence


