
Key Insights
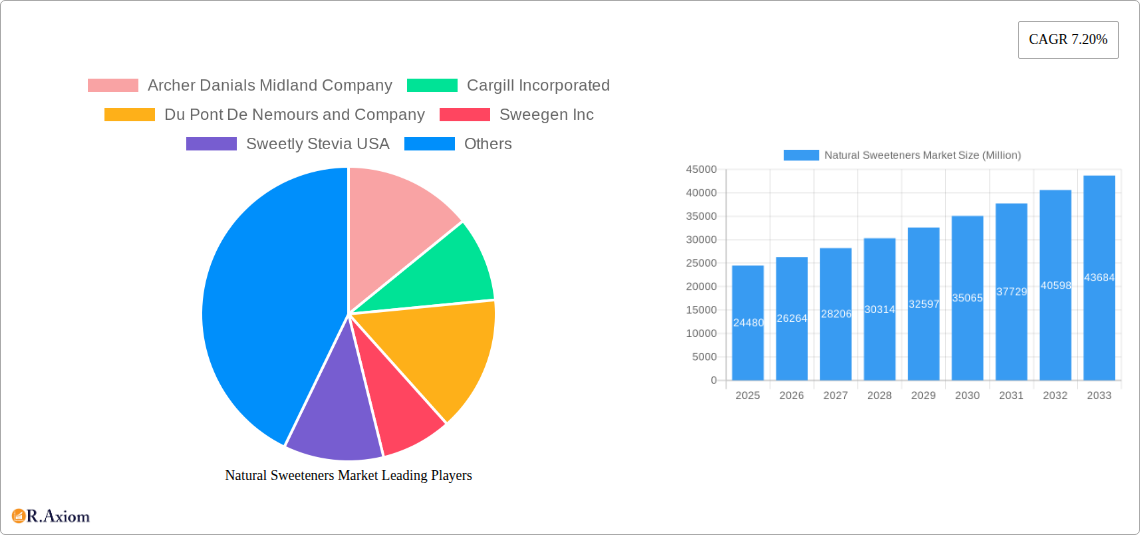
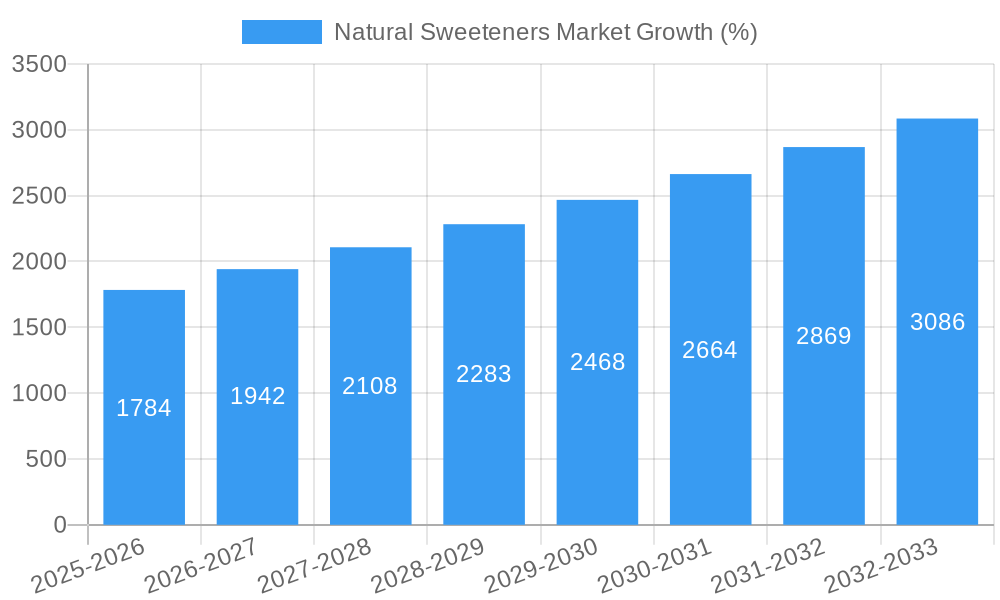
The global natural sweeteners market, valued at $24,480 million in 2025, is poised for robust growth, exhibiting a Compound Annual Growth Rate (CAGR) of 7.20% from 2025 to 2033. This expansion is driven by several key factors. The increasing prevalence of health-conscious consumers seeking alternatives to artificial sweeteners is a primary driver. Growing awareness of the detrimental health effects associated with excessive sugar consumption fuels demand for healthier alternatives like stevia, erythritol, and xylitol. Furthermore, the rising incidence of diabetes and obesity is further accelerating market growth. The burgeoning food and beverage industry, particularly in the bakery, confectionery, dairy, and beverage segments, is a significant contributor to market expansion, as manufacturers incorporate natural sweeteners to cater to consumer preferences for healthier product options. Technological advancements in sweetener extraction and processing are also playing a crucial role in improving product quality and reducing production costs, making natural sweeteners more accessible and cost-effective.
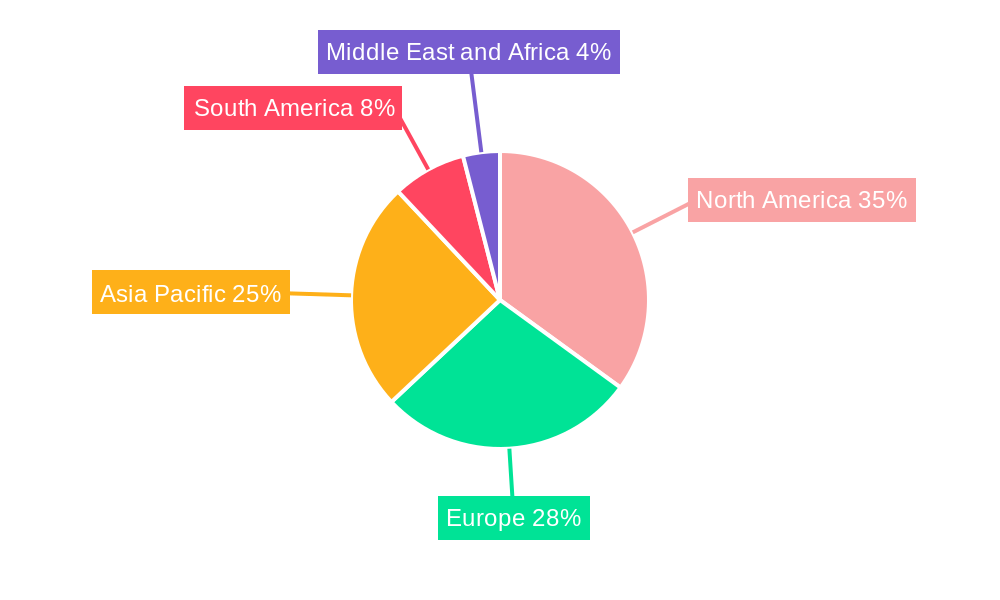
Regional analysis reveals a diverse market landscape. North America, with its established health-conscious consumer base and strong regulatory frameworks supporting natural food products, currently holds a substantial market share. However, the Asia-Pacific region, fueled by rapid economic growth and a burgeoning middle class with increasing disposable incomes, is expected to witness significant growth in the coming years. Europe, with its stringent food safety regulations and increasing demand for clean-label products, also presents a lucrative market opportunity. Competition among key players like Archer Daniels Midland, Cargill, and Ingredion is intense, with companies focusing on product innovation, strategic partnerships, and mergers and acquisitions to strengthen their market position. The market segmentation, encompassing various sweeteners (stevia, sorbitol, mannitol, xylitol, erythritol, and others) and diverse applications across different food categories, presents considerable opportunities for specialized product development and market penetration.
Natural Sweeteners Market: A Comprehensive Report (2019-2033)
This detailed report provides a comprehensive analysis of the global natural sweeteners market, covering market size, segmentation, growth drivers, challenges, and key players. With a study period spanning 2019-2033, a base year of 2025, and a forecast period of 2025-2033, this report offers actionable insights for industry stakeholders, investors, and businesses seeking to understand this dynamic market. The market is valued at xx Million in 2025 and is projected to reach xx Million by 2033, exhibiting a CAGR of xx% during the forecast period.
Natural Sweeteners Market Concentration & Innovation
The natural sweeteners market is characterized by a moderately concentrated landscape, with a few major players holding significant market share. Archer Daniels Midland Company, Cargill Incorporated, and Tate & Lyle are among the dominant players, leveraging their extensive production capabilities and distribution networks. However, the market also features several smaller, specialized companies focusing on specific sweetener types, such as stevia and erythritol. Market share data for 2025 shows ADM holding approximately xx% share, Cargill at xx%, and Tate & Lyle at xx%. The remaining share is distributed among other players.
Innovation is a key driver within the sector, fueled by consumer demand for healthier alternatives to traditional sugars. Companies are investing heavily in research and development to create novel sweeteners with improved taste profiles, functionalities, and cost-effectiveness. This includes exploring new extraction methods, developing blends of sweeteners, and creating customized solutions for specific applications.
Regulatory frameworks play a significant role in shaping the market. Changes in labeling regulations, health guidelines, and food safety standards impact product development and marketing strategies. The adoption of Codex Alimentarius specifications for steviol glycosides, for instance, has opened up new market opportunities. Furthermore, the increasing availability of substitutes, such as sugar alcohols and high-intensity sweeteners, adds competitive pressure.
Mergers and acquisitions (M&A) activities have also been a feature, with deal values exceeding xx Million in recent years. These acquisitions are driven by a desire to expand product portfolios, access new technologies, and strengthen market positions. Recent M&A activity includes [Insert details of specific M&A deals if available, with deal values, otherwise state "Specific deal details are not publicly available at this time"]. End-user trends toward healthier lifestyles and increased awareness of sugar's impact on health are key factors driving market expansion.
Natural Sweeteners Market Industry Trends & Insights
The global natural sweeteners market is witnessing robust growth driven by several factors. The rising prevalence of diabetes, obesity, and other health issues related to sugar consumption is significantly boosting demand for healthier alternatives. Consumers are increasingly seeking out food and beverages with reduced or no added sugar, driving significant growth within the natural sweetener sector. The growing health-conscious population, coupled with the increasing awareness of the negative health consequences associated with artificial sweeteners, is further accelerating market expansion.
Technological advancements in sweetener production are also contributing to market growth. Improved extraction techniques, enzymatic processes, and innovative formulation strategies are resulting in high-quality, cost-effective natural sweeteners. These advancements are enhancing the taste, texture, and functionality of natural sweeteners, making them increasingly competitive with traditional sugar. The market penetration of natural sweeteners in various food and beverage categories has increased considerably over the past few years, with notable gains in the bakery, confectionery, and beverage sectors. The CAGR for the market during the historical period (2019-2024) was xx%, indicating strong growth momentum.
Competitive dynamics are intense, with established players and emerging companies vying for market share. Companies are employing various strategies, including product innovation, strategic partnerships, and geographic expansion to gain a competitive edge.
Dominant Markets & Segments in Natural Sweeteners Market
Leading Region/Country: The North American market holds a dominant position in the global natural sweeteners market, driven by high consumer demand for health-conscious food options and a well-established food processing industry. Europe follows closely, with strong growth in demand. Asia-Pacific is also experiencing rapid growth, driven by increasing health awareness, changing consumer lifestyles, and economic expansion.
Dominant Segments:
Type: Stevia holds the largest market share among natural sweeteners due to its high sweetness intensity, zero calories, and growing consumer acceptance. Erythritol is gaining popularity because of its clean taste and good functional properties. Other sugar alcohols like sorbitol, mannitol, and xylitol are commonly used, although their market share is smaller than stevia and erythritol.
Application: The beverages segment holds the largest market share owing to the increasing demand for sugar-free and low-sugar beverages. The bakery and confectionery segments also exhibit substantial growth due to the incorporation of natural sweeteners in various baked goods and confectionery products.
Key Drivers (by region):
- North America: Strong regulatory support for natural ingredients, high consumer disposable income, and established food & beverage industries.
- Europe: Growing health awareness, stringent regulations on sugar, and increasing demand for functional foods.
- Asia-Pacific: Rising health consciousness, rapid economic growth, and expanding food & beverage sector.
Natural Sweeteners Market Product Developments
Recent product developments showcase a focus on improved taste, functionality, and cost-effectiveness. Companies are developing innovative sweetener blends to achieve the desired sweetness and functionalities, and using advanced extraction and purification methods. The focus is on creating products that closely mimic the taste and performance of sugar, minimizing any off-notes or other undesirable properties often associated with earlier natural sweeteners. The launch of new products like Tate & Lyle's Erytesse highlights this trend, as it offers a high-sweetness, zero-calorie option for diverse applications. This focus is essential to increase market acceptance and penetration in diverse food and beverage applications.
Report Scope & Segmentation Analysis
This report segments the natural sweeteners market based on type (Stevia, Sorbitol, Mannitol, Xylitol, Erythritol, Other Natural Sweeteners) and application (Bakery, Confectionary, Dairy, Beverages, Other Applications). Each segment's growth projection, market size for 2025, and competitive dynamics are thoroughly analyzed. The report provides detailed information on the market size and growth rate for each segment during the historical, base, and forecast periods. The competitive landscape within each segment is also assessed, considering the presence of key players, their market share, and their strategic moves. Detailed analysis includes revenue estimations, market positioning, and growth forecasts for all segments.
Key Drivers of Natural Sweeteners Market Growth
The natural sweeteners market is fueled by several factors:
- Growing health concerns: Rising prevalence of diabetes and obesity is pushing consumers toward healthier sugar alternatives.
- Increased consumer awareness: Better understanding of the negative effects of artificial sweeteners and added sugar is driving demand.
- Technological advancements: Improvements in extraction methods and product formulation result in higher-quality and more cost-effective sweeteners.
- Favorable regulatory environment: Government regulations encouraging the use of natural ingredients create opportunities for market growth.
Challenges in the Natural Sweeteners Market Sector
Several challenges hinder market growth:
- High production costs: The production of some natural sweeteners can be expensive, impacting their overall market price competitiveness.
- Taste and functionality limitations: Some natural sweeteners may not perfectly replicate the taste and functionality of sugar, limiting their applications.
- Supply chain issues: Fluctuations in raw material availability can affect production volume and stability.
- Stringent regulatory requirements: Meeting rigorous safety standards can pose challenges for manufacturers.
Emerging Opportunities in Natural Sweeteners Market
Several emerging opportunities exist for growth:
- Expansion into new markets: Developing countries with increasing disposable income represent significant growth potential.
- Development of novel sweeteners: Research and development of new sweeteners with improved properties, like enhanced taste and functionalities, offer significant opportunities.
- Focus on specific applications: Creating customized sweetener solutions for specialized food and beverage products can enhance market penetration.
- Sustainable sourcing practices: Consumers are increasingly prioritizing sustainability, creating an opportunity to promote sustainably sourced sweeteners.
Leading Players in the Natural Sweeteners Market Market
- Archer Danials Midland Company
- Cargill Incorporated
- Du Pont De Nemours and Company
- Sweegen Inc
- Sweetly Stevia USA
- Saraya Co Ltd (Lakanto)
- Associated British Foods PLC
- Ingredion Incorporated
- Roquette Freres
- Firmenich S
- Tate & Lyle
- Sunwin Stevia International
Key Developments in Natural Sweeteners Market Industry
- November 2022: Tate & Lyle Plc launched "Erytesse" Erythritol, a zero-calorie sweetener with 70% sweetness of sucrose, expanding its product portfolio and addressing the growing demand for sugar-free options.
- March 2022: Sweegen Inc. launched its Signature Stevia product portfolio in Mexico, capitalizing on the adoption of Codex Alimentarius specifications and expanding its market reach.
- April 2021: Manus Bio Inc. launched NutraSweet Natural, a zero-calorie, plant-based sweetener, further diversifying the stevia-based sweetener options available in the market.
Strategic Outlook for Natural Sweeteners Market Market
The natural sweeteners market holds immense potential for continued growth, driven by strong consumer demand for healthy alternatives to traditional sugars. The ongoing innovation in sweetener technology, coupled with the expanding health-conscious consumer base and supportive regulatory environments, ensures a positive outlook for the market. The focus on sustainability and the development of novel sweeteners with improved functionalities will further propel market expansion in the coming years.
Natural Sweeteners Market Segmentation
-
1. Type
- 1.1. Stevia
- 1.2. Sorbitol
- 1.3. Mannitol
- 1.4. Xylitol
- 1.5. Erythritol
- 1.6. Other Natural Sweeteners
-
2. Application
- 2.1. Bakery
- 2.2. Confectionary
- 2.3. Dairy
- 2.4. Beverages
- 2.5. Other Applications
Natural Sweeteners Market Segmentation By Geography
-
1. North America
- 1.1. United States
- 1.2. Canada
- 1.3. Mexico
- 1.4. Rest of North America
-
2. Europe
- 2.1. Spain
- 2.2. United Kingdom
- 2.3. France
- 2.4. Germany
- 2.5. Italy
- 2.6. Rest of Europe
-
3. Asia Pacific
- 3.1. China
- 3.2. Japan
- 3.3. India
- 3.4. Australia
- 3.5. Rest of Asia Pacific
-
4. South America
- 4.1. Brazil
- 4.2. Argentina
- 4.3. Rest of South America
-
5. Middle East and Africa
- 5.1. South Africa
- 5.2. Saudi Arabia
- 5.3. Rest of Middle East and Africa
Natural Sweeteners Market REPORT HIGHLIGHTS
| Aspects | Details |
|---|---|
| Study Period | 2019-2033 |
| Base Year | 2024 |
| Estimated Year | 2025 |
| Forecast Period | 2025-2033 |
| Historical Period | 2019-2024 |
| Growth Rate | CAGR of 7.20% from 2019-2033 |
| Segmentation |
|
Table of Contents
- 1. Introduction
- 1.1. Research Scope
- 1.2. Market Segmentation
- 1.3. Research Methodology
- 1.4. Definitions and Assumptions
- 2. Executive Summary
- 2.1. Introduction
- 3. Market Dynamics
- 3.1. Introduction
- 3.2. Market Drivers
- 3.2.1. Rising Incidence of Obesity and Cadiovascular Diseases; Growing Trend of Veganism Drives the Market
- 3.3. Market Restrains
- 3.3.1. Associated Allergies With Plant Proteins
- 3.4. Market Trends
- 3.4.1. Increasing Health Consciousness Among Consumers to Boost Natural Sweeteners
- 4. Market Factor Analysis
- 4.1. Porters Five Forces
- 4.2. Supply/Value Chain
- 4.3. PESTEL analysis
- 4.4. Market Entropy
- 4.5. Patent/Trademark Analysis
- 5. Global Natural Sweeteners Market Analysis, Insights and Forecast, 2019-2031
- 5.1. Market Analysis, Insights and Forecast - by Type
- 5.1.1. Stevia
- 5.1.2. Sorbitol
- 5.1.3. Mannitol
- 5.1.4. Xylitol
- 5.1.5. Erythritol
- 5.1.6. Other Natural Sweeteners
- 5.2. Market Analysis, Insights and Forecast - by Application
- 5.2.1. Bakery
- 5.2.2. Confectionary
- 5.2.3. Dairy
- 5.2.4. Beverages
- 5.2.5. Other Applications
- 5.3. Market Analysis, Insights and Forecast - by Region
- 5.3.1. North America
- 5.3.2. Europe
- 5.3.3. Asia Pacific
- 5.3.4. South America
- 5.3.5. Middle East and Africa
- 5.1. Market Analysis, Insights and Forecast - by Type
- 6. North America Natural Sweeteners Market Analysis, Insights and Forecast, 2019-2031
- 6.1. Market Analysis, Insights and Forecast - by Type
- 6.1.1. Stevia
- 6.1.2. Sorbitol
- 6.1.3. Mannitol
- 6.1.4. Xylitol
- 6.1.5. Erythritol
- 6.1.6. Other Natural Sweeteners
- 6.2. Market Analysis, Insights and Forecast - by Application
- 6.2.1. Bakery
- 6.2.2. Confectionary
- 6.2.3. Dairy
- 6.2.4. Beverages
- 6.2.5. Other Applications
- 6.1. Market Analysis, Insights and Forecast - by Type
- 7. Europe Natural Sweeteners Market Analysis, Insights and Forecast, 2019-2031
- 7.1. Market Analysis, Insights and Forecast - by Type
- 7.1.1. Stevia
- 7.1.2. Sorbitol
- 7.1.3. Mannitol
- 7.1.4. Xylitol
- 7.1.5. Erythritol
- 7.1.6. Other Natural Sweeteners
- 7.2. Market Analysis, Insights and Forecast - by Application
- 7.2.1. Bakery
- 7.2.2. Confectionary
- 7.2.3. Dairy
- 7.2.4. Beverages
- 7.2.5. Other Applications
- 7.1. Market Analysis, Insights and Forecast - by Type
- 8. Asia Pacific Natural Sweeteners Market Analysis, Insights and Forecast, 2019-2031
- 8.1. Market Analysis, Insights and Forecast - by Type
- 8.1.1. Stevia
- 8.1.2. Sorbitol
- 8.1.3. Mannitol
- 8.1.4. Xylitol
- 8.1.5. Erythritol
- 8.1.6. Other Natural Sweeteners
- 8.2. Market Analysis, Insights and Forecast - by Application
- 8.2.1. Bakery
- 8.2.2. Confectionary
- 8.2.3. Dairy
- 8.2.4. Beverages
- 8.2.5. Other Applications
- 8.1. Market Analysis, Insights and Forecast - by Type
- 9. South America Natural Sweeteners Market Analysis, Insights and Forecast, 2019-2031
- 9.1. Market Analysis, Insights and Forecast - by Type
- 9.1.1. Stevia
- 9.1.2. Sorbitol
- 9.1.3. Mannitol
- 9.1.4. Xylitol
- 9.1.5. Erythritol
- 9.1.6. Other Natural Sweeteners
- 9.2. Market Analysis, Insights and Forecast - by Application
- 9.2.1. Bakery
- 9.2.2. Confectionary
- 9.2.3. Dairy
- 9.2.4. Beverages
- 9.2.5. Other Applications
- 9.1. Market Analysis, Insights and Forecast - by Type
- 10. Middle East and Africa Natural Sweeteners Market Analysis, Insights and Forecast, 2019-2031
- 10.1. Market Analysis, Insights and Forecast - by Type
- 10.1.1. Stevia
- 10.1.2. Sorbitol
- 10.1.3. Mannitol
- 10.1.4. Xylitol
- 10.1.5. Erythritol
- 10.1.6. Other Natural Sweeteners
- 10.2. Market Analysis, Insights and Forecast - by Application
- 10.2.1. Bakery
- 10.2.2. Confectionary
- 10.2.3. Dairy
- 10.2.4. Beverages
- 10.2.5. Other Applications
- 10.1. Market Analysis, Insights and Forecast - by Type
- 11. North America Natural Sweeteners Market Analysis, Insights and Forecast, 2019-2031
- 11.1. Market Analysis, Insights and Forecast - By Country/Sub-region
- 11.1.1 United States
- 11.1.2 Canada
- 11.1.3 Mexico
- 11.1.4 Rest of North America
- 12. Europe Natural Sweeteners Market Analysis, Insights and Forecast, 2019-2031
- 12.1. Market Analysis, Insights and Forecast - By Country/Sub-region
- 12.1.1 Spain
- 12.1.2 United Kingdom
- 12.1.3 France
- 12.1.4 Germany
- 12.1.5 Italy
- 12.1.6 Rest of Europe
- 13. Asia Pacific Natural Sweeteners Market Analysis, Insights and Forecast, 2019-2031
- 13.1. Market Analysis, Insights and Forecast - By Country/Sub-region
- 13.1.1 China
- 13.1.2 Japan
- 13.1.3 India
- 13.1.4 Australia
- 13.1.5 Rest of Asia Pacific
- 14. South America Natural Sweeteners Market Analysis, Insights and Forecast, 2019-2031
- 14.1. Market Analysis, Insights and Forecast - By Country/Sub-region
- 14.1.1 Brazil
- 14.1.2 Argentina
- 14.1.3 Rest of South America
- 15. Middle East and Africa Natural Sweeteners Market Analysis, Insights and Forecast, 2019-2031
- 15.1. Market Analysis, Insights and Forecast - By Country/Sub-region
- 15.1.1 South Africa
- 15.1.2 Saudi Arabia
- 15.1.3 Rest of Middle East and Africa
- 16. Competitive Analysis
- 16.1. Global Market Share Analysis 2024
- 16.2. Company Profiles
- 16.2.1 Archer Danials Midland Company
- 16.2.1.1. Overview
- 16.2.1.2. Products
- 16.2.1.3. SWOT Analysis
- 16.2.1.4. Recent Developments
- 16.2.1.5. Financials (Based on Availability)
- 16.2.2 Cargill Incorporated
- 16.2.2.1. Overview
- 16.2.2.2. Products
- 16.2.2.3. SWOT Analysis
- 16.2.2.4. Recent Developments
- 16.2.2.5. Financials (Based on Availability)
- 16.2.3 Du Pont De Nemours and Company
- 16.2.3.1. Overview
- 16.2.3.2. Products
- 16.2.3.3. SWOT Analysis
- 16.2.3.4. Recent Developments
- 16.2.3.5. Financials (Based on Availability)
- 16.2.4 Sweegen Inc
- 16.2.4.1. Overview
- 16.2.4.2. Products
- 16.2.4.3. SWOT Analysis
- 16.2.4.4. Recent Developments
- 16.2.4.5. Financials (Based on Availability)
- 16.2.5 Sweetly Stevia USA
- 16.2.5.1. Overview
- 16.2.5.2. Products
- 16.2.5.3. SWOT Analysis
- 16.2.5.4. Recent Developments
- 16.2.5.5. Financials (Based on Availability)
- 16.2.6 Saraya Co Ltd (Lakanto)
- 16.2.6.1. Overview
- 16.2.6.2. Products
- 16.2.6.3. SWOT Analysis
- 16.2.6.4. Recent Developments
- 16.2.6.5. Financials (Based on Availability)
- 16.2.7 Associated British Foods PLC
- 16.2.7.1. Overview
- 16.2.7.2. Products
- 16.2.7.3. SWOT Analysis
- 16.2.7.4. Recent Developments
- 16.2.7.5. Financials (Based on Availability)
- 16.2.8 Ingredion Incorporated
- 16.2.8.1. Overview
- 16.2.8.2. Products
- 16.2.8.3. SWOT Analysis
- 16.2.8.4. Recent Developments
- 16.2.8.5. Financials (Based on Availability)
- 16.2.9 Roquette Freres
- 16.2.9.1. Overview
- 16.2.9.2. Products
- 16.2.9.3. SWOT Analysis
- 16.2.9.4. Recent Developments
- 16.2.9.5. Financials (Based on Availability)
- 16.2.10 Firmenich S
- 16.2.10.1. Overview
- 16.2.10.2. Products
- 16.2.10.3. SWOT Analysis
- 16.2.10.4. Recent Developments
- 16.2.10.5. Financials (Based on Availability)
- 16.2.11 Tate & Lyle
- 16.2.11.1. Overview
- 16.2.11.2. Products
- 16.2.11.3. SWOT Analysis
- 16.2.11.4. Recent Developments
- 16.2.11.5. Financials (Based on Availability)
- 16.2.12 Sunwin Stevia International
- 16.2.12.1. Overview
- 16.2.12.2. Products
- 16.2.12.3. SWOT Analysis
- 16.2.12.4. Recent Developments
- 16.2.12.5. Financials (Based on Availability)
- 16.2.1 Archer Danials Midland Company
List of Figures
- Figure 1: Global Natural Sweeteners Market Revenue Breakdown (Million, %) by Region 2024 & 2032
- Figure 2: Global Natural Sweeteners Market Volume Breakdown (K Tons, %) by Region 2024 & 2032
- Figure 3: North America Natural Sweeteners Market Revenue (Million), by Country 2024 & 2032
- Figure 4: North America Natural Sweeteners Market Volume (K Tons), by Country 2024 & 2032
- Figure 5: North America Natural Sweeteners Market Revenue Share (%), by Country 2024 & 2032
- Figure 6: North America Natural Sweeteners Market Volume Share (%), by Country 2024 & 2032
- Figure 7: Europe Natural Sweeteners Market Revenue (Million), by Country 2024 & 2032
- Figure 8: Europe Natural Sweeteners Market Volume (K Tons), by Country 2024 & 2032
- Figure 9: Europe Natural Sweeteners Market Revenue Share (%), by Country 2024 & 2032
- Figure 10: Europe Natural Sweeteners Market Volume Share (%), by Country 2024 & 2032
- Figure 11: Asia Pacific Natural Sweeteners Market Revenue (Million), by Country 2024 & 2032
- Figure 12: Asia Pacific Natural Sweeteners Market Volume (K Tons), by Country 2024 & 2032
- Figure 13: Asia Pacific Natural Sweeteners Market Revenue Share (%), by Country 2024 & 2032
- Figure 14: Asia Pacific Natural Sweeteners Market Volume Share (%), by Country 2024 & 2032
- Figure 15: South America Natural Sweeteners Market Revenue (Million), by Country 2024 & 2032
- Figure 16: South America Natural Sweeteners Market Volume (K Tons), by Country 2024 & 2032
- Figure 17: South America Natural Sweeteners Market Revenue Share (%), by Country 2024 & 2032
- Figure 18: South America Natural Sweeteners Market Volume Share (%), by Country 2024 & 2032
- Figure 19: Middle East and Africa Natural Sweeteners Market Revenue (Million), by Country 2024 & 2032
- Figure 20: Middle East and Africa Natural Sweeteners Market Volume (K Tons), by Country 2024 & 2032
- Figure 21: Middle East and Africa Natural Sweeteners Market Revenue Share (%), by Country 2024 & 2032
- Figure 22: Middle East and Africa Natural Sweeteners Market Volume Share (%), by Country 2024 & 2032
- Figure 23: North America Natural Sweeteners Market Revenue (Million), by Type 2024 & 2032
- Figure 24: North America Natural Sweeteners Market Volume (K Tons), by Type 2024 & 2032
- Figure 25: North America Natural Sweeteners Market Revenue Share (%), by Type 2024 & 2032
- Figure 26: North America Natural Sweeteners Market Volume Share (%), by Type 2024 & 2032
- Figure 27: North America Natural Sweeteners Market Revenue (Million), by Application 2024 & 2032
- Figure 28: North America Natural Sweeteners Market Volume (K Tons), by Application 2024 & 2032
- Figure 29: North America Natural Sweeteners Market Revenue Share (%), by Application 2024 & 2032
- Figure 30: North America Natural Sweeteners Market Volume Share (%), by Application 2024 & 2032
- Figure 31: North America Natural Sweeteners Market Revenue (Million), by Country 2024 & 2032
- Figure 32: North America Natural Sweeteners Market Volume (K Tons), by Country 2024 & 2032
- Figure 33: North America Natural Sweeteners Market Revenue Share (%), by Country 2024 & 2032
- Figure 34: North America Natural Sweeteners Market Volume Share (%), by Country 2024 & 2032
- Figure 35: Europe Natural Sweeteners Market Revenue (Million), by Type 2024 & 2032
- Figure 36: Europe Natural Sweeteners Market Volume (K Tons), by Type 2024 & 2032
- Figure 37: Europe Natural Sweeteners Market Revenue Share (%), by Type 2024 & 2032
- Figure 38: Europe Natural Sweeteners Market Volume Share (%), by Type 2024 & 2032
- Figure 39: Europe Natural Sweeteners Market Revenue (Million), by Application 2024 & 2032
- Figure 40: Europe Natural Sweeteners Market Volume (K Tons), by Application 2024 & 2032
- Figure 41: Europe Natural Sweeteners Market Revenue Share (%), by Application 2024 & 2032
- Figure 42: Europe Natural Sweeteners Market Volume Share (%), by Application 2024 & 2032
- Figure 43: Europe Natural Sweeteners Market Revenue (Million), by Country 2024 & 2032
- Figure 44: Europe Natural Sweeteners Market Volume (K Tons), by Country 2024 & 2032
- Figure 45: Europe Natural Sweeteners Market Revenue Share (%), by Country 2024 & 2032
- Figure 46: Europe Natural Sweeteners Market Volume Share (%), by Country 2024 & 2032
- Figure 47: Asia Pacific Natural Sweeteners Market Revenue (Million), by Type 2024 & 2032
- Figure 48: Asia Pacific Natural Sweeteners Market Volume (K Tons), by Type 2024 & 2032
- Figure 49: Asia Pacific Natural Sweeteners Market Revenue Share (%), by Type 2024 & 2032
- Figure 50: Asia Pacific Natural Sweeteners Market Volume Share (%), by Type 2024 & 2032
- Figure 51: Asia Pacific Natural Sweeteners Market Revenue (Million), by Application 2024 & 2032
- Figure 52: Asia Pacific Natural Sweeteners Market Volume (K Tons), by Application 2024 & 2032
- Figure 53: Asia Pacific Natural Sweeteners Market Revenue Share (%), by Application 2024 & 2032
- Figure 54: Asia Pacific Natural Sweeteners Market Volume Share (%), by Application 2024 & 2032
- Figure 55: Asia Pacific Natural Sweeteners Market Revenue (Million), by Country 2024 & 2032
- Figure 56: Asia Pacific Natural Sweeteners Market Volume (K Tons), by Country 2024 & 2032
- Figure 57: Asia Pacific Natural Sweeteners Market Revenue Share (%), by Country 2024 & 2032
- Figure 58: Asia Pacific Natural Sweeteners Market Volume Share (%), by Country 2024 & 2032
- Figure 59: South America Natural Sweeteners Market Revenue (Million), by Type 2024 & 2032
- Figure 60: South America Natural Sweeteners Market Volume (K Tons), by Type 2024 & 2032
- Figure 61: South America Natural Sweeteners Market Revenue Share (%), by Type 2024 & 2032
- Figure 62: South America Natural Sweeteners Market Volume Share (%), by Type 2024 & 2032
- Figure 63: South America Natural Sweeteners Market Revenue (Million), by Application 2024 & 2032
- Figure 64: South America Natural Sweeteners Market Volume (K Tons), by Application 2024 & 2032
- Figure 65: South America Natural Sweeteners Market Revenue Share (%), by Application 2024 & 2032
- Figure 66: South America Natural Sweeteners Market Volume Share (%), by Application 2024 & 2032
- Figure 67: South America Natural Sweeteners Market Revenue (Million), by Country 2024 & 2032
- Figure 68: South America Natural Sweeteners Market Volume (K Tons), by Country 2024 & 2032
- Figure 69: South America Natural Sweeteners Market Revenue Share (%), by Country 2024 & 2032
- Figure 70: South America Natural Sweeteners Market Volume Share (%), by Country 2024 & 2032
- Figure 71: Middle East and Africa Natural Sweeteners Market Revenue (Million), by Type 2024 & 2032
- Figure 72: Middle East and Africa Natural Sweeteners Market Volume (K Tons), by Type 2024 & 2032
- Figure 73: Middle East and Africa Natural Sweeteners Market Revenue Share (%), by Type 2024 & 2032
- Figure 74: Middle East and Africa Natural Sweeteners Market Volume Share (%), by Type 2024 & 2032
- Figure 75: Middle East and Africa Natural Sweeteners Market Revenue (Million), by Application 2024 & 2032
- Figure 76: Middle East and Africa Natural Sweeteners Market Volume (K Tons), by Application 2024 & 2032
- Figure 77: Middle East and Africa Natural Sweeteners Market Revenue Share (%), by Application 2024 & 2032
- Figure 78: Middle East and Africa Natural Sweeteners Market Volume Share (%), by Application 2024 & 2032
- Figure 79: Middle East and Africa Natural Sweeteners Market Revenue (Million), by Country 2024 & 2032
- Figure 80: Middle East and Africa Natural Sweeteners Market Volume (K Tons), by Country 2024 & 2032
- Figure 81: Middle East and Africa Natural Sweeteners Market Revenue Share (%), by Country 2024 & 2032
- Figure 82: Middle East and Africa Natural Sweeteners Market Volume Share (%), by Country 2024 & 2032
List of Tables
- Table 1: Global Natural Sweeteners Market Revenue Million Forecast, by Region 2019 & 2032
- Table 2: Global Natural Sweeteners Market Volume K Tons Forecast, by Region 2019 & 2032
- Table 3: Global Natural Sweeteners Market Revenue Million Forecast, by Type 2019 & 2032
- Table 4: Global Natural Sweeteners Market Volume K Tons Forecast, by Type 2019 & 2032
- Table 5: Global Natural Sweeteners Market Revenue Million Forecast, by Application 2019 & 2032
- Table 6: Global Natural Sweeteners Market Volume K Tons Forecast, by Application 2019 & 2032
- Table 7: Global Natural Sweeteners Market Revenue Million Forecast, by Region 2019 & 2032
- Table 8: Global Natural Sweeteners Market Volume K Tons Forecast, by Region 2019 & 2032
- Table 9: Global Natural Sweeteners Market Revenue Million Forecast, by Country 2019 & 2032
- Table 10: Global Natural Sweeteners Market Volume K Tons Forecast, by Country 2019 & 2032
- Table 11: United States Natural Sweeteners Market Revenue (Million) Forecast, by Application 2019 & 2032
- Table 12: United States Natural Sweeteners Market Volume (K Tons) Forecast, by Application 2019 & 2032
- Table 13: Canada Natural Sweeteners Market Revenue (Million) Forecast, by Application 2019 & 2032
- Table 14: Canada Natural Sweeteners Market Volume (K Tons) Forecast, by Application 2019 & 2032
- Table 15: Mexico Natural Sweeteners Market Revenue (Million) Forecast, by Application 2019 & 2032
- Table 16: Mexico Natural Sweeteners Market Volume (K Tons) Forecast, by Application 2019 & 2032
- Table 17: Rest of North America Natural Sweeteners Market Revenue (Million) Forecast, by Application 2019 & 2032
- Table 18: Rest of North America Natural Sweeteners Market Volume (K Tons) Forecast, by Application 2019 & 2032
- Table 19: Global Natural Sweeteners Market Revenue Million Forecast, by Country 2019 & 2032
- Table 20: Global Natural Sweeteners Market Volume K Tons Forecast, by Country 2019 & 2032
- Table 21: Spain Natural Sweeteners Market Revenue (Million) Forecast, by Application 2019 & 2032
- Table 22: Spain Natural Sweeteners Market Volume (K Tons) Forecast, by Application 2019 & 2032
- Table 23: United Kingdom Natural Sweeteners Market Revenue (Million) Forecast, by Application 2019 & 2032
- Table 24: United Kingdom Natural Sweeteners Market Volume (K Tons) Forecast, by Application 2019 & 2032
- Table 25: France Natural Sweeteners Market Revenue (Million) Forecast, by Application 2019 & 2032
- Table 26: France Natural Sweeteners Market Volume (K Tons) Forecast, by Application 2019 & 2032
- Table 27: Germany Natural Sweeteners Market Revenue (Million) Forecast, by Application 2019 & 2032
- Table 28: Germany Natural Sweeteners Market Volume (K Tons) Forecast, by Application 2019 & 2032
- Table 29: Italy Natural Sweeteners Market Revenue (Million) Forecast, by Application 2019 & 2032
- Table 30: Italy Natural Sweeteners Market Volume (K Tons) Forecast, by Application 2019 & 2032
- Table 31: Rest of Europe Natural Sweeteners Market Revenue (Million) Forecast, by Application 2019 & 2032
- Table 32: Rest of Europe Natural Sweeteners Market Volume (K Tons) Forecast, by Application 2019 & 2032
- Table 33: Global Natural Sweeteners Market Revenue Million Forecast, by Country 2019 & 2032
- Table 34: Global Natural Sweeteners Market Volume K Tons Forecast, by Country 2019 & 2032
- Table 35: China Natural Sweeteners Market Revenue (Million) Forecast, by Application 2019 & 2032
- Table 36: China Natural Sweeteners Market Volume (K Tons) Forecast, by Application 2019 & 2032
- Table 37: Japan Natural Sweeteners Market Revenue (Million) Forecast, by Application 2019 & 2032
- Table 38: Japan Natural Sweeteners Market Volume (K Tons) Forecast, by Application 2019 & 2032
- Table 39: India Natural Sweeteners Market Revenue (Million) Forecast, by Application 2019 & 2032
- Table 40: India Natural Sweeteners Market Volume (K Tons) Forecast, by Application 2019 & 2032
- Table 41: Australia Natural Sweeteners Market Revenue (Million) Forecast, by Application 2019 & 2032
- Table 42: Australia Natural Sweeteners Market Volume (K Tons) Forecast, by Application 2019 & 2032
- Table 43: Rest of Asia Pacific Natural Sweeteners Market Revenue (Million) Forecast, by Application 2019 & 2032
- Table 44: Rest of Asia Pacific Natural Sweeteners Market Volume (K Tons) Forecast, by Application 2019 & 2032
- Table 45: Global Natural Sweeteners Market Revenue Million Forecast, by Country 2019 & 2032
- Table 46: Global Natural Sweeteners Market Volume K Tons Forecast, by Country 2019 & 2032
- Table 47: Brazil Natural Sweeteners Market Revenue (Million) Forecast, by Application 2019 & 2032
- Table 48: Brazil Natural Sweeteners Market Volume (K Tons) Forecast, by Application 2019 & 2032
- Table 49: Argentina Natural Sweeteners Market Revenue (Million) Forecast, by Application 2019 & 2032
- Table 50: Argentina Natural Sweeteners Market Volume (K Tons) Forecast, by Application 2019 & 2032
- Table 51: Rest of South America Natural Sweeteners Market Revenue (Million) Forecast, by Application 2019 & 2032
- Table 52: Rest of South America Natural Sweeteners Market Volume (K Tons) Forecast, by Application 2019 & 2032
- Table 53: Global Natural Sweeteners Market Revenue Million Forecast, by Country 2019 & 2032
- Table 54: Global Natural Sweeteners Market Volume K Tons Forecast, by Country 2019 & 2032
- Table 55: South Africa Natural Sweeteners Market Revenue (Million) Forecast, by Application 2019 & 2032
- Table 56: South Africa Natural Sweeteners Market Volume (K Tons) Forecast, by Application 2019 & 2032
- Table 57: Saudi Arabia Natural Sweeteners Market Revenue (Million) Forecast, by Application 2019 & 2032
- Table 58: Saudi Arabia Natural Sweeteners Market Volume (K Tons) Forecast, by Application 2019 & 2032
- Table 59: Rest of Middle East and Africa Natural Sweeteners Market Revenue (Million) Forecast, by Application 2019 & 2032
- Table 60: Rest of Middle East and Africa Natural Sweeteners Market Volume (K Tons) Forecast, by Application 2019 & 2032
- Table 61: Global Natural Sweeteners Market Revenue Million Forecast, by Type 2019 & 2032
- Table 62: Global Natural Sweeteners Market Volume K Tons Forecast, by Type 2019 & 2032
- Table 63: Global Natural Sweeteners Market Revenue Million Forecast, by Application 2019 & 2032
- Table 64: Global Natural Sweeteners Market Volume K Tons Forecast, by Application 2019 & 2032
- Table 65: Global Natural Sweeteners Market Revenue Million Forecast, by Country 2019 & 2032
- Table 66: Global Natural Sweeteners Market Volume K Tons Forecast, by Country 2019 & 2032
- Table 67: United States Natural Sweeteners Market Revenue (Million) Forecast, by Application 2019 & 2032
- Table 68: United States Natural Sweeteners Market Volume (K Tons) Forecast, by Application 2019 & 2032
- Table 69: Canada Natural Sweeteners Market Revenue (Million) Forecast, by Application 2019 & 2032
- Table 70: Canada Natural Sweeteners Market Volume (K Tons) Forecast, by Application 2019 & 2032
- Table 71: Mexico Natural Sweeteners Market Revenue (Million) Forecast, by Application 2019 & 2032
- Table 72: Mexico Natural Sweeteners Market Volume (K Tons) Forecast, by Application 2019 & 2032
- Table 73: Rest of North America Natural Sweeteners Market Revenue (Million) Forecast, by Application 2019 & 2032
- Table 74: Rest of North America Natural Sweeteners Market Volume (K Tons) Forecast, by Application 2019 & 2032
- Table 75: Global Natural Sweeteners Market Revenue Million Forecast, by Type 2019 & 2032
- Table 76: Global Natural Sweeteners Market Volume K Tons Forecast, by Type 2019 & 2032
- Table 77: Global Natural Sweeteners Market Revenue Million Forecast, by Application 2019 & 2032
- Table 78: Global Natural Sweeteners Market Volume K Tons Forecast, by Application 2019 & 2032
- Table 79: Global Natural Sweeteners Market Revenue Million Forecast, by Country 2019 & 2032
- Table 80: Global Natural Sweeteners Market Volume K Tons Forecast, by Country 2019 & 2032
- Table 81: Spain Natural Sweeteners Market Revenue (Million) Forecast, by Application 2019 & 2032
- Table 82: Spain Natural Sweeteners Market Volume (K Tons) Forecast, by Application 2019 & 2032
- Table 83: United Kingdom Natural Sweeteners Market Revenue (Million) Forecast, by Application 2019 & 2032
- Table 84: United Kingdom Natural Sweeteners Market Volume (K Tons) Forecast, by Application 2019 & 2032
- Table 85: France Natural Sweeteners Market Revenue (Million) Forecast, by Application 2019 & 2032
- Table 86: France Natural Sweeteners Market Volume (K Tons) Forecast, by Application 2019 & 2032
- Table 87: Germany Natural Sweeteners Market Revenue (Million) Forecast, by Application 2019 & 2032
- Table 88: Germany Natural Sweeteners Market Volume (K Tons) Forecast, by Application 2019 & 2032
- Table 89: Italy Natural Sweeteners Market Revenue (Million) Forecast, by Application 2019 & 2032
- Table 90: Italy Natural Sweeteners Market Volume (K Tons) Forecast, by Application 2019 & 2032
- Table 91: Rest of Europe Natural Sweeteners Market Revenue (Million) Forecast, by Application 2019 & 2032
- Table 92: Rest of Europe Natural Sweeteners Market Volume (K Tons) Forecast, by Application 2019 & 2032
- Table 93: Global Natural Sweeteners Market Revenue Million Forecast, by Type 2019 & 2032
- Table 94: Global Natural Sweeteners Market Volume K Tons Forecast, by Type 2019 & 2032
- Table 95: Global Natural Sweeteners Market Revenue Million Forecast, by Application 2019 & 2032
- Table 96: Global Natural Sweeteners Market Volume K Tons Forecast, by Application 2019 & 2032
- Table 97: Global Natural Sweeteners Market Revenue Million Forecast, by Country 2019 & 2032
- Table 98: Global Natural Sweeteners Market Volume K Tons Forecast, by Country 2019 & 2032
- Table 99: China Natural Sweeteners Market Revenue (Million) Forecast, by Application 2019 & 2032
- Table 100: China Natural Sweeteners Market Volume (K Tons) Forecast, by Application 2019 & 2032
- Table 101: Japan Natural Sweeteners Market Revenue (Million) Forecast, by Application 2019 & 2032
- Table 102: Japan Natural Sweeteners Market Volume (K Tons) Forecast, by Application 2019 & 2032
- Table 103: India Natural Sweeteners Market Revenue (Million) Forecast, by Application 2019 & 2032
- Table 104: India Natural Sweeteners Market Volume (K Tons) Forecast, by Application 2019 & 2032
- Table 105: Australia Natural Sweeteners Market Revenue (Million) Forecast, by Application 2019 & 2032
- Table 106: Australia Natural Sweeteners Market Volume (K Tons) Forecast, by Application 2019 & 2032
- Table 107: Rest of Asia Pacific Natural Sweeteners Market Revenue (Million) Forecast, by Application 2019 & 2032
- Table 108: Rest of Asia Pacific Natural Sweeteners Market Volume (K Tons) Forecast, by Application 2019 & 2032
- Table 109: Global Natural Sweeteners Market Revenue Million Forecast, by Type 2019 & 2032
- Table 110: Global Natural Sweeteners Market Volume K Tons Forecast, by Type 2019 & 2032
- Table 111: Global Natural Sweeteners Market Revenue Million Forecast, by Application 2019 & 2032
- Table 112: Global Natural Sweeteners Market Volume K Tons Forecast, by Application 2019 & 2032
- Table 113: Global Natural Sweeteners Market Revenue Million Forecast, by Country 2019 & 2032
- Table 114: Global Natural Sweeteners Market Volume K Tons Forecast, by Country 2019 & 2032
- Table 115: Brazil Natural Sweeteners Market Revenue (Million) Forecast, by Application 2019 & 2032
- Table 116: Brazil Natural Sweeteners Market Volume (K Tons) Forecast, by Application 2019 & 2032
- Table 117: Argentina Natural Sweeteners Market Revenue (Million) Forecast, by Application 2019 & 2032
- Table 118: Argentina Natural Sweeteners Market Volume (K Tons) Forecast, by Application 2019 & 2032
- Table 119: Rest of South America Natural Sweeteners Market Revenue (Million) Forecast, by Application 2019 & 2032
- Table 120: Rest of South America Natural Sweeteners Market Volume (K Tons) Forecast, by Application 2019 & 2032
- Table 121: Global Natural Sweeteners Market Revenue Million Forecast, by Type 2019 & 2032
- Table 122: Global Natural Sweeteners Market Volume K Tons Forecast, by Type 2019 & 2032
- Table 123: Global Natural Sweeteners Market Revenue Million Forecast, by Application 2019 & 2032
- Table 124: Global Natural Sweeteners Market Volume K Tons Forecast, by Application 2019 & 2032
- Table 125: Global Natural Sweeteners Market Revenue Million Forecast, by Country 2019 & 2032
- Table 126: Global Natural Sweeteners Market Volume K Tons Forecast, by Country 2019 & 2032
- Table 127: South Africa Natural Sweeteners Market Revenue (Million) Forecast, by Application 2019 & 2032
- Table 128: South Africa Natural Sweeteners Market Volume (K Tons) Forecast, by Application 2019 & 2032
- Table 129: Saudi Arabia Natural Sweeteners Market Revenue (Million) Forecast, by Application 2019 & 2032
- Table 130: Saudi Arabia Natural Sweeteners Market Volume (K Tons) Forecast, by Application 2019 & 2032
- Table 131: Rest of Middle East and Africa Natural Sweeteners Market Revenue (Million) Forecast, by Application 2019 & 2032
- Table 132: Rest of Middle East and Africa Natural Sweeteners Market Volume (K Tons) Forecast, by Application 2019 & 2032
Frequently Asked Questions
1. What is the projected Compound Annual Growth Rate (CAGR) of the Natural Sweeteners Market?
The projected CAGR is approximately 7.20%.
2. Which companies are prominent players in the Natural Sweeteners Market?
Key companies in the market include Archer Danials Midland Company, Cargill Incorporated, Du Pont De Nemours and Company, Sweegen Inc, Sweetly Stevia USA, Saraya Co Ltd (Lakanto), Associated British Foods PLC, Ingredion Incorporated, Roquette Freres, Firmenich S, Tate & Lyle, Sunwin Stevia International.
3. What are the main segments of the Natural Sweeteners Market?
The market segments include Type, Application.
4. Can you provide details about the market size?
The market size is estimated to be USD 24480 Million as of 2022.
5. What are some drivers contributing to market growth?
Rising Incidence of Obesity and Cadiovascular Diseases; Growing Trend of Veganism Drives the Market.
6. What are the notable trends driving market growth?
Increasing Health Consciousness Among Consumers to Boost Natural Sweeteners.
7. Are there any restraints impacting market growth?
Associated Allergies With Plant Proteins.
8. Can you provide examples of recent developments in the market?
November 2022: Tate & Lyle Plc launched a new natural sweetener, "Erytesse" Erythritol. The new sweetener contains 70% sweetness of sucrose and has zero calories. Erytesse can be used in beverages, dairy, bakery, and confectionery.
9. What pricing options are available for accessing the report?
Pricing options include single-user, multi-user, and enterprise licenses priced at USD 4750, USD 5250, and USD 8750 respectively.
10. Is the market size provided in terms of value or volume?
The market size is provided in terms of value, measured in Million and volume, measured in K Tons.
11. Are there any specific market keywords associated with the report?
Yes, the market keyword associated with the report is "Natural Sweeteners Market," which aids in identifying and referencing the specific market segment covered.
12. How do I determine which pricing option suits my needs best?
The pricing options vary based on user requirements and access needs. Individual users may opt for single-user licenses, while businesses requiring broader access may choose multi-user or enterprise licenses for cost-effective access to the report.
13. Are there any additional resources or data provided in the Natural Sweeteners Market report?
While the report offers comprehensive insights, it's advisable to review the specific contents or supplementary materials provided to ascertain if additional resources or data are available.
14. How can I stay updated on further developments or reports in the Natural Sweeteners Market?
To stay informed about further developments, trends, and reports in the Natural Sweeteners Market, consider subscribing to industry newsletters, following relevant companies and organizations, or regularly checking reputable industry news sources and publications.
Methodology
Step 1 - Identification of Relevant Samples Size from Population Database


Step 2 - Approaches for Defining Global Market Size (Value, Volume* & Price*)

Note*: In applicable scenarios
Step 3 - Data Sources
Primary Research
- Web Analytics
- Survey Reports
- Research Institute
- Latest Research Reports
- Opinion Leaders
Secondary Research
- Annual Reports
- White Paper
- Latest Press Release
- Industry Association
- Paid Database
- Investor Presentations

Step 4 - Data Triangulation
Involves using different sources of information in order to increase the validity of a study
These sources are likely to be stakeholders in a program - participants, other researchers, program staff, other community members, and so on.
Then we put all data in single framework & apply various statistical tools to find out the dynamic on the market.
During the analysis stage, feedback from the stakeholder groups would be compared to determine areas of agreement as well as areas of divergence


