
Key Insights
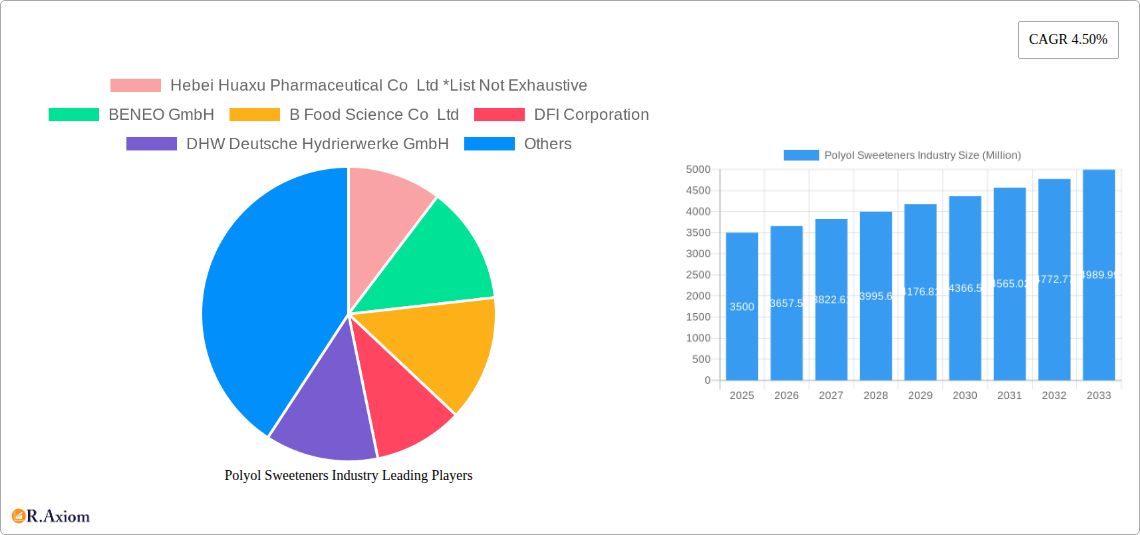
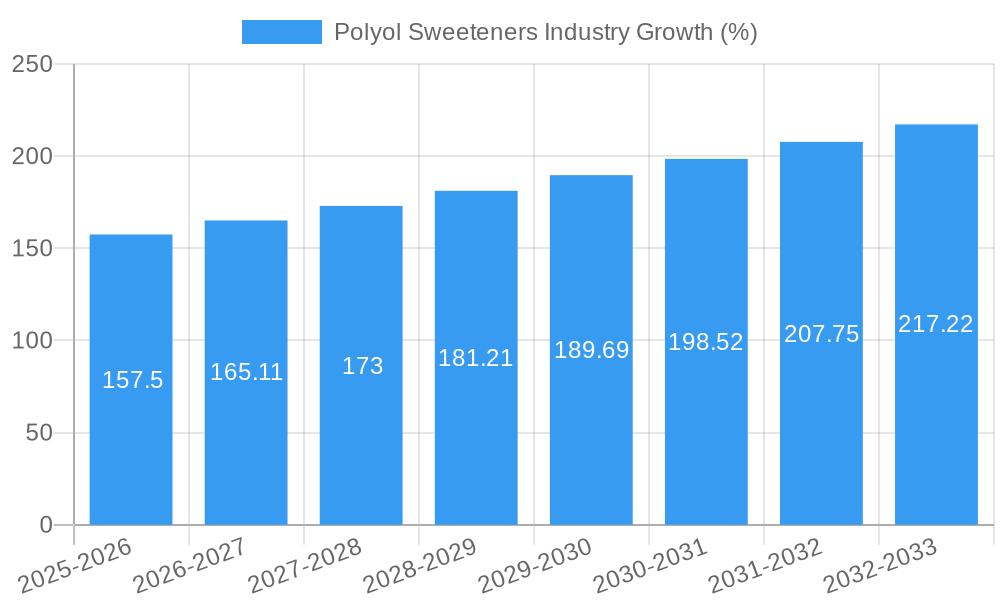
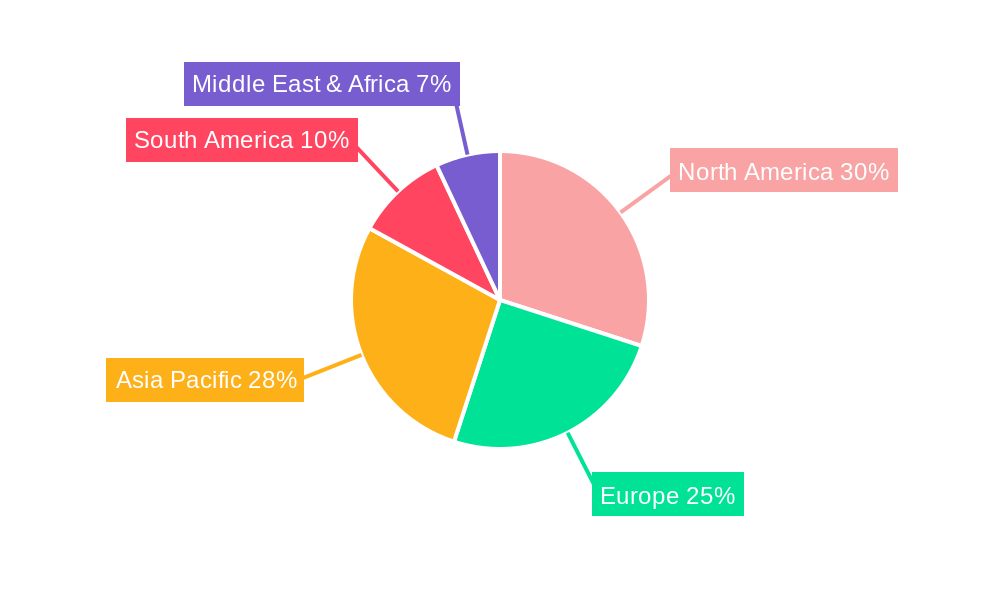
The global polyol sweeteners market, currently valued at approximately $3.5 billion (2025), is projected to experience robust growth, driven by a compound annual growth rate (CAGR) of 4.5% from 2025 to 2033. This expansion is fueled by several key factors. The increasing prevalence of diabetes and related health concerns is boosting demand for low-calorie sweeteners, with polyols offering a viable alternative to sugar. Furthermore, the growing popularity of functional foods and beverages, coupled with consumer preference for natural and clean-label ingredients, is significantly contributing to market growth. The food and beverage sector remains the dominant application segment, with substantial contributions also anticipated from pharmaceuticals and personal care products, driven by the use of polyols as excipients and humectants, respectively. Market segmentation by type reveals erythritol, sorbitol, and maltitol as major contributors, reflecting their widespread acceptance and versatility in various applications. Geographic growth is expected to be broadly distributed, with North America and Europe holding significant market share currently, while the Asia-Pacific region shows promising growth potential driven by rising disposable incomes and changing dietary habits. However, potential restraints such as the aftertaste associated with certain polyols and the higher production costs compared to some traditional sweeteners need to be considered.
Competition in the polyol sweeteners market is intense, with established players like Cargill, Ingredion, and Roquette Frères competing alongside regional manufacturers. The market is characterized by ongoing innovation in production techniques and product development, focusing on improving taste profiles and enhancing functionality. Companies are also investing in research and development to explore new applications and address consumer concerns regarding potential digestive side effects associated with high polyol consumption. The strategic partnerships and mergers & acquisitions will be key determinants of the market landscape in the coming years. The continued focus on sustainability and eco-friendly production processes will also shape the future of the polyol sweeteners industry. This includes exploring sustainable sourcing of raw materials and reducing the environmental impact of manufacturing processes.
This in-depth report provides a comprehensive analysis of the global polyol sweeteners market, covering market size, segmentation, growth drivers, challenges, and key players. The study period spans from 2019 to 2033, with 2025 serving as the base and estimated year. The forecast period extends from 2025 to 2033, while the historical period encompasses 2019-2024. This report is crucial for industry stakeholders, investors, and businesses seeking to understand and capitalize on the opportunities within this dynamic market.
Polyol Sweeteners Industry Market Concentration & Innovation
The global polyol sweeteners market exhibits a moderately concentrated structure, with several major players holding significant market share. Companies like Cargill Inc, Ingredion Incorporated, Archer Daniels Midland Company, and Roquette Frères dominate the landscape, collectively accounting for an estimated xx% of the market in 2025. However, the market also features numerous smaller players, particularly in regional markets.
Innovation within the industry focuses on developing healthier, more functional polyols with improved taste and texture profiles. This includes the creation of novel polyol blends and the exploration of sustainable sourcing and production methods. Regulatory frameworks, including labeling requirements and food safety standards, significantly influence product development and market access. The presence of sugar substitutes like stevia and other high-intensity sweeteners creates competitive pressure, forcing polyol producers to continually innovate.
Mergers and acquisitions (M&A) activity within the sector has been relatively modest in recent years, with deal values totaling an estimated xx Million in the past five years. However, strategic partnerships and collaborations are increasingly common, reflecting the need for companies to expand their product portfolios and access new technologies. End-user trends, particularly the growing demand for healthier food and beverage options and functional ingredients for pharmaceuticals and personal care, continue to drive innovation within the polyol sweeteners market.
Polyol Sweeteners Industry Industry Trends & Insights
The global polyol sweeteners market is projected to experience robust growth during the forecast period (2025-2033), with a Compound Annual Growth Rate (CAGR) of xx%. This growth is primarily driven by the increasing prevalence of health-conscious consumers seeking low-calorie and sugar-free alternatives. The rising prevalence of diabetes and other metabolic disorders further fuels demand for polyol sweeteners in food and beverage products. Technological advancements in polyol production, including improvements in efficiency and sustainability, are also contributing to market expansion.
Consumer preferences for natural and sustainably sourced ingredients are significantly impacting market dynamics, pushing producers to adopt eco-friendly production methods and transparent labeling practices. The competitive landscape remains intensely competitive, with major players investing heavily in research and development, capacity expansion, and strategic acquisitions to maintain and enhance their market positions. Market penetration of polyol sweeteners in various applications continues to grow, with notable expansion in the food and beverage, pharmaceutical, and personal care sectors.
Dominant Markets & Segments in Polyol Sweeteners Industry
The global polyol sweeteners market shows significant regional variations in growth and consumption patterns. Currently, xx is the leading region, driven primarily by high population density, increased disposable income, and rising health consciousness among consumers. Within the various segments:
- By Type: Sorbitol remains the dominant polyol type, accounting for the largest market share in 2025 due to its wide range of applications and cost-effectiveness. However, Erythritol is experiencing faster growth due to its superior taste profile and minimal caloric content. Other types of polyols also present notable opportunities.
- By Application: The food and beverage industry accounts for the largest share of polyol sweetener consumption, followed by the pharmaceutical and personal care sectors. The increasing popularity of sugar-free and low-calorie products across various food and beverage categories strongly fuels this segment's growth. The use of polyols as pharmaceutical excipients and in personal care products is also steadily rising, driven by functional benefits and consumer preference.
Key drivers for regional dominance include supportive economic policies promoting the growth of the food processing industry, well-established distribution networks, and robust infrastructure supporting efficient supply chain logistics.
Polyol Sweeteners Industry Product Developments
Recent years have witnessed significant advancements in polyol sweetener technology, focusing on enhancing product functionality and addressing consumer preferences. Companies are actively developing novel blends and formulations with improved taste profiles, reduced aftertaste, and better solubility characteristics. These developments are addressing several consumer needs and improving the overall market fit of polyol sweeteners as a healthier alternative to traditional sugars. The focus on natural and sustainable sourcing is a crucial aspect of product development, aligning with broader industry trends toward eco-friendly practices. Technological advancements are primarily in the area of production optimization and sustainability improvements, including process efficiency and waste reduction.
Report Scope & Segmentation Analysis
This report segments the polyol sweeteners market by type (Erythritol, Sorbitol, Maltitol, Isomalt, Other Types) and application (Food and Beverages, Pharmaceuticals, Personal Care). Each segment's analysis includes market size estimates, growth projections for the forecast period (2025-2033), and a detailed competitive landscape analysis. For instance, the food and beverages segment is projected to witness significant growth, propelled by the increasing demand for low-calorie and sugar-free products. Similarly, the Erythritol segment is anticipated to exhibit robust growth, driven by its increasing popularity as a healthier sugar substitute. Competitive dynamics vary among segments; some segments show a high degree of concentration while others are more fragmented.
Key Drivers of Polyol Sweeteners Industry Growth
Several factors contribute to the growth of the polyol sweeteners market:
- Rising health consciousness: Consumers increasingly seek healthier alternatives to traditional sugars.
- Growing prevalence of diabetes and obesity: This drives demand for low-calorie sweeteners.
- Technological advancements: Improvements in production methods enhance efficiency and sustainability.
- Favorable regulatory environment: Supportive policies in some regions promote market expansion.
- Increased demand for functional foods: This expands the applications of polyol sweeteners in various products.
Challenges in the Polyol Sweeteners Industry Sector
The polyol sweeteners market faces certain challenges:
- High production costs: Compared to some other sweeteners, this can limit market penetration.
- Potential digestive issues: Some polyols can cause gastrointestinal discomfort at high intakes, which limits consumer acceptance.
- Intense competition: From both other sweeteners and from emerging alternatives.
- Fluctuations in raw material prices: This impacts production costs and profitability.
- Stringent regulatory approvals: These requirements increase costs and timelines for product launches.
Emerging Opportunities in Polyol Sweeteners Industry
Significant opportunities exist within the polyol sweeteners industry:
- Development of novel polyol blends: Creating customized blends with enhanced functionalities.
- Expansion into emerging markets: Targeting regions with growing health-conscious populations.
- Focus on sustainability: Adopting environmentally friendly production practices.
- Strategic partnerships and collaborations: Leveraging synergies to expand market reach.
- Exploration of new applications: Discovering new uses in the food, pharmaceutical, and personal care sectors.
Leading Players in the Polyol Sweeteners Industry Market
- Hebei Huaxu Pharmaceutical Co Ltd
- BENEO GmbH
- B Food Science Co Ltd
- DFI Corporation
- DHW Deutsche Hydrierwerke GmbH
- Dupont Nutrition & Health (Danisco)
- Archer Daniels Midland Company
- Roquette Frères
- Cargill Inc
- Ingredion Incorporated
Key Developments in Polyol Sweeteners Industry Industry
- March 2023: Archer Daniels Midland Company launched the Knwble Grwn brand, focusing on sustainable, plant-based food ingredients. This strengthens their position in the market by catering to growing consumer demand for sustainability.
- March 2022: Roquette invested EURO 25 million (USD 27.6 million) in liquid and powder sugar polyol production capacity. This expansion enhances their production capabilities and strengthens their market position.
Strategic Outlook for Polyol Sweeteners Industry Market
The polyol sweeteners market is poised for continued growth, driven by strong consumer demand for healthier alternatives to sugar. Innovation in product development, focusing on improved taste, texture, and functionality, will be crucial for market success. Companies focusing on sustainability and responsible sourcing will gain a competitive advantage. Expansion into emerging markets and strategic partnerships will further accelerate growth and enhance market penetration. The overall outlook remains positive, with significant opportunities for growth and profitability in the coming years.
Polyol Sweeteners Industry Segmentation
-
1. Type
- 1.1. Erythritol
- 1.2. Sorbitol
- 1.3. Maltitol
- 1.4. Isomalt
- 1.5. Other Types
-
2. Application
- 2.1. Food and Beverages
- 2.2. Pharmaceuticals
- 2.3. Personal Care
Polyol Sweeteners Industry Segmentation By Geography
-
1. North America
- 1.1. United States
- 1.2. Canada
- 1.3. Mexico
- 1.4. Rest of North America
-
2. Europe
- 2.1. United Kingdom
- 2.2. Germany
- 2.3. France
- 2.4. Russia
- 2.5. Italy
- 2.6. Spain
- 2.7. Rest of Europe
-
3. Asia Pacific
- 3.1. India
- 3.2. China
- 3.3. Japan
- 3.4. Australia
- 3.5. Rest of Asia Pacific
-
4. South America
- 4.1. Brazil
- 4.2. Argentina
- 4.3. Rest of South America
- 5. Middle East
-
6. South Africa
- 6.1. Saudi Arabia
- 6.2. Rest of MEA
Polyol Sweeteners Industry REPORT HIGHLIGHTS
| Aspects | Details |
|---|---|
| Study Period | 2019-2033 |
| Base Year | 2024 |
| Estimated Year | 2025 |
| Forecast Period | 2025-2033 |
| Historical Period | 2019-2024 |
| Growth Rate | CAGR of 4.50% from 2019-2033 |
| Segmentation |
|
Table of Contents
- 1. Introduction
- 1.1. Research Scope
- 1.2. Market Segmentation
- 1.3. Research Methodology
- 1.4. Definitions and Assumptions
- 2. Executive Summary
- 2.1. Introduction
- 3. Market Dynamics
- 3.1. Introduction
- 3.2. Market Drivers
- 3.2.1. Increasing Demand for Organic Plant Proteins; Increasing Application of Pea Protein in Food and Beverages
- 3.3. Market Restrains
- 3.3.1. Presence of Alternative protein sources
- 3.4. Market Trends
- 3.4.1. Rising Preference Towards Low-Calorie Sweetener
- 4. Market Factor Analysis
- 4.1. Porters Five Forces
- 4.2. Supply/Value Chain
- 4.3. PESTEL analysis
- 4.4. Market Entropy
- 4.5. Patent/Trademark Analysis
- 5. Global Polyol Sweeteners Industry Analysis, Insights and Forecast, 2019-2031
- 5.1. Market Analysis, Insights and Forecast - by Type
- 5.1.1. Erythritol
- 5.1.2. Sorbitol
- 5.1.3. Maltitol
- 5.1.4. Isomalt
- 5.1.5. Other Types
- 5.2. Market Analysis, Insights and Forecast - by Application
- 5.2.1. Food and Beverages
- 5.2.2. Pharmaceuticals
- 5.2.3. Personal Care
- 5.3. Market Analysis, Insights and Forecast - by Region
- 5.3.1. North America
- 5.3.2. Europe
- 5.3.3. Asia Pacific
- 5.3.4. South America
- 5.3.5. Middle East
- 5.3.6. South Africa
- 5.1. Market Analysis, Insights and Forecast - by Type
- 6. North America Polyol Sweeteners Industry Analysis, Insights and Forecast, 2019-2031
- 6.1. Market Analysis, Insights and Forecast - by Type
- 6.1.1. Erythritol
- 6.1.2. Sorbitol
- 6.1.3. Maltitol
- 6.1.4. Isomalt
- 6.1.5. Other Types
- 6.2. Market Analysis, Insights and Forecast - by Application
- 6.2.1. Food and Beverages
- 6.2.2. Pharmaceuticals
- 6.2.3. Personal Care
- 6.1. Market Analysis, Insights and Forecast - by Type
- 7. Europe Polyol Sweeteners Industry Analysis, Insights and Forecast, 2019-2031
- 7.1. Market Analysis, Insights and Forecast - by Type
- 7.1.1. Erythritol
- 7.1.2. Sorbitol
- 7.1.3. Maltitol
- 7.1.4. Isomalt
- 7.1.5. Other Types
- 7.2. Market Analysis, Insights and Forecast - by Application
- 7.2.1. Food and Beverages
- 7.2.2. Pharmaceuticals
- 7.2.3. Personal Care
- 7.1. Market Analysis, Insights and Forecast - by Type
- 8. Asia Pacific Polyol Sweeteners Industry Analysis, Insights and Forecast, 2019-2031
- 8.1. Market Analysis, Insights and Forecast - by Type
- 8.1.1. Erythritol
- 8.1.2. Sorbitol
- 8.1.3. Maltitol
- 8.1.4. Isomalt
- 8.1.5. Other Types
- 8.2. Market Analysis, Insights and Forecast - by Application
- 8.2.1. Food and Beverages
- 8.2.2. Pharmaceuticals
- 8.2.3. Personal Care
- 8.1. Market Analysis, Insights and Forecast - by Type
- 9. South America Polyol Sweeteners Industry Analysis, Insights and Forecast, 2019-2031
- 9.1. Market Analysis, Insights and Forecast - by Type
- 9.1.1. Erythritol
- 9.1.2. Sorbitol
- 9.1.3. Maltitol
- 9.1.4. Isomalt
- 9.1.5. Other Types
- 9.2. Market Analysis, Insights and Forecast - by Application
- 9.2.1. Food and Beverages
- 9.2.2. Pharmaceuticals
- 9.2.3. Personal Care
- 9.1. Market Analysis, Insights and Forecast - by Type
- 10. Middle East Polyol Sweeteners Industry Analysis, Insights and Forecast, 2019-2031
- 10.1. Market Analysis, Insights and Forecast - by Type
- 10.1.1. Erythritol
- 10.1.2. Sorbitol
- 10.1.3. Maltitol
- 10.1.4. Isomalt
- 10.1.5. Other Types
- 10.2. Market Analysis, Insights and Forecast - by Application
- 10.2.1. Food and Beverages
- 10.2.2. Pharmaceuticals
- 10.2.3. Personal Care
- 10.1. Market Analysis, Insights and Forecast - by Type
- 11. South Africa Polyol Sweeteners Industry Analysis, Insights and Forecast, 2019-2031
- 11.1. Market Analysis, Insights and Forecast - by Type
- 11.1.1. Erythritol
- 11.1.2. Sorbitol
- 11.1.3. Maltitol
- 11.1.4. Isomalt
- 11.1.5. Other Types
- 11.2. Market Analysis, Insights and Forecast - by Application
- 11.2.1. Food and Beverages
- 11.2.2. Pharmaceuticals
- 11.2.3. Personal Care
- 11.1. Market Analysis, Insights and Forecast - by Type
- 12. North America Polyol Sweeteners Industry Analysis, Insights and Forecast, 2019-2031
- 12.1. Market Analysis, Insights and Forecast - By Country/Sub-region
- 12.1.1 United States
- 12.1.2 Canada
- 12.1.3 Mexico
- 12.1.4 Rest of North America
- 13. Europe Polyol Sweeteners Industry Analysis, Insights and Forecast, 2019-2031
- 13.1. Market Analysis, Insights and Forecast - By Country/Sub-region
- 13.1.1 United Kingdom
- 13.1.2 Germany
- 13.1.3 France
- 13.1.4 Russia
- 13.1.5 Italy
- 13.1.6 Spain
- 13.1.7 Rest of Europe
- 14. Asia Pacific Polyol Sweeteners Industry Analysis, Insights and Forecast, 2019-2031
- 14.1. Market Analysis, Insights and Forecast - By Country/Sub-region
- 14.1.1 India
- 14.1.2 China
- 14.1.3 Japan
- 14.1.4 Australia
- 14.1.5 Rest of Asia Pacific
- 15. South America Polyol Sweeteners Industry Analysis, Insights and Forecast, 2019-2031
- 15.1. Market Analysis, Insights and Forecast - By Country/Sub-region
- 15.1.1 Brazil
- 15.1.2 Argentina
- 15.1.3 Rest of South America
- 16. Middle East Polyol Sweeteners Industry Analysis, Insights and Forecast, 2019-2031
- 16.1. Market Analysis, Insights and Forecast - By Country/Sub-region
- 16.1.1.
- 17. South Africa Polyol Sweeteners Industry Analysis, Insights and Forecast, 2019-2031
- 17.1. Market Analysis, Insights and Forecast - By Country/Sub-region
- 17.1.1 Saudi Arabia
- 17.1.2 Rest of MEA
- 18. Competitive Analysis
- 18.1. Global Market Share Analysis 2024
- 18.2. Company Profiles
- 18.2.1 Hebei Huaxu Pharmaceutical Co Ltd *List Not Exhaustive
- 18.2.1.1. Overview
- 18.2.1.2. Products
- 18.2.1.3. SWOT Analysis
- 18.2.1.4. Recent Developments
- 18.2.1.5. Financials (Based on Availability)
- 18.2.2 BENEO GmbH
- 18.2.2.1. Overview
- 18.2.2.2. Products
- 18.2.2.3. SWOT Analysis
- 18.2.2.4. Recent Developments
- 18.2.2.5. Financials (Based on Availability)
- 18.2.3 B Food Science Co Ltd
- 18.2.3.1. Overview
- 18.2.3.2. Products
- 18.2.3.3. SWOT Analysis
- 18.2.3.4. Recent Developments
- 18.2.3.5. Financials (Based on Availability)
- 18.2.4 DFI Corporation
- 18.2.4.1. Overview
- 18.2.4.2. Products
- 18.2.4.3. SWOT Analysis
- 18.2.4.4. Recent Developments
- 18.2.4.5. Financials (Based on Availability)
- 18.2.5 DHW Deutsche Hydrierwerke GmbH
- 18.2.5.1. Overview
- 18.2.5.2. Products
- 18.2.5.3. SWOT Analysis
- 18.2.5.4. Recent Developments
- 18.2.5.5. Financials (Based on Availability)
- 18.2.6 Dupont Nutrition & Health (Danisco)
- 18.2.6.1. Overview
- 18.2.6.2. Products
- 18.2.6.3. SWOT Analysis
- 18.2.6.4. Recent Developments
- 18.2.6.5. Financials (Based on Availability)
- 18.2.7 Archer Daniels Midland Company
- 18.2.7.1. Overview
- 18.2.7.2. Products
- 18.2.7.3. SWOT Analysis
- 18.2.7.4. Recent Developments
- 18.2.7.5. Financials (Based on Availability)
- 18.2.8 Roquette Frères
- 18.2.8.1. Overview
- 18.2.8.2. Products
- 18.2.8.3. SWOT Analysis
- 18.2.8.4. Recent Developments
- 18.2.8.5. Financials (Based on Availability)
- 18.2.9 Cargill Inc
- 18.2.9.1. Overview
- 18.2.9.2. Products
- 18.2.9.3. SWOT Analysis
- 18.2.9.4. Recent Developments
- 18.2.9.5. Financials (Based on Availability)
- 18.2.10 Ingredion Incorporated
- 18.2.10.1. Overview
- 18.2.10.2. Products
- 18.2.10.3. SWOT Analysis
- 18.2.10.4. Recent Developments
- 18.2.10.5. Financials (Based on Availability)
- 18.2.1 Hebei Huaxu Pharmaceutical Co Ltd *List Not Exhaustive
List of Figures
- Figure 1: Global Polyol Sweeteners Industry Revenue Breakdown (Million, %) by Region 2024 & 2032
- Figure 2: Global Polyol Sweeteners Industry Volume Breakdown (K Tons, %) by Region 2024 & 2032
- Figure 3: North America Polyol Sweeteners Industry Revenue (Million), by Country 2024 & 2032
- Figure 4: North America Polyol Sweeteners Industry Volume (K Tons), by Country 2024 & 2032
- Figure 5: North America Polyol Sweeteners Industry Revenue Share (%), by Country 2024 & 2032
- Figure 6: North America Polyol Sweeteners Industry Volume Share (%), by Country 2024 & 2032
- Figure 7: Europe Polyol Sweeteners Industry Revenue (Million), by Country 2024 & 2032
- Figure 8: Europe Polyol Sweeteners Industry Volume (K Tons), by Country 2024 & 2032
- Figure 9: Europe Polyol Sweeteners Industry Revenue Share (%), by Country 2024 & 2032
- Figure 10: Europe Polyol Sweeteners Industry Volume Share (%), by Country 2024 & 2032
- Figure 11: Asia Pacific Polyol Sweeteners Industry Revenue (Million), by Country 2024 & 2032
- Figure 12: Asia Pacific Polyol Sweeteners Industry Volume (K Tons), by Country 2024 & 2032
- Figure 13: Asia Pacific Polyol Sweeteners Industry Revenue Share (%), by Country 2024 & 2032
- Figure 14: Asia Pacific Polyol Sweeteners Industry Volume Share (%), by Country 2024 & 2032
- Figure 15: South America Polyol Sweeteners Industry Revenue (Million), by Country 2024 & 2032
- Figure 16: South America Polyol Sweeteners Industry Volume (K Tons), by Country 2024 & 2032
- Figure 17: South America Polyol Sweeteners Industry Revenue Share (%), by Country 2024 & 2032
- Figure 18: South America Polyol Sweeteners Industry Volume Share (%), by Country 2024 & 2032
- Figure 19: Middle East Polyol Sweeteners Industry Revenue (Million), by Country 2024 & 2032
- Figure 20: Middle East Polyol Sweeteners Industry Volume (K Tons), by Country 2024 & 2032
- Figure 21: Middle East Polyol Sweeteners Industry Revenue Share (%), by Country 2024 & 2032
- Figure 22: Middle East Polyol Sweeteners Industry Volume Share (%), by Country 2024 & 2032
- Figure 23: South Africa Polyol Sweeteners Industry Revenue (Million), by Country 2024 & 2032
- Figure 24: South Africa Polyol Sweeteners Industry Volume (K Tons), by Country 2024 & 2032
- Figure 25: South Africa Polyol Sweeteners Industry Revenue Share (%), by Country 2024 & 2032
- Figure 26: South Africa Polyol Sweeteners Industry Volume Share (%), by Country 2024 & 2032
- Figure 27: North America Polyol Sweeteners Industry Revenue (Million), by Type 2024 & 2032
- Figure 28: North America Polyol Sweeteners Industry Volume (K Tons), by Type 2024 & 2032
- Figure 29: North America Polyol Sweeteners Industry Revenue Share (%), by Type 2024 & 2032
- Figure 30: North America Polyol Sweeteners Industry Volume Share (%), by Type 2024 & 2032
- Figure 31: North America Polyol Sweeteners Industry Revenue (Million), by Application 2024 & 2032
- Figure 32: North America Polyol Sweeteners Industry Volume (K Tons), by Application 2024 & 2032
- Figure 33: North America Polyol Sweeteners Industry Revenue Share (%), by Application 2024 & 2032
- Figure 34: North America Polyol Sweeteners Industry Volume Share (%), by Application 2024 & 2032
- Figure 35: North America Polyol Sweeteners Industry Revenue (Million), by Country 2024 & 2032
- Figure 36: North America Polyol Sweeteners Industry Volume (K Tons), by Country 2024 & 2032
- Figure 37: North America Polyol Sweeteners Industry Revenue Share (%), by Country 2024 & 2032
- Figure 38: North America Polyol Sweeteners Industry Volume Share (%), by Country 2024 & 2032
- Figure 39: Europe Polyol Sweeteners Industry Revenue (Million), by Type 2024 & 2032
- Figure 40: Europe Polyol Sweeteners Industry Volume (K Tons), by Type 2024 & 2032
- Figure 41: Europe Polyol Sweeteners Industry Revenue Share (%), by Type 2024 & 2032
- Figure 42: Europe Polyol Sweeteners Industry Volume Share (%), by Type 2024 & 2032
- Figure 43: Europe Polyol Sweeteners Industry Revenue (Million), by Application 2024 & 2032
- Figure 44: Europe Polyol Sweeteners Industry Volume (K Tons), by Application 2024 & 2032
- Figure 45: Europe Polyol Sweeteners Industry Revenue Share (%), by Application 2024 & 2032
- Figure 46: Europe Polyol Sweeteners Industry Volume Share (%), by Application 2024 & 2032
- Figure 47: Europe Polyol Sweeteners Industry Revenue (Million), by Country 2024 & 2032
- Figure 48: Europe Polyol Sweeteners Industry Volume (K Tons), by Country 2024 & 2032
- Figure 49: Europe Polyol Sweeteners Industry Revenue Share (%), by Country 2024 & 2032
- Figure 50: Europe Polyol Sweeteners Industry Volume Share (%), by Country 2024 & 2032
- Figure 51: Asia Pacific Polyol Sweeteners Industry Revenue (Million), by Type 2024 & 2032
- Figure 52: Asia Pacific Polyol Sweeteners Industry Volume (K Tons), by Type 2024 & 2032
- Figure 53: Asia Pacific Polyol Sweeteners Industry Revenue Share (%), by Type 2024 & 2032
- Figure 54: Asia Pacific Polyol Sweeteners Industry Volume Share (%), by Type 2024 & 2032
- Figure 55: Asia Pacific Polyol Sweeteners Industry Revenue (Million), by Application 2024 & 2032
- Figure 56: Asia Pacific Polyol Sweeteners Industry Volume (K Tons), by Application 2024 & 2032
- Figure 57: Asia Pacific Polyol Sweeteners Industry Revenue Share (%), by Application 2024 & 2032
- Figure 58: Asia Pacific Polyol Sweeteners Industry Volume Share (%), by Application 2024 & 2032
- Figure 59: Asia Pacific Polyol Sweeteners Industry Revenue (Million), by Country 2024 & 2032
- Figure 60: Asia Pacific Polyol Sweeteners Industry Volume (K Tons), by Country 2024 & 2032
- Figure 61: Asia Pacific Polyol Sweeteners Industry Revenue Share (%), by Country 2024 & 2032
- Figure 62: Asia Pacific Polyol Sweeteners Industry Volume Share (%), by Country 2024 & 2032
- Figure 63: South America Polyol Sweeteners Industry Revenue (Million), by Type 2024 & 2032
- Figure 64: South America Polyol Sweeteners Industry Volume (K Tons), by Type 2024 & 2032
- Figure 65: South America Polyol Sweeteners Industry Revenue Share (%), by Type 2024 & 2032
- Figure 66: South America Polyol Sweeteners Industry Volume Share (%), by Type 2024 & 2032
- Figure 67: South America Polyol Sweeteners Industry Revenue (Million), by Application 2024 & 2032
- Figure 68: South America Polyol Sweeteners Industry Volume (K Tons), by Application 2024 & 2032
- Figure 69: South America Polyol Sweeteners Industry Revenue Share (%), by Application 2024 & 2032
- Figure 70: South America Polyol Sweeteners Industry Volume Share (%), by Application 2024 & 2032
- Figure 71: South America Polyol Sweeteners Industry Revenue (Million), by Country 2024 & 2032
- Figure 72: South America Polyol Sweeteners Industry Volume (K Tons), by Country 2024 & 2032
- Figure 73: South America Polyol Sweeteners Industry Revenue Share (%), by Country 2024 & 2032
- Figure 74: South America Polyol Sweeteners Industry Volume Share (%), by Country 2024 & 2032
- Figure 75: Middle East Polyol Sweeteners Industry Revenue (Million), by Type 2024 & 2032
- Figure 76: Middle East Polyol Sweeteners Industry Volume (K Tons), by Type 2024 & 2032
- Figure 77: Middle East Polyol Sweeteners Industry Revenue Share (%), by Type 2024 & 2032
- Figure 78: Middle East Polyol Sweeteners Industry Volume Share (%), by Type 2024 & 2032
- Figure 79: Middle East Polyol Sweeteners Industry Revenue (Million), by Application 2024 & 2032
- Figure 80: Middle East Polyol Sweeteners Industry Volume (K Tons), by Application 2024 & 2032
- Figure 81: Middle East Polyol Sweeteners Industry Revenue Share (%), by Application 2024 & 2032
- Figure 82: Middle East Polyol Sweeteners Industry Volume Share (%), by Application 2024 & 2032
- Figure 83: Middle East Polyol Sweeteners Industry Revenue (Million), by Country 2024 & 2032
- Figure 84: Middle East Polyol Sweeteners Industry Volume (K Tons), by Country 2024 & 2032
- Figure 85: Middle East Polyol Sweeteners Industry Revenue Share (%), by Country 2024 & 2032
- Figure 86: Middle East Polyol Sweeteners Industry Volume Share (%), by Country 2024 & 2032
- Figure 87: South Africa Polyol Sweeteners Industry Revenue (Million), by Type 2024 & 2032
- Figure 88: South Africa Polyol Sweeteners Industry Volume (K Tons), by Type 2024 & 2032
- Figure 89: South Africa Polyol Sweeteners Industry Revenue Share (%), by Type 2024 & 2032
- Figure 90: South Africa Polyol Sweeteners Industry Volume Share (%), by Type 2024 & 2032
- Figure 91: South Africa Polyol Sweeteners Industry Revenue (Million), by Application 2024 & 2032
- Figure 92: South Africa Polyol Sweeteners Industry Volume (K Tons), by Application 2024 & 2032
- Figure 93: South Africa Polyol Sweeteners Industry Revenue Share (%), by Application 2024 & 2032
- Figure 94: South Africa Polyol Sweeteners Industry Volume Share (%), by Application 2024 & 2032
- Figure 95: South Africa Polyol Sweeteners Industry Revenue (Million), by Country 2024 & 2032
- Figure 96: South Africa Polyol Sweeteners Industry Volume (K Tons), by Country 2024 & 2032
- Figure 97: South Africa Polyol Sweeteners Industry Revenue Share (%), by Country 2024 & 2032
- Figure 98: South Africa Polyol Sweeteners Industry Volume Share (%), by Country 2024 & 2032
List of Tables
- Table 1: Global Polyol Sweeteners Industry Revenue Million Forecast, by Region 2019 & 2032
- Table 2: Global Polyol Sweeteners Industry Volume K Tons Forecast, by Region 2019 & 2032
- Table 3: Global Polyol Sweeteners Industry Revenue Million Forecast, by Type 2019 & 2032
- Table 4: Global Polyol Sweeteners Industry Volume K Tons Forecast, by Type 2019 & 2032
- Table 5: Global Polyol Sweeteners Industry Revenue Million Forecast, by Application 2019 & 2032
- Table 6: Global Polyol Sweeteners Industry Volume K Tons Forecast, by Application 2019 & 2032
- Table 7: Global Polyol Sweeteners Industry Revenue Million Forecast, by Region 2019 & 2032
- Table 8: Global Polyol Sweeteners Industry Volume K Tons Forecast, by Region 2019 & 2032
- Table 9: Global Polyol Sweeteners Industry Revenue Million Forecast, by Country 2019 & 2032
- Table 10: Global Polyol Sweeteners Industry Volume K Tons Forecast, by Country 2019 & 2032
- Table 11: United States Polyol Sweeteners Industry Revenue (Million) Forecast, by Application 2019 & 2032
- Table 12: United States Polyol Sweeteners Industry Volume (K Tons) Forecast, by Application 2019 & 2032
- Table 13: Canada Polyol Sweeteners Industry Revenue (Million) Forecast, by Application 2019 & 2032
- Table 14: Canada Polyol Sweeteners Industry Volume (K Tons) Forecast, by Application 2019 & 2032
- Table 15: Mexico Polyol Sweeteners Industry Revenue (Million) Forecast, by Application 2019 & 2032
- Table 16: Mexico Polyol Sweeteners Industry Volume (K Tons) Forecast, by Application 2019 & 2032
- Table 17: Rest of North America Polyol Sweeteners Industry Revenue (Million) Forecast, by Application 2019 & 2032
- Table 18: Rest of North America Polyol Sweeteners Industry Volume (K Tons) Forecast, by Application 2019 & 2032
- Table 19: Global Polyol Sweeteners Industry Revenue Million Forecast, by Country 2019 & 2032
- Table 20: Global Polyol Sweeteners Industry Volume K Tons Forecast, by Country 2019 & 2032
- Table 21: United Kingdom Polyol Sweeteners Industry Revenue (Million) Forecast, by Application 2019 & 2032
- Table 22: United Kingdom Polyol Sweeteners Industry Volume (K Tons) Forecast, by Application 2019 & 2032
- Table 23: Germany Polyol Sweeteners Industry Revenue (Million) Forecast, by Application 2019 & 2032
- Table 24: Germany Polyol Sweeteners Industry Volume (K Tons) Forecast, by Application 2019 & 2032
- Table 25: France Polyol Sweeteners Industry Revenue (Million) Forecast, by Application 2019 & 2032
- Table 26: France Polyol Sweeteners Industry Volume (K Tons) Forecast, by Application 2019 & 2032
- Table 27: Russia Polyol Sweeteners Industry Revenue (Million) Forecast, by Application 2019 & 2032
- Table 28: Russia Polyol Sweeteners Industry Volume (K Tons) Forecast, by Application 2019 & 2032
- Table 29: Italy Polyol Sweeteners Industry Revenue (Million) Forecast, by Application 2019 & 2032
- Table 30: Italy Polyol Sweeteners Industry Volume (K Tons) Forecast, by Application 2019 & 2032
- Table 31: Spain Polyol Sweeteners Industry Revenue (Million) Forecast, by Application 2019 & 2032
- Table 32: Spain Polyol Sweeteners Industry Volume (K Tons) Forecast, by Application 2019 & 2032
- Table 33: Rest of Europe Polyol Sweeteners Industry Revenue (Million) Forecast, by Application 2019 & 2032
- Table 34: Rest of Europe Polyol Sweeteners Industry Volume (K Tons) Forecast, by Application 2019 & 2032
- Table 35: Global Polyol Sweeteners Industry Revenue Million Forecast, by Country 2019 & 2032
- Table 36: Global Polyol Sweeteners Industry Volume K Tons Forecast, by Country 2019 & 2032
- Table 37: India Polyol Sweeteners Industry Revenue (Million) Forecast, by Application 2019 & 2032
- Table 38: India Polyol Sweeteners Industry Volume (K Tons) Forecast, by Application 2019 & 2032
- Table 39: China Polyol Sweeteners Industry Revenue (Million) Forecast, by Application 2019 & 2032
- Table 40: China Polyol Sweeteners Industry Volume (K Tons) Forecast, by Application 2019 & 2032
- Table 41: Japan Polyol Sweeteners Industry Revenue (Million) Forecast, by Application 2019 & 2032
- Table 42: Japan Polyol Sweeteners Industry Volume (K Tons) Forecast, by Application 2019 & 2032
- Table 43: Australia Polyol Sweeteners Industry Revenue (Million) Forecast, by Application 2019 & 2032
- Table 44: Australia Polyol Sweeteners Industry Volume (K Tons) Forecast, by Application 2019 & 2032
- Table 45: Rest of Asia Pacific Polyol Sweeteners Industry Revenue (Million) Forecast, by Application 2019 & 2032
- Table 46: Rest of Asia Pacific Polyol Sweeteners Industry Volume (K Tons) Forecast, by Application 2019 & 2032
- Table 47: Global Polyol Sweeteners Industry Revenue Million Forecast, by Country 2019 & 2032
- Table 48: Global Polyol Sweeteners Industry Volume K Tons Forecast, by Country 2019 & 2032
- Table 49: Brazil Polyol Sweeteners Industry Revenue (Million) Forecast, by Application 2019 & 2032
- Table 50: Brazil Polyol Sweeteners Industry Volume (K Tons) Forecast, by Application 2019 & 2032
- Table 51: Argentina Polyol Sweeteners Industry Revenue (Million) Forecast, by Application 2019 & 2032
- Table 52: Argentina Polyol Sweeteners Industry Volume (K Tons) Forecast, by Application 2019 & 2032
- Table 53: Rest of South America Polyol Sweeteners Industry Revenue (Million) Forecast, by Application 2019 & 2032
- Table 54: Rest of South America Polyol Sweeteners Industry Volume (K Tons) Forecast, by Application 2019 & 2032
- Table 55: Global Polyol Sweeteners Industry Revenue Million Forecast, by Country 2019 & 2032
- Table 56: Global Polyol Sweeteners Industry Volume K Tons Forecast, by Country 2019 & 2032
- Table 57: Polyol Sweeteners Industry Revenue (Million) Forecast, by Application 2019 & 2032
- Table 58: Polyol Sweeteners Industry Volume (K Tons) Forecast, by Application 2019 & 2032
- Table 59: Global Polyol Sweeteners Industry Revenue Million Forecast, by Country 2019 & 2032
- Table 60: Global Polyol Sweeteners Industry Volume K Tons Forecast, by Country 2019 & 2032
- Table 61: Saudi Arabia Polyol Sweeteners Industry Revenue (Million) Forecast, by Application 2019 & 2032
- Table 62: Saudi Arabia Polyol Sweeteners Industry Volume (K Tons) Forecast, by Application 2019 & 2032
- Table 63: Rest of MEA Polyol Sweeteners Industry Revenue (Million) Forecast, by Application 2019 & 2032
- Table 64: Rest of MEA Polyol Sweeteners Industry Volume (K Tons) Forecast, by Application 2019 & 2032
- Table 65: Global Polyol Sweeteners Industry Revenue Million Forecast, by Type 2019 & 2032
- Table 66: Global Polyol Sweeteners Industry Volume K Tons Forecast, by Type 2019 & 2032
- Table 67: Global Polyol Sweeteners Industry Revenue Million Forecast, by Application 2019 & 2032
- Table 68: Global Polyol Sweeteners Industry Volume K Tons Forecast, by Application 2019 & 2032
- Table 69: Global Polyol Sweeteners Industry Revenue Million Forecast, by Country 2019 & 2032
- Table 70: Global Polyol Sweeteners Industry Volume K Tons Forecast, by Country 2019 & 2032
- Table 71: United States Polyol Sweeteners Industry Revenue (Million) Forecast, by Application 2019 & 2032
- Table 72: United States Polyol Sweeteners Industry Volume (K Tons) Forecast, by Application 2019 & 2032
- Table 73: Canada Polyol Sweeteners Industry Revenue (Million) Forecast, by Application 2019 & 2032
- Table 74: Canada Polyol Sweeteners Industry Volume (K Tons) Forecast, by Application 2019 & 2032
- Table 75: Mexico Polyol Sweeteners Industry Revenue (Million) Forecast, by Application 2019 & 2032
- Table 76: Mexico Polyol Sweeteners Industry Volume (K Tons) Forecast, by Application 2019 & 2032
- Table 77: Rest of North America Polyol Sweeteners Industry Revenue (Million) Forecast, by Application 2019 & 2032
- Table 78: Rest of North America Polyol Sweeteners Industry Volume (K Tons) Forecast, by Application 2019 & 2032
- Table 79: Global Polyol Sweeteners Industry Revenue Million Forecast, by Type 2019 & 2032
- Table 80: Global Polyol Sweeteners Industry Volume K Tons Forecast, by Type 2019 & 2032
- Table 81: Global Polyol Sweeteners Industry Revenue Million Forecast, by Application 2019 & 2032
- Table 82: Global Polyol Sweeteners Industry Volume K Tons Forecast, by Application 2019 & 2032
- Table 83: Global Polyol Sweeteners Industry Revenue Million Forecast, by Country 2019 & 2032
- Table 84: Global Polyol Sweeteners Industry Volume K Tons Forecast, by Country 2019 & 2032
- Table 85: United Kingdom Polyol Sweeteners Industry Revenue (Million) Forecast, by Application 2019 & 2032
- Table 86: United Kingdom Polyol Sweeteners Industry Volume (K Tons) Forecast, by Application 2019 & 2032
- Table 87: Germany Polyol Sweeteners Industry Revenue (Million) Forecast, by Application 2019 & 2032
- Table 88: Germany Polyol Sweeteners Industry Volume (K Tons) Forecast, by Application 2019 & 2032
- Table 89: France Polyol Sweeteners Industry Revenue (Million) Forecast, by Application 2019 & 2032
- Table 90: France Polyol Sweeteners Industry Volume (K Tons) Forecast, by Application 2019 & 2032
- Table 91: Russia Polyol Sweeteners Industry Revenue (Million) Forecast, by Application 2019 & 2032
- Table 92: Russia Polyol Sweeteners Industry Volume (K Tons) Forecast, by Application 2019 & 2032
- Table 93: Italy Polyol Sweeteners Industry Revenue (Million) Forecast, by Application 2019 & 2032
- Table 94: Italy Polyol Sweeteners Industry Volume (K Tons) Forecast, by Application 2019 & 2032
- Table 95: Spain Polyol Sweeteners Industry Revenue (Million) Forecast, by Application 2019 & 2032
- Table 96: Spain Polyol Sweeteners Industry Volume (K Tons) Forecast, by Application 2019 & 2032
- Table 97: Rest of Europe Polyol Sweeteners Industry Revenue (Million) Forecast, by Application 2019 & 2032
- Table 98: Rest of Europe Polyol Sweeteners Industry Volume (K Tons) Forecast, by Application 2019 & 2032
- Table 99: Global Polyol Sweeteners Industry Revenue Million Forecast, by Type 2019 & 2032
- Table 100: Global Polyol Sweeteners Industry Volume K Tons Forecast, by Type 2019 & 2032
- Table 101: Global Polyol Sweeteners Industry Revenue Million Forecast, by Application 2019 & 2032
- Table 102: Global Polyol Sweeteners Industry Volume K Tons Forecast, by Application 2019 & 2032
- Table 103: Global Polyol Sweeteners Industry Revenue Million Forecast, by Country 2019 & 2032
- Table 104: Global Polyol Sweeteners Industry Volume K Tons Forecast, by Country 2019 & 2032
- Table 105: India Polyol Sweeteners Industry Revenue (Million) Forecast, by Application 2019 & 2032
- Table 106: India Polyol Sweeteners Industry Volume (K Tons) Forecast, by Application 2019 & 2032
- Table 107: China Polyol Sweeteners Industry Revenue (Million) Forecast, by Application 2019 & 2032
- Table 108: China Polyol Sweeteners Industry Volume (K Tons) Forecast, by Application 2019 & 2032
- Table 109: Japan Polyol Sweeteners Industry Revenue (Million) Forecast, by Application 2019 & 2032
- Table 110: Japan Polyol Sweeteners Industry Volume (K Tons) Forecast, by Application 2019 & 2032
- Table 111: Australia Polyol Sweeteners Industry Revenue (Million) Forecast, by Application 2019 & 2032
- Table 112: Australia Polyol Sweeteners Industry Volume (K Tons) Forecast, by Application 2019 & 2032
- Table 113: Rest of Asia Pacific Polyol Sweeteners Industry Revenue (Million) Forecast, by Application 2019 & 2032
- Table 114: Rest of Asia Pacific Polyol Sweeteners Industry Volume (K Tons) Forecast, by Application 2019 & 2032
- Table 115: Global Polyol Sweeteners Industry Revenue Million Forecast, by Type 2019 & 2032
- Table 116: Global Polyol Sweeteners Industry Volume K Tons Forecast, by Type 2019 & 2032
- Table 117: Global Polyol Sweeteners Industry Revenue Million Forecast, by Application 2019 & 2032
- Table 118: Global Polyol Sweeteners Industry Volume K Tons Forecast, by Application 2019 & 2032
- Table 119: Global Polyol Sweeteners Industry Revenue Million Forecast, by Country 2019 & 2032
- Table 120: Global Polyol Sweeteners Industry Volume K Tons Forecast, by Country 2019 & 2032
- Table 121: Brazil Polyol Sweeteners Industry Revenue (Million) Forecast, by Application 2019 & 2032
- Table 122: Brazil Polyol Sweeteners Industry Volume (K Tons) Forecast, by Application 2019 & 2032
- Table 123: Argentina Polyol Sweeteners Industry Revenue (Million) Forecast, by Application 2019 & 2032
- Table 124: Argentina Polyol Sweeteners Industry Volume (K Tons) Forecast, by Application 2019 & 2032
- Table 125: Rest of South America Polyol Sweeteners Industry Revenue (Million) Forecast, by Application 2019 & 2032
- Table 126: Rest of South America Polyol Sweeteners Industry Volume (K Tons) Forecast, by Application 2019 & 2032
- Table 127: Global Polyol Sweeteners Industry Revenue Million Forecast, by Type 2019 & 2032
- Table 128: Global Polyol Sweeteners Industry Volume K Tons Forecast, by Type 2019 & 2032
- Table 129: Global Polyol Sweeteners Industry Revenue Million Forecast, by Application 2019 & 2032
- Table 130: Global Polyol Sweeteners Industry Volume K Tons Forecast, by Application 2019 & 2032
- Table 131: Global Polyol Sweeteners Industry Revenue Million Forecast, by Country 2019 & 2032
- Table 132: Global Polyol Sweeteners Industry Volume K Tons Forecast, by Country 2019 & 2032
- Table 133: Global Polyol Sweeteners Industry Revenue Million Forecast, by Type 2019 & 2032
- Table 134: Global Polyol Sweeteners Industry Volume K Tons Forecast, by Type 2019 & 2032
- Table 135: Global Polyol Sweeteners Industry Revenue Million Forecast, by Application 2019 & 2032
- Table 136: Global Polyol Sweeteners Industry Volume K Tons Forecast, by Application 2019 & 2032
- Table 137: Global Polyol Sweeteners Industry Revenue Million Forecast, by Country 2019 & 2032
- Table 138: Global Polyol Sweeteners Industry Volume K Tons Forecast, by Country 2019 & 2032
- Table 139: Saudi Arabia Polyol Sweeteners Industry Revenue (Million) Forecast, by Application 2019 & 2032
- Table 140: Saudi Arabia Polyol Sweeteners Industry Volume (K Tons) Forecast, by Application 2019 & 2032
- Table 141: Rest of MEA Polyol Sweeteners Industry Revenue (Million) Forecast, by Application 2019 & 2032
- Table 142: Rest of MEA Polyol Sweeteners Industry Volume (K Tons) Forecast, by Application 2019 & 2032
Frequently Asked Questions
1. What is the projected Compound Annual Growth Rate (CAGR) of the Polyol Sweeteners Industry?
The projected CAGR is approximately 4.50%.
2. Which companies are prominent players in the Polyol Sweeteners Industry?
Key companies in the market include Hebei Huaxu Pharmaceutical Co Ltd *List Not Exhaustive, BENEO GmbH, B Food Science Co Ltd, DFI Corporation, DHW Deutsche Hydrierwerke GmbH, Dupont Nutrition & Health (Danisco), Archer Daniels Midland Company, Roquette Frères, Cargill Inc, Ingredion Incorporated.
3. What are the main segments of the Polyol Sweeteners Industry?
The market segments include Type, Application.
4. Can you provide details about the market size?
The market size is estimated to be USD 3500 Million as of 2022.
5. What are some drivers contributing to market growth?
Increasing Demand for Organic Plant Proteins; Increasing Application of Pea Protein in Food and Beverages.
6. What are the notable trends driving market growth?
Rising Preference Towards Low-Calorie Sweetener.
7. Are there any restraints impacting market growth?
Presence of Alternative protein sources.
8. Can you provide examples of recent developments in the market?
March 2023: Archer Daniels Midland Company announced the launch of the Knwble Grwn brand to provide consumers with wholesome, plant-based food ingredients that are sustainably sourced.
9. What pricing options are available for accessing the report?
Pricing options include single-user, multi-user, and enterprise licenses priced at USD 4750, USD 5250, and USD 8750 respectively.
10. Is the market size provided in terms of value or volume?
The market size is provided in terms of value, measured in Million and volume, measured in K Tons.
11. Are there any specific market keywords associated with the report?
Yes, the market keyword associated with the report is "Polyol Sweeteners Industry," which aids in identifying and referencing the specific market segment covered.
12. How do I determine which pricing option suits my needs best?
The pricing options vary based on user requirements and access needs. Individual users may opt for single-user licenses, while businesses requiring broader access may choose multi-user or enterprise licenses for cost-effective access to the report.
13. Are there any additional resources or data provided in the Polyol Sweeteners Industry report?
While the report offers comprehensive insights, it's advisable to review the specific contents or supplementary materials provided to ascertain if additional resources or data are available.
14. How can I stay updated on further developments or reports in the Polyol Sweeteners Industry?
To stay informed about further developments, trends, and reports in the Polyol Sweeteners Industry, consider subscribing to industry newsletters, following relevant companies and organizations, or regularly checking reputable industry news sources and publications.
Methodology
Step 1 - Identification of Relevant Samples Size from Population Database


Step 2 - Approaches for Defining Global Market Size (Value, Volume* & Price*)

Note*: In applicable scenarios
Step 3 - Data Sources
Primary Research
- Web Analytics
- Survey Reports
- Research Institute
- Latest Research Reports
- Opinion Leaders
Secondary Research
- Annual Reports
- White Paper
- Latest Press Release
- Industry Association
- Paid Database
- Investor Presentations

Step 4 - Data Triangulation
Involves using different sources of information in order to increase the validity of a study
These sources are likely to be stakeholders in a program - participants, other researchers, program staff, other community members, and so on.
Then we put all data in single framework & apply various statistical tools to find out the dynamic on the market.
During the analysis stage, feedback from the stakeholder groups would be compared to determine areas of agreement as well as areas of divergence


