Exploring Naval Actuators And Valves Market Market Disruption and Innovation

Naval Actuators And Valves Market by Production Analysis, by Consumption Analysis, by Import Market Analysis (Value & Volume), by Export Market Analysis (Value & Volume), by Price Trend Analysis, by North America (United States, Canada, Mexico), by South America (Brazil, Argentina, Rest of South America), by Europe (United Kingdom, Germany, France, Italy, Spain, Russia, Benelux, Nordics, Rest of Europe), by Middle East & Africa (Turkey, Israel, GCC, North Africa, South Africa, Rest of Middle East & Africa), by Asia Pacific (China, India, Japan, South Korea, ASEAN, Oceania, Rest of Asia Pacific) Forecast 2025-2033

Jun 25 2025
Base Year: 2024

234 Pages
Main Logo

Exploring Naval Actuators And Valves Market Market Disruption and Innovation


Home
Industries
Aerospace & Defense
sponsor image
sponsor image
sponsor image
sponsor image

Tailored for you

  • In-depth Analysis Tailored to Specified Regions or Segments
  • Company Profiles Customized to User Preferences
  • Comprehensive Insights Focused on Specific Segments or Regions
  • Customized Evaluation of Competitive Landscape to Meet Your Needs
  • Tailored Customization to Address Other Specific Requirements
Ask for customization


Key Insights

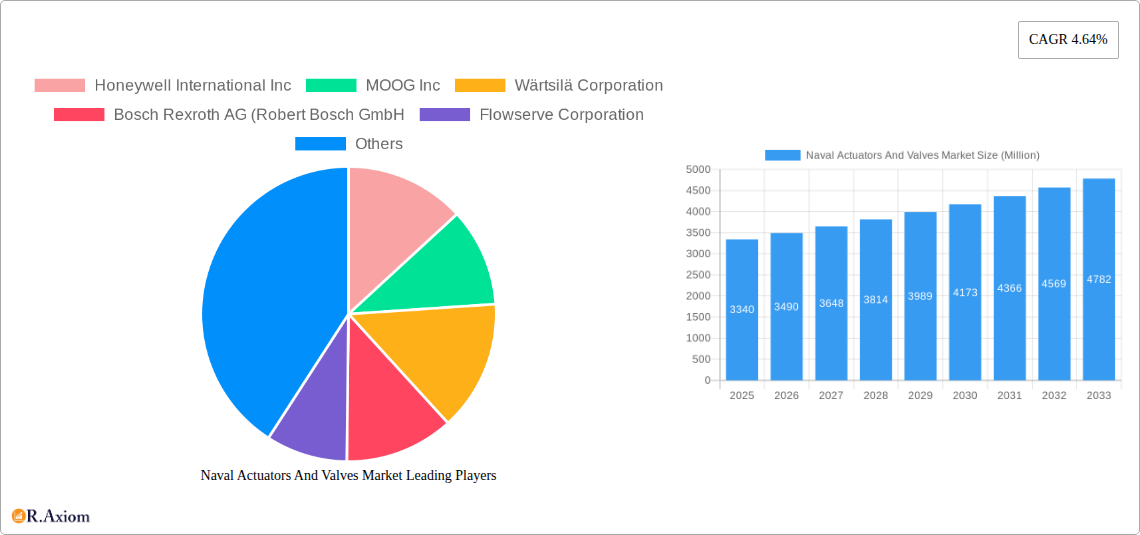
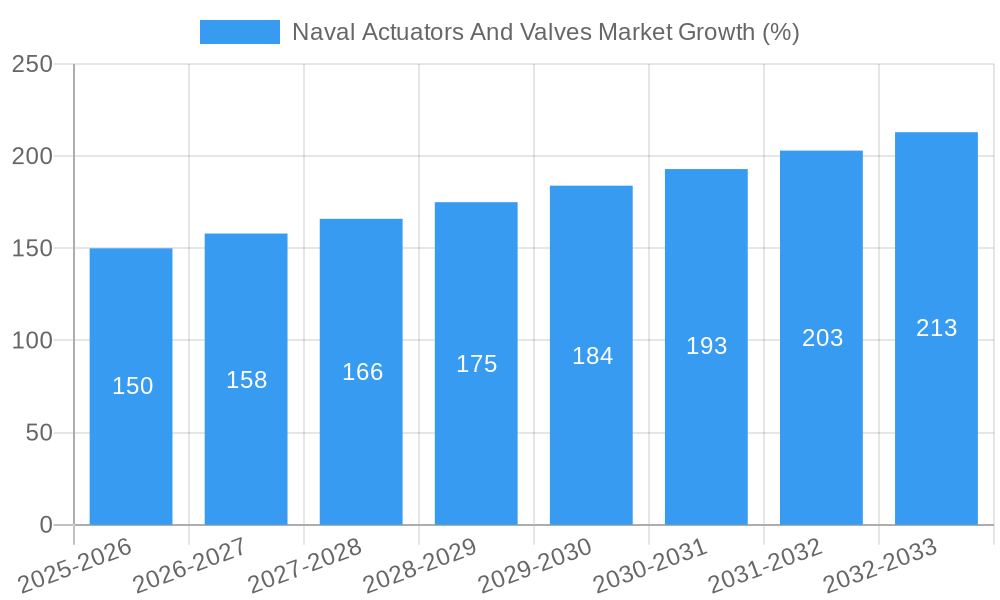
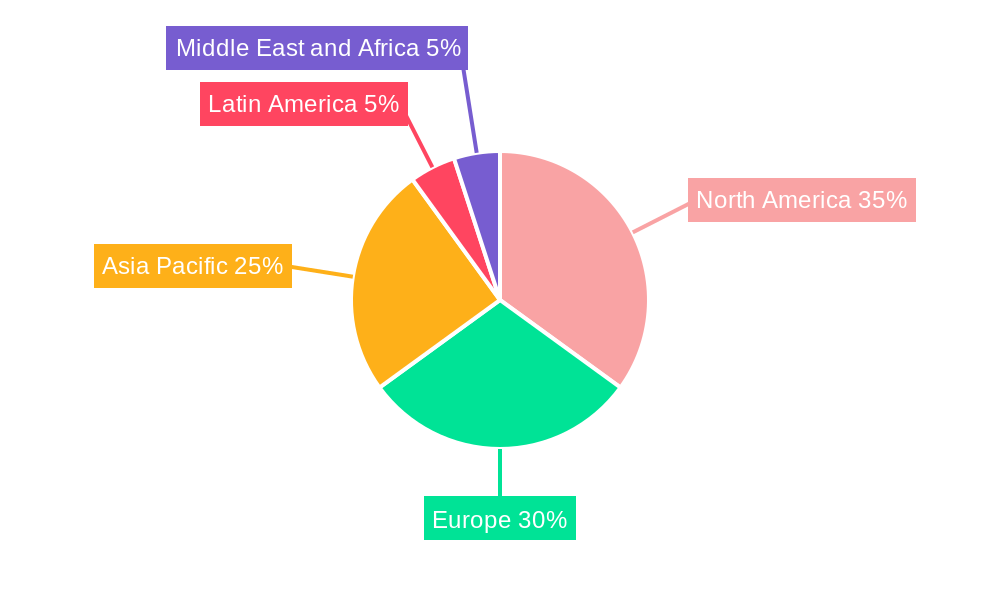
The Naval Actuators and Valves Market, valued at $3.34 billion in 2025, is projected to experience robust growth, driven by increasing naval modernization programs globally and the rising demand for advanced automation in naval vessels. The market's Compound Annual Growth Rate (CAGR) of 4.64% from 2025 to 2033 indicates a steady expansion, fueled by several key factors. Technological advancements in actuator types, including the adoption of more efficient and reliable electric and hybrid systems, are contributing significantly to market growth. Furthermore, the increasing focus on enhancing vessel safety and operational efficiency is driving demand for sophisticated valve and actuator technologies. The segmental breakdown reveals a strong preference for aluminum-based materials due to their lightweight yet robust nature, and mechanical actuators continue to dominate due to their proven reliability in harsh marine environments. However, the market faces certain restraints, such as high initial investment costs associated with advanced actuator systems and the need for skilled technicians for installation and maintenance. Regionally, North America and Europe are currently leading the market, driven by strong naval spending and technological advancements within these regions. However, the Asia-Pacific region is poised for significant growth, propelled by increasing defense budgets and the modernization of naval fleets in countries like China and India.

The competitive landscape is characterized by a mix of established players and specialized manufacturers. Companies like Honeywell, Moog, Wärtsilä, and Bosch Rexroth are major contributors, leveraging their expertise in automation and control systems. The market is expected to witness further consolidation through strategic partnerships and acquisitions, with a focus on developing innovative solutions that address the evolving needs of the naval industry. The forecast period (2025-2033) will likely see a shift towards more sophisticated and integrated actuator and valve systems, driven by the demand for improved performance, reduced maintenance needs, and enhanced operational capabilities in naval vessels. This trend will necessitate continuous innovation and investment in research and development by market players to maintain a competitive edge.

Naval Actuators And Valves Market Research Report - Market Size, Growth & Forecast

Naval Actuators and Valves Market: A Comprehensive Report (2019-2033)

This in-depth report provides a comprehensive analysis of the Naval Actuators and Valves Market, offering valuable insights for industry stakeholders, investors, and strategic decision-makers. The study covers the period from 2019 to 2033, with 2025 as the base and estimated year, and a forecast period of 2025-2033. The report utilizes a robust methodology incorporating historical data (2019-2024) and future projections to paint a clear picture of market dynamics.

Naval Actuators And Valves Market Market Concentration & Innovation

The Naval Actuators and Valves market exhibits a moderately concentrated landscape, with key players like Honeywell International Inc, MOOG Inc, and Wärtsilä Corporation holding significant market share. The exact market share distribution for 2025 is estimated at xx%, with the top 5 players accounting for approximately 60% of the total market revenue of approximately $XX Million. Innovation is driven by the need for enhanced performance, reliability, and energy efficiency in naval applications. Stringent regulatory frameworks, particularly concerning safety and environmental compliance, further shape the market. The industry witnesses continuous technological advancements, including the integration of smart sensors and digital technologies for improved monitoring and predictive maintenance. Product substitution is limited due to the specialized nature of naval actuators and valves; however, advancements in materials and designs constantly push performance boundaries. Mergers and acquisitions (M&A) play a crucial role in shaping the market landscape. Recent M&A activity totaled approximately $XX Million in 2024, primarily driven by companies seeking to expand their product portfolio and geographic reach. End-user trends show a preference for customized solutions that cater to the unique requirements of various naval platforms.

  • Key Players Market Share (Estimated 2025): Honeywell International Inc (xx%), MOOG Inc (xx%), Wärtsilä Corporation (xx%), Bosch Rexroth AG (xx%), Flowserve Corporation (xx%).
  • M&A Activity (2024): Total deal value approximately $XX Million.

Naval Actuators And Valves Market Industry Trends & Insights

The Naval Actuators and Valves market is projected to experience a Compound Annual Growth Rate (CAGR) of xx% during the forecast period (2025-2033), driven by several key factors. Increasing naval modernization programs globally, particularly in regions like Asia-Pacific and the Middle East, are significantly boosting demand. The rising adoption of automation and advanced control systems in naval vessels fuels the demand for sophisticated actuators and valves. Technological disruptions, including the integration of artificial intelligence (AI) and machine learning (ML) for predictive maintenance and improved operational efficiency, are reshaping the market. Consumer preferences are shifting towards lighter, more durable, and energy-efficient products, prompting manufacturers to invest in advanced materials and design technologies. The competitive landscape is characterized by intense rivalry, with companies focusing on product differentiation, technological innovation, and strategic partnerships to gain a competitive edge. Market penetration of advanced actuators, such as those incorporating hybrid technologies, is increasing steadily. The market penetration rate for hybrid actuators in 2025 is estimated at xx%.

Naval Actuators And Valves Market Growth

Dominant Markets & Segments in Naval Actuators And Valves Market

The Asia-Pacific region is currently the dominant market for naval actuators and valves, driven by robust naval shipbuilding activities and modernization efforts within the region. The defense segment holds a significant market share, although the commercial segment is experiencing significant growth. Within materials, Stainless Steel dominates due to its corrosion resistance, while within actuator types, the Electrical segment is growing rapidly due to its precise control and efficiency.

Key Drivers:

  • Asia-Pacific: High government spending on naval defense and increasing shipbuilding activity.
  • Defense Segment: Continuous modernization and upgrade of naval fleets globally.
  • Stainless Steel: Superior corrosion resistance crucial for marine environments.
  • Electrical Actuators: Precise control, energy efficiency, and ease of integration.

Dominance Analysis: The dominance of the Asia-Pacific region and the defense segment is expected to continue throughout the forecast period due to sustained government investment in naval capabilities. Stainless steel is anticipated to maintain its market leadership, although the adoption of lighter-weight alloys will gradually increase. Electrical actuators will continue to gain market share driven by technological advancements and increasing preference for automation.

Naval Actuators And Valves Market Product Developments

Recent product developments focus on enhancing efficiency, reducing weight, and improving reliability. Manufacturers are introducing smart actuators with integrated sensors and data analytics capabilities for real-time monitoring and predictive maintenance. The integration of advanced materials like lightweight alloys improves fuel efficiency and operational performance. These developments are designed to meet the evolving demands of modern naval vessels, which emphasize enhanced capabilities and reduced operational costs. The market is witnessing a shift towards modular and customizable designs allowing greater flexibility in integrating actuators and valves into various platforms.

Report Scope & Segmentation Analysis

This report segments the Naval Actuators and Valves market based on Material (Aluminum, Stainless Steel, Alloy-based), Actuator Type (Mechanical, Hydraulic, Pneumatic, Electrical, Hybrid), and Platform (Defense, Commercial). Each segment is analyzed in detail, providing insights into market size, growth projections, and competitive dynamics.

  • Material: Stainless Steel is currently the largest segment, followed by Aluminum and Alloy-based materials. The growth of Alloy-based materials is projected to be faster in the next few years.
  • Actuator Type: Electrical actuators are witnessing the highest growth rate due to their advanced control capabilities. However, Hydraulic actuators maintain significant market share in certain applications.
  • Platform: The Defense segment is larger currently, but the Commercial segment is expected to witness faster growth driven by expansion in offshore oil and gas and other marine industries.

Key Drivers of Naval Actuators And Valves Market Growth

Several factors fuel the growth of the Naval Actuators and Valves market. Firstly, increased government spending on naval modernization and procurement across several key global regions drives significant demand. Secondly, technological advancements in materials, leading to lighter, more durable, and energy-efficient actuators and valves, are vital. Finally, stringent regulatory standards regarding safety and environmental compliance create a need for improved and specialized components.

Challenges in the Naval Actuators And Valves Market Sector

The market faces challenges such as high initial investment costs associated with advanced technologies and the complexity of integrating new systems into existing naval vessels. Supply chain disruptions and fluctuations in raw material prices impact profitability. Intense competition from established players and the emergence of new entrants present a significant challenge. Furthermore, the long lead times for procurement and the need for stringent quality control increase the complexity and cost.

Emerging Opportunities in Naval Actuators And Valves Market

Emerging opportunities exist in the development and adoption of smart actuators equipped with advanced monitoring and predictive maintenance capabilities. The integration of AI and ML for optimized performance and reduced maintenance costs presents a significant opportunity. Furthermore, the growing demand for autonomous and unmanned naval systems creates opportunities for specialized actuators and valves capable of withstanding harsh marine environments. The expansion into new markets, particularly within the offshore oil and gas and other marine industries presents further expansion opportunities.

Leading Players in the Naval Actuators And Valves Market Market

  • Honeywell International Inc
  • MOOG Inc
  • Wärtsilä Corporation
  • Bosch Rexroth AG (Robert Bosch GmbH)
  • Flowserve Corporation
  • Rotork PLC
  • Diakont
  • Emerson Electric Co
  • Curtiss-Wright Corporation
  • Schlumberger Limited
  • IMI PLC
  • AUMA Riester GmbH & Co KG

Key Developments in Naval Actuators And Valves Market Industry

  • January 2024: Honeywell International Inc. launched a new line of smart actuators with integrated sensor technology.
  • June 2023: MOOG Inc. acquired a smaller actuator manufacturer, expanding its product portfolio.
  • October 2022: Wärtsilä Corporation announced a strategic partnership for the development of next-generation naval actuators. (Further details of other developments would be included in the full report.)

Strategic Outlook for Naval Actuators And Valves Market Market

The Naval Actuators and Valves market is poised for continued growth, driven by the ongoing modernization of naval fleets globally, increased adoption of advanced technologies, and the expansion into new market segments. The focus on energy efficiency, enhanced reliability, and improved operational capabilities will continue to shape the industry. Opportunities exist for companies that can innovate and offer customized solutions tailored to the specific needs of naval vessels. The market will likely witness further consolidation through M&A activities, leading to a more concentrated landscape.

Naval Actuators And Valves Market Segmentation

  • 1. Production Analysis
  • 2. Consumption Analysis
  • 3. Import Market Analysis (Value & Volume)
  • 4. Export Market Analysis (Value & Volume)
  • 5. Price Trend Analysis

Naval Actuators And Valves Market Segmentation By Geography

  • 1. North America
    • 1.1. United States
    • 1.2. Canada
    • 1.3. Mexico
  • 2. South America
    • 2.1. Brazil
    • 2.2. Argentina
    • 2.3. Rest of South America
  • 3. Europe
    • 3.1. United Kingdom
    • 3.2. Germany
    • 3.3. France
    • 3.4. Italy
    • 3.5. Spain
    • 3.6. Russia
    • 3.7. Benelux
    • 3.8. Nordics
    • 3.9. Rest of Europe
  • 4. Middle East & Africa
    • 4.1. Turkey
    • 4.2. Israel
    • 4.3. GCC
    • 4.4. North Africa
    • 4.5. South Africa
    • 4.6. Rest of Middle East & Africa
  • 5. Asia Pacific
    • 5.1. China
    • 5.2. India
    • 5.3. Japan
    • 5.4. South Korea
    • 5.5. ASEAN
    • 5.6. Oceania
    • 5.7. Rest of Asia Pacific
Naval Actuators And Valves Market Regional Share


Naval Actuators And Valves Market REPORT HIGHLIGHTS

AspectsDetails
Study Period 2019-2033
Base Year 2024
Estimated Year 2025
Forecast Period2025-2033
Historical Period2019-2024
Growth RateCAGR of 4.64% from 2019-2033
Segmentation
    • By Production Analysis
    • By Consumption Analysis
    • By Import Market Analysis (Value & Volume)
    • By Export Market Analysis (Value & Volume)
    • By Price Trend Analysis
  • By Geography
    • North America
      • United States
      • Canada
      • Mexico
    • South America
      • Brazil
      • Argentina
      • Rest of South America
    • Europe
      • United Kingdom
      • Germany
      • France
      • Italy
      • Spain
      • Russia
      • Benelux
      • Nordics
      • Rest of Europe
    • Middle East & Africa
      • Turkey
      • Israel
      • GCC
      • North Africa
      • South Africa
      • Rest of Middle East & Africa
    • Asia Pacific
      • China
      • India
      • Japan
      • South Korea
      • ASEAN
      • Oceania
      • Rest of Asia Pacific


Table of Contents

  1. 1. Introduction
    • 1.1. Research Scope
    • 1.2. Market Segmentation
    • 1.3. Research Methodology
    • 1.4. Definitions and Assumptions
  2. 2. Executive Summary
    • 2.1. Introduction
  3. 3. Market Dynamics
    • 3.1. Introduction
      • 3.2. Market Drivers
        • 3.2.1. Increase in Internet of Things (IoT) and Autonomous Systems; Rise in Demand for Military and Defense Satellite Communication Solutions
      • 3.3. Market Restrains
        • 3.3.1. Cybersecurity Threats to Satellite Communication; Interference in Transmission of Data
      • 3.4. Market Trends
        • 3.4.1. Defense Segment is Expected to Dominate the Market
  4. 4. Market Factor Analysis
    • 4.1. Porters Five Forces
    • 4.2. Supply/Value Chain
    • 4.3. PESTEL analysis
    • 4.4. Market Entropy
    • 4.5. Patent/Trademark Analysis
  5. 5. Global Naval Actuators And Valves Market Analysis, Insights and Forecast, 2019-2031
    • 5.1. Market Analysis, Insights and Forecast - by Production Analysis
      • 5.2. Market Analysis, Insights and Forecast - by Consumption Analysis
        • 5.3. Market Analysis, Insights and Forecast - by Import Market Analysis (Value & Volume)
          • 5.4. Market Analysis, Insights and Forecast - by Export Market Analysis (Value & Volume)
            • 5.5. Market Analysis, Insights and Forecast - by Price Trend Analysis
              • 5.6. Market Analysis, Insights and Forecast - by Region
                • 5.6.1. North America
                • 5.6.2. South America
                • 5.6.3. Europe
                • 5.6.4. Middle East & Africa
                • 5.6.5. Asia Pacific
            • 6. North America Naval Actuators And Valves Market Analysis, Insights and Forecast, 2019-2031
              • 6.1. Market Analysis, Insights and Forecast - by Production Analysis
                • 6.2. Market Analysis, Insights and Forecast - by Consumption Analysis
                  • 6.3. Market Analysis, Insights and Forecast - by Import Market Analysis (Value & Volume)
                    • 6.4. Market Analysis, Insights and Forecast - by Export Market Analysis (Value & Volume)
                      • 6.5. Market Analysis, Insights and Forecast - by Price Trend Analysis
                      • 7. South America Naval Actuators And Valves Market Analysis, Insights and Forecast, 2019-2031
                        • 7.1. Market Analysis, Insights and Forecast - by Production Analysis
                          • 7.2. Market Analysis, Insights and Forecast - by Consumption Analysis
                            • 7.3. Market Analysis, Insights and Forecast - by Import Market Analysis (Value & Volume)
                              • 7.4. Market Analysis, Insights and Forecast - by Export Market Analysis (Value & Volume)
                                • 7.5. Market Analysis, Insights and Forecast - by Price Trend Analysis
                                • 8. Europe Naval Actuators And Valves Market Analysis, Insights and Forecast, 2019-2031
                                  • 8.1. Market Analysis, Insights and Forecast - by Production Analysis
                                    • 8.2. Market Analysis, Insights and Forecast - by Consumption Analysis
                                      • 8.3. Market Analysis, Insights and Forecast - by Import Market Analysis (Value & Volume)
                                        • 8.4. Market Analysis, Insights and Forecast - by Export Market Analysis (Value & Volume)
                                          • 8.5. Market Analysis, Insights and Forecast - by Price Trend Analysis
                                          • 9. Middle East & Africa Naval Actuators And Valves Market Analysis, Insights and Forecast, 2019-2031
                                            • 9.1. Market Analysis, Insights and Forecast - by Production Analysis
                                              • 9.2. Market Analysis, Insights and Forecast - by Consumption Analysis
                                                • 9.3. Market Analysis, Insights and Forecast - by Import Market Analysis (Value & Volume)
                                                  • 9.4. Market Analysis, Insights and Forecast - by Export Market Analysis (Value & Volume)
                                                    • 9.5. Market Analysis, Insights and Forecast - by Price Trend Analysis
                                                    • 10. Asia Pacific Naval Actuators And Valves Market Analysis, Insights and Forecast, 2019-2031
                                                      • 10.1. Market Analysis, Insights and Forecast - by Production Analysis
                                                        • 10.2. Market Analysis, Insights and Forecast - by Consumption Analysis
                                                          • 10.3. Market Analysis, Insights and Forecast - by Import Market Analysis (Value & Volume)
                                                            • 10.4. Market Analysis, Insights and Forecast - by Export Market Analysis (Value & Volume)
                                                              • 10.5. Market Analysis, Insights and Forecast - by Price Trend Analysis
                                                              • 11. North America Naval Actuators And Valves Market Analysis, Insights and Forecast, 2019-2031
                                                                  • 11.1. Market Analysis, Insights and Forecast - By Country/Sub-region
                                                                    • 11.1.1 United States
                                                                    • 11.1.2 Canada
                                                              • 12. Europe Naval Actuators And Valves Market Analysis, Insights and Forecast, 2019-2031
                                                                  • 12.1. Market Analysis, Insights and Forecast - By Country/Sub-region
                                                                    • 12.1.1 Germany
                                                                    • 12.1.2 United Kingdom
                                                                    • 12.1.3 France
                                                                    • 12.1.4 Russia
                                                                    • 12.1.5 Rest of Europe
                                                              • 13. Asia Pacific Naval Actuators And Valves Market Analysis, Insights and Forecast, 2019-2031
                                                                  • 13.1. Market Analysis, Insights and Forecast - By Country/Sub-region
                                                                    • 13.1.1 India
                                                                    • 13.1.2 China
                                                                    • 13.1.3 Japan
                                                                    • 13.1.4 South Korea
                                                                    • 13.1.5 Rest of Asia Pacific
                                                              • 14. Latin America Naval Actuators And Valves Market Analysis, Insights and Forecast, 2019-2031
                                                                  • 14.1. Market Analysis, Insights and Forecast - By Country/Sub-region
                                                                    • 14.1.1 Mexico
                                                                    • 14.1.2 Brazil
                                                                    • 14.1.3 Rest of Latin America
                                                              • 15. Middle East and Africa Naval Actuators And Valves Market Analysis, Insights and Forecast, 2019-2031
                                                                  • 15.1. Market Analysis, Insights and Forecast - By Country/Sub-region
                                                                    • 15.1.1 United Arab Emirates
                                                                    • 15.1.2 Saudi Arabia
                                                                    • 15.1.3 Egypt
                                                                    • 15.1.4 Israel
                                                                    • 15.1.5 Rest of Middle East and Africa
                                                              • 16. Competitive Analysis
                                                                • 16.1. Global Market Share Analysis 2024
                                                                  • 16.2. Company Profiles
                                                                    • 16.2.1 Honeywell International Inc
                                                                      • 16.2.1.1. Overview
                                                                      • 16.2.1.2. Products
                                                                      • 16.2.1.3. SWOT Analysis
                                                                      • 16.2.1.4. Recent Developments
                                                                      • 16.2.1.5. Financials (Based on Availability)
                                                                    • 16.2.2 MOOG Inc
                                                                      • 16.2.2.1. Overview
                                                                      • 16.2.2.2. Products
                                                                      • 16.2.2.3. SWOT Analysis
                                                                      • 16.2.2.4. Recent Developments
                                                                      • 16.2.2.5. Financials (Based on Availability)
                                                                    • 16.2.3 Wärtsilä Corporation
                                                                      • 16.2.3.1. Overview
                                                                      • 16.2.3.2. Products
                                                                      • 16.2.3.3. SWOT Analysis
                                                                      • 16.2.3.4. Recent Developments
                                                                      • 16.2.3.5. Financials (Based on Availability)
                                                                    • 16.2.4 Bosch Rexroth AG (Robert Bosch GmbH
                                                                      • 16.2.4.1. Overview
                                                                      • 16.2.4.2. Products
                                                                      • 16.2.4.3. SWOT Analysis
                                                                      • 16.2.4.4. Recent Developments
                                                                      • 16.2.4.5. Financials (Based on Availability)
                                                                    • 16.2.5 Flowserve Corporation
                                                                      • 16.2.5.1. Overview
                                                                      • 16.2.5.2. Products
                                                                      • 16.2.5.3. SWOT Analysis
                                                                      • 16.2.5.4. Recent Developments
                                                                      • 16.2.5.5. Financials (Based on Availability)
                                                                    • 16.2.6 Rotork PLC
                                                                      • 16.2.6.1. Overview
                                                                      • 16.2.6.2. Products
                                                                      • 16.2.6.3. SWOT Analysis
                                                                      • 16.2.6.4. Recent Developments
                                                                      • 16.2.6.5. Financials (Based on Availability)
                                                                    • 16.2.7 Diakont
                                                                      • 16.2.7.1. Overview
                                                                      • 16.2.7.2. Products
                                                                      • 16.2.7.3. SWOT Analysis
                                                                      • 16.2.7.4. Recent Developments
                                                                      • 16.2.7.5. Financials (Based on Availability)
                                                                    • 16.2.8 Emerson Electric Co
                                                                      • 16.2.8.1. Overview
                                                                      • 16.2.8.2. Products
                                                                      • 16.2.8.3. SWOT Analysis
                                                                      • 16.2.8.4. Recent Developments
                                                                      • 16.2.8.5. Financials (Based on Availability)
                                                                    • 16.2.9 Curtiss-Wright Corporation
                                                                      • 16.2.9.1. Overview
                                                                      • 16.2.9.2. Products
                                                                      • 16.2.9.3. SWOT Analysis
                                                                      • 16.2.9.4. Recent Developments
                                                                      • 16.2.9.5. Financials (Based on Availability)
                                                                    • 16.2.10 Schlumberger Limited
                                                                      • 16.2.10.1. Overview
                                                                      • 16.2.10.2. Products
                                                                      • 16.2.10.3. SWOT Analysis
                                                                      • 16.2.10.4. Recent Developments
                                                                      • 16.2.10.5. Financials (Based on Availability)
                                                                    • 16.2.11 IMI PLC
                                                                      • 16.2.11.1. Overview
                                                                      • 16.2.11.2. Products
                                                                      • 16.2.11.3. SWOT Analysis
                                                                      • 16.2.11.4. Recent Developments
                                                                      • 16.2.11.5. Financials (Based on Availability)
                                                                    • 16.2.12 AUMA Riester GmbH & Co KG
                                                                      • 16.2.12.1. Overview
                                                                      • 16.2.12.2. Products
                                                                      • 16.2.12.3. SWOT Analysis
                                                                      • 16.2.12.4. Recent Developments
                                                                      • 16.2.12.5. Financials (Based on Availability)

                                                              List of Figures

                                                              1. Figure 1: Global Naval Actuators And Valves Market Revenue Breakdown (Million, %) by Region 2024 & 2032
                                                              2. Figure 2: North America Naval Actuators And Valves Market Revenue (Million), by Country 2024 & 2032
                                                              3. Figure 3: North America Naval Actuators And Valves Market Revenue Share (%), by Country 2024 & 2032
                                                              4. Figure 4: Europe Naval Actuators And Valves Market Revenue (Million), by Country 2024 & 2032
                                                              5. Figure 5: Europe Naval Actuators And Valves Market Revenue Share (%), by Country 2024 & 2032
                                                              6. Figure 6: Asia Pacific Naval Actuators And Valves Market Revenue (Million), by Country 2024 & 2032
                                                              7. Figure 7: Asia Pacific Naval Actuators And Valves Market Revenue Share (%), by Country 2024 & 2032
                                                              8. Figure 8: Latin America Naval Actuators And Valves Market Revenue (Million), by Country 2024 & 2032
                                                              9. Figure 9: Latin America Naval Actuators And Valves Market Revenue Share (%), by Country 2024 & 2032
                                                              10. Figure 10: Middle East and Africa Naval Actuators And Valves Market Revenue (Million), by Country 2024 & 2032
                                                              11. Figure 11: Middle East and Africa Naval Actuators And Valves Market Revenue Share (%), by Country 2024 & 2032
                                                              12. Figure 12: North America Naval Actuators And Valves Market Revenue (Million), by Production Analysis 2024 & 2032
                                                              13. Figure 13: North America Naval Actuators And Valves Market Revenue Share (%), by Production Analysis 2024 & 2032
                                                              14. Figure 14: North America Naval Actuators And Valves Market Revenue (Million), by Consumption Analysis 2024 & 2032
                                                              15. Figure 15: North America Naval Actuators And Valves Market Revenue Share (%), by Consumption Analysis 2024 & 2032
                                                              16. Figure 16: North America Naval Actuators And Valves Market Revenue (Million), by Import Market Analysis (Value & Volume) 2024 & 2032
                                                              17. Figure 17: North America Naval Actuators And Valves Market Revenue Share (%), by Import Market Analysis (Value & Volume) 2024 & 2032
                                                              18. Figure 18: North America Naval Actuators And Valves Market Revenue (Million), by Export Market Analysis (Value & Volume) 2024 & 2032
                                                              19. Figure 19: North America Naval Actuators And Valves Market Revenue Share (%), by Export Market Analysis (Value & Volume) 2024 & 2032
                                                              20. Figure 20: North America Naval Actuators And Valves Market Revenue (Million), by Price Trend Analysis 2024 & 2032
                                                              21. Figure 21: North America Naval Actuators And Valves Market Revenue Share (%), by Price Trend Analysis 2024 & 2032
                                                              22. Figure 22: North America Naval Actuators And Valves Market Revenue (Million), by Country 2024 & 2032
                                                              23. Figure 23: North America Naval Actuators And Valves Market Revenue Share (%), by Country 2024 & 2032
                                                              24. Figure 24: South America Naval Actuators And Valves Market Revenue (Million), by Production Analysis 2024 & 2032
                                                              25. Figure 25: South America Naval Actuators And Valves Market Revenue Share (%), by Production Analysis 2024 & 2032
                                                              26. Figure 26: South America Naval Actuators And Valves Market Revenue (Million), by Consumption Analysis 2024 & 2032
                                                              27. Figure 27: South America Naval Actuators And Valves Market Revenue Share (%), by Consumption Analysis 2024 & 2032
                                                              28. Figure 28: South America Naval Actuators And Valves Market Revenue (Million), by Import Market Analysis (Value & Volume) 2024 & 2032
                                                              29. Figure 29: South America Naval Actuators And Valves Market Revenue Share (%), by Import Market Analysis (Value & Volume) 2024 & 2032
                                                              30. Figure 30: South America Naval Actuators And Valves Market Revenue (Million), by Export Market Analysis (Value & Volume) 2024 & 2032
                                                              31. Figure 31: South America Naval Actuators And Valves Market Revenue Share (%), by Export Market Analysis (Value & Volume) 2024 & 2032
                                                              32. Figure 32: South America Naval Actuators And Valves Market Revenue (Million), by Price Trend Analysis 2024 & 2032
                                                              33. Figure 33: South America Naval Actuators And Valves Market Revenue Share (%), by Price Trend Analysis 2024 & 2032
                                                              34. Figure 34: South America Naval Actuators And Valves Market Revenue (Million), by Country 2024 & 2032
                                                              35. Figure 35: South America Naval Actuators And Valves Market Revenue Share (%), by Country 2024 & 2032
                                                              36. Figure 36: Europe Naval Actuators And Valves Market Revenue (Million), by Production Analysis 2024 & 2032
                                                              37. Figure 37: Europe Naval Actuators And Valves Market Revenue Share (%), by Production Analysis 2024 & 2032
                                                              38. Figure 38: Europe Naval Actuators And Valves Market Revenue (Million), by Consumption Analysis 2024 & 2032
                                                              39. Figure 39: Europe Naval Actuators And Valves Market Revenue Share (%), by Consumption Analysis 2024 & 2032
                                                              40. Figure 40: Europe Naval Actuators And Valves Market Revenue (Million), by Import Market Analysis (Value & Volume) 2024 & 2032
                                                              41. Figure 41: Europe Naval Actuators And Valves Market Revenue Share (%), by Import Market Analysis (Value & Volume) 2024 & 2032
                                                              42. Figure 42: Europe Naval Actuators And Valves Market Revenue (Million), by Export Market Analysis (Value & Volume) 2024 & 2032
                                                              43. Figure 43: Europe Naval Actuators And Valves Market Revenue Share (%), by Export Market Analysis (Value & Volume) 2024 & 2032
                                                              44. Figure 44: Europe Naval Actuators And Valves Market Revenue (Million), by Price Trend Analysis 2024 & 2032
                                                              45. Figure 45: Europe Naval Actuators And Valves Market Revenue Share (%), by Price Trend Analysis 2024 & 2032
                                                              46. Figure 46: Europe Naval Actuators And Valves Market Revenue (Million), by Country 2024 & 2032
                                                              47. Figure 47: Europe Naval Actuators And Valves Market Revenue Share (%), by Country 2024 & 2032
                                                              48. Figure 48: Middle East & Africa Naval Actuators And Valves Market Revenue (Million), by Production Analysis 2024 & 2032
                                                              49. Figure 49: Middle East & Africa Naval Actuators And Valves Market Revenue Share (%), by Production Analysis 2024 & 2032
                                                              50. Figure 50: Middle East & Africa Naval Actuators And Valves Market Revenue (Million), by Consumption Analysis 2024 & 2032
                                                              51. Figure 51: Middle East & Africa Naval Actuators And Valves Market Revenue Share (%), by Consumption Analysis 2024 & 2032
                                                              52. Figure 52: Middle East & Africa Naval Actuators And Valves Market Revenue (Million), by Import Market Analysis (Value & Volume) 2024 & 2032
                                                              53. Figure 53: Middle East & Africa Naval Actuators And Valves Market Revenue Share (%), by Import Market Analysis (Value & Volume) 2024 & 2032
                                                              54. Figure 54: Middle East & Africa Naval Actuators And Valves Market Revenue (Million), by Export Market Analysis (Value & Volume) 2024 & 2032
                                                              55. Figure 55: Middle East & Africa Naval Actuators And Valves Market Revenue Share (%), by Export Market Analysis (Value & Volume) 2024 & 2032
                                                              56. Figure 56: Middle East & Africa Naval Actuators And Valves Market Revenue (Million), by Price Trend Analysis 2024 & 2032
                                                              57. Figure 57: Middle East & Africa Naval Actuators And Valves Market Revenue Share (%), by Price Trend Analysis 2024 & 2032
                                                              58. Figure 58: Middle East & Africa Naval Actuators And Valves Market Revenue (Million), by Country 2024 & 2032
                                                              59. Figure 59: Middle East & Africa Naval Actuators And Valves Market Revenue Share (%), by Country 2024 & 2032
                                                              60. Figure 60: Asia Pacific Naval Actuators And Valves Market Revenue (Million), by Production Analysis 2024 & 2032
                                                              61. Figure 61: Asia Pacific Naval Actuators And Valves Market Revenue Share (%), by Production Analysis 2024 & 2032
                                                              62. Figure 62: Asia Pacific Naval Actuators And Valves Market Revenue (Million), by Consumption Analysis 2024 & 2032
                                                              63. Figure 63: Asia Pacific Naval Actuators And Valves Market Revenue Share (%), by Consumption Analysis 2024 & 2032
                                                              64. Figure 64: Asia Pacific Naval Actuators And Valves Market Revenue (Million), by Import Market Analysis (Value & Volume) 2024 & 2032
                                                              65. Figure 65: Asia Pacific Naval Actuators And Valves Market Revenue Share (%), by Import Market Analysis (Value & Volume) 2024 & 2032
                                                              66. Figure 66: Asia Pacific Naval Actuators And Valves Market Revenue (Million), by Export Market Analysis (Value & Volume) 2024 & 2032
                                                              67. Figure 67: Asia Pacific Naval Actuators And Valves Market Revenue Share (%), by Export Market Analysis (Value & Volume) 2024 & 2032
                                                              68. Figure 68: Asia Pacific Naval Actuators And Valves Market Revenue (Million), by Price Trend Analysis 2024 & 2032
                                                              69. Figure 69: Asia Pacific Naval Actuators And Valves Market Revenue Share (%), by Price Trend Analysis 2024 & 2032
                                                              70. Figure 70: Asia Pacific Naval Actuators And Valves Market Revenue (Million), by Country 2024 & 2032
                                                              71. Figure 71: Asia Pacific Naval Actuators And Valves Market Revenue Share (%), by Country 2024 & 2032

                                                              List of Tables

                                                              1. Table 1: Global Naval Actuators And Valves Market Revenue Million Forecast, by Region 2019 & 2032
                                                              2. Table 2: Global Naval Actuators And Valves Market Revenue Million Forecast, by Production Analysis 2019 & 2032
                                                              3. Table 3: Global Naval Actuators And Valves Market Revenue Million Forecast, by Consumption Analysis 2019 & 2032
                                                              4. Table 4: Global Naval Actuators And Valves Market Revenue Million Forecast, by Import Market Analysis (Value & Volume) 2019 & 2032
                                                              5. Table 5: Global Naval Actuators And Valves Market Revenue Million Forecast, by Export Market Analysis (Value & Volume) 2019 & 2032
                                                              6. Table 6: Global Naval Actuators And Valves Market Revenue Million Forecast, by Price Trend Analysis 2019 & 2032
                                                              7. Table 7: Global Naval Actuators And Valves Market Revenue Million Forecast, by Region 2019 & 2032
                                                              8. Table 8: Global Naval Actuators And Valves Market Revenue Million Forecast, by Country 2019 & 2032
                                                              9. Table 9: United States Naval Actuators And Valves Market Revenue (Million) Forecast, by Application 2019 & 2032
                                                              10. Table 10: Canada Naval Actuators And Valves Market Revenue (Million) Forecast, by Application 2019 & 2032
                                                              11. Table 11: Global Naval Actuators And Valves Market Revenue Million Forecast, by Country 2019 & 2032
                                                              12. Table 12: Germany Naval Actuators And Valves Market Revenue (Million) Forecast, by Application 2019 & 2032
                                                              13. Table 13: United Kingdom Naval Actuators And Valves Market Revenue (Million) Forecast, by Application 2019 & 2032
                                                              14. Table 14: France Naval Actuators And Valves Market Revenue (Million) Forecast, by Application 2019 & 2032
                                                              15. Table 15: Russia Naval Actuators And Valves Market Revenue (Million) Forecast, by Application 2019 & 2032
                                                              16. Table 16: Rest of Europe Naval Actuators And Valves Market Revenue (Million) Forecast, by Application 2019 & 2032
                                                              17. Table 17: Global Naval Actuators And Valves Market Revenue Million Forecast, by Country 2019 & 2032
                                                              18. Table 18: India Naval Actuators And Valves Market Revenue (Million) Forecast, by Application 2019 & 2032
                                                              19. Table 19: China Naval Actuators And Valves Market Revenue (Million) Forecast, by Application 2019 & 2032
                                                              20. Table 20: Japan Naval Actuators And Valves Market Revenue (Million) Forecast, by Application 2019 & 2032
                                                              21. Table 21: South Korea Naval Actuators And Valves Market Revenue (Million) Forecast, by Application 2019 & 2032
                                                              22. Table 22: Rest of Asia Pacific Naval Actuators And Valves Market Revenue (Million) Forecast, by Application 2019 & 2032
                                                              23. Table 23: Global Naval Actuators And Valves Market Revenue Million Forecast, by Country 2019 & 2032
                                                              24. Table 24: Mexico Naval Actuators And Valves Market Revenue (Million) Forecast, by Application 2019 & 2032
                                                              25. Table 25: Brazil Naval Actuators And Valves Market Revenue (Million) Forecast, by Application 2019 & 2032
                                                              26. Table 26: Rest of Latin America Naval Actuators And Valves Market Revenue (Million) Forecast, by Application 2019 & 2032
                                                              27. Table 27: Global Naval Actuators And Valves Market Revenue Million Forecast, by Country 2019 & 2032
                                                              28. Table 28: United Arab Emirates Naval Actuators And Valves Market Revenue (Million) Forecast, by Application 2019 & 2032
                                                              29. Table 29: Saudi Arabia Naval Actuators And Valves Market Revenue (Million) Forecast, by Application 2019 & 2032
                                                              30. Table 30: Egypt Naval Actuators And Valves Market Revenue (Million) Forecast, by Application 2019 & 2032
                                                              31. Table 31: Israel Naval Actuators And Valves Market Revenue (Million) Forecast, by Application 2019 & 2032
                                                              32. Table 32: Rest of Middle East and Africa Naval Actuators And Valves Market Revenue (Million) Forecast, by Application 2019 & 2032
                                                              33. Table 33: Global Naval Actuators And Valves Market Revenue Million Forecast, by Production Analysis 2019 & 2032
                                                              34. Table 34: Global Naval Actuators And Valves Market Revenue Million Forecast, by Consumption Analysis 2019 & 2032
                                                              35. Table 35: Global Naval Actuators And Valves Market Revenue Million Forecast, by Import Market Analysis (Value & Volume) 2019 & 2032
                                                              36. Table 36: Global Naval Actuators And Valves Market Revenue Million Forecast, by Export Market Analysis (Value & Volume) 2019 & 2032
                                                              37. Table 37: Global Naval Actuators And Valves Market Revenue Million Forecast, by Price Trend Analysis 2019 & 2032
                                                              38. Table 38: Global Naval Actuators And Valves Market Revenue Million Forecast, by Country 2019 & 2032
                                                              39. Table 39: United States Naval Actuators And Valves Market Revenue (Million) Forecast, by Application 2019 & 2032
                                                              40. Table 40: Canada Naval Actuators And Valves Market Revenue (Million) Forecast, by Application 2019 & 2032
                                                              41. Table 41: Mexico Naval Actuators And Valves Market Revenue (Million) Forecast, by Application 2019 & 2032
                                                              42. Table 42: Global Naval Actuators And Valves Market Revenue Million Forecast, by Production Analysis 2019 & 2032
                                                              43. Table 43: Global Naval Actuators And Valves Market Revenue Million Forecast, by Consumption Analysis 2019 & 2032
                                                              44. Table 44: Global Naval Actuators And Valves Market Revenue Million Forecast, by Import Market Analysis (Value & Volume) 2019 & 2032
                                                              45. Table 45: Global Naval Actuators And Valves Market Revenue Million Forecast, by Export Market Analysis (Value & Volume) 2019 & 2032
                                                              46. Table 46: Global Naval Actuators And Valves Market Revenue Million Forecast, by Price Trend Analysis 2019 & 2032
                                                              47. Table 47: Global Naval Actuators And Valves Market Revenue Million Forecast, by Country 2019 & 2032
                                                              48. Table 48: Brazil Naval Actuators And Valves Market Revenue (Million) Forecast, by Application 2019 & 2032
                                                              49. Table 49: Argentina Naval Actuators And Valves Market Revenue (Million) Forecast, by Application 2019 & 2032
                                                              50. Table 50: Rest of South America Naval Actuators And Valves Market Revenue (Million) Forecast, by Application 2019 & 2032
                                                              51. Table 51: Global Naval Actuators And Valves Market Revenue Million Forecast, by Production Analysis 2019 & 2032
                                                              52. Table 52: Global Naval Actuators And Valves Market Revenue Million Forecast, by Consumption Analysis 2019 & 2032
                                                              53. Table 53: Global Naval Actuators And Valves Market Revenue Million Forecast, by Import Market Analysis (Value & Volume) 2019 & 2032
                                                              54. Table 54: Global Naval Actuators And Valves Market Revenue Million Forecast, by Export Market Analysis (Value & Volume) 2019 & 2032
                                                              55. Table 55: Global Naval Actuators And Valves Market Revenue Million Forecast, by Price Trend Analysis 2019 & 2032
                                                              56. Table 56: Global Naval Actuators And Valves Market Revenue Million Forecast, by Country 2019 & 2032
                                                              57. Table 57: United Kingdom Naval Actuators And Valves Market Revenue (Million) Forecast, by Application 2019 & 2032
                                                              58. Table 58: Germany Naval Actuators And Valves Market Revenue (Million) Forecast, by Application 2019 & 2032
                                                              59. Table 59: France Naval Actuators And Valves Market Revenue (Million) Forecast, by Application 2019 & 2032
                                                              60. Table 60: Italy Naval Actuators And Valves Market Revenue (Million) Forecast, by Application 2019 & 2032
                                                              61. Table 61: Spain Naval Actuators And Valves Market Revenue (Million) Forecast, by Application 2019 & 2032
                                                              62. Table 62: Russia Naval Actuators And Valves Market Revenue (Million) Forecast, by Application 2019 & 2032
                                                              63. Table 63: Benelux Naval Actuators And Valves Market Revenue (Million) Forecast, by Application 2019 & 2032
                                                              64. Table 64: Nordics Naval Actuators And Valves Market Revenue (Million) Forecast, by Application 2019 & 2032
                                                              65. Table 65: Rest of Europe Naval Actuators And Valves Market Revenue (Million) Forecast, by Application 2019 & 2032
                                                              66. Table 66: Global Naval Actuators And Valves Market Revenue Million Forecast, by Production Analysis 2019 & 2032
                                                              67. Table 67: Global Naval Actuators And Valves Market Revenue Million Forecast, by Consumption Analysis 2019 & 2032
                                                              68. Table 68: Global Naval Actuators And Valves Market Revenue Million Forecast, by Import Market Analysis (Value & Volume) 2019 & 2032
                                                              69. Table 69: Global Naval Actuators And Valves Market Revenue Million Forecast, by Export Market Analysis (Value & Volume) 2019 & 2032
                                                              70. Table 70: Global Naval Actuators And Valves Market Revenue Million Forecast, by Price Trend Analysis 2019 & 2032
                                                              71. Table 71: Global Naval Actuators And Valves Market Revenue Million Forecast, by Country 2019 & 2032
                                                              72. Table 72: Turkey Naval Actuators And Valves Market Revenue (Million) Forecast, by Application 2019 & 2032
                                                              73. Table 73: Israel Naval Actuators And Valves Market Revenue (Million) Forecast, by Application 2019 & 2032
                                                              74. Table 74: GCC Naval Actuators And Valves Market Revenue (Million) Forecast, by Application 2019 & 2032
                                                              75. Table 75: North Africa Naval Actuators And Valves Market Revenue (Million) Forecast, by Application 2019 & 2032
                                                              76. Table 76: South Africa Naval Actuators And Valves Market Revenue (Million) Forecast, by Application 2019 & 2032
                                                              77. Table 77: Rest of Middle East & Africa Naval Actuators And Valves Market Revenue (Million) Forecast, by Application 2019 & 2032
                                                              78. Table 78: Global Naval Actuators And Valves Market Revenue Million Forecast, by Production Analysis 2019 & 2032
                                                              79. Table 79: Global Naval Actuators And Valves Market Revenue Million Forecast, by Consumption Analysis 2019 & 2032
                                                              80. Table 80: Global Naval Actuators And Valves Market Revenue Million Forecast, by Import Market Analysis (Value & Volume) 2019 & 2032
                                                              81. Table 81: Global Naval Actuators And Valves Market Revenue Million Forecast, by Export Market Analysis (Value & Volume) 2019 & 2032
                                                              82. Table 82: Global Naval Actuators And Valves Market Revenue Million Forecast, by Price Trend Analysis 2019 & 2032
                                                              83. Table 83: Global Naval Actuators And Valves Market Revenue Million Forecast, by Country 2019 & 2032
                                                              84. Table 84: China Naval Actuators And Valves Market Revenue (Million) Forecast, by Application 2019 & 2032
                                                              85. Table 85: India Naval Actuators And Valves Market Revenue (Million) Forecast, by Application 2019 & 2032
                                                              86. Table 86: Japan Naval Actuators And Valves Market Revenue (Million) Forecast, by Application 2019 & 2032
                                                              87. Table 87: South Korea Naval Actuators And Valves Market Revenue (Million) Forecast, by Application 2019 & 2032
                                                              88. Table 88: ASEAN Naval Actuators And Valves Market Revenue (Million) Forecast, by Application 2019 & 2032
                                                              89. Table 89: Oceania Naval Actuators And Valves Market Revenue (Million) Forecast, by Application 2019 & 2032
                                                              90. Table 90: Rest of Asia Pacific Naval Actuators And Valves Market Revenue (Million) Forecast, by Application 2019 & 2032


                                                              Frequently Asked Questions

                                                              1. What is the projected Compound Annual Growth Rate (CAGR) of the Naval Actuators And Valves Market?

                                                              The projected CAGR is approximately 4.64%.

                                                              2. Which companies are prominent players in the Naval Actuators And Valves Market?

                                                              Key companies in the market include Honeywell International Inc, MOOG Inc, Wärtsilä Corporation, Bosch Rexroth AG (Robert Bosch GmbH, Flowserve Corporation, Rotork PLC, Diakont, Emerson Electric Co, Curtiss-Wright Corporation, Schlumberger Limited, IMI PLC, AUMA Riester GmbH & Co KG.

                                                              3. What are the main segments of the Naval Actuators And Valves Market?

                                                              The market segments include Production Analysis, Consumption Analysis, Import Market Analysis (Value & Volume), Export Market Analysis (Value & Volume), Price Trend Analysis.

                                                              4. Can you provide details about the market size?

                                                              The market size is estimated to be USD 3.34 Million as of 2022.

                                                              5. What are some drivers contributing to market growth?

                                                              Increase in Internet of Things (IoT) and Autonomous Systems; Rise in Demand for Military and Defense Satellite Communication Solutions.

                                                              6. What are the notable trends driving market growth?

                                                              Defense Segment is Expected to Dominate the Market.

                                                              7. Are there any restraints impacting market growth?

                                                              Cybersecurity Threats to Satellite Communication; Interference in Transmission of Data.

                                                              8. Can you provide examples of recent developments in the market?

                                                              N/A

                                                              9. What pricing options are available for accessing the report?

                                                              Pricing options include single-user, multi-user, and enterprise licenses priced at USD 4750, USD 5250, and USD 8750 respectively.

                                                              10. Is the market size provided in terms of value or volume?

                                                              The market size is provided in terms of value, measured in Million.

                                                              11. Are there any specific market keywords associated with the report?

                                                              Yes, the market keyword associated with the report is "Naval Actuators And Valves Market," which aids in identifying and referencing the specific market segment covered.

                                                              12. How do I determine which pricing option suits my needs best?

                                                              The pricing options vary based on user requirements and access needs. Individual users may opt for single-user licenses, while businesses requiring broader access may choose multi-user or enterprise licenses for cost-effective access to the report.

                                                              13. Are there any additional resources or data provided in the Naval Actuators And Valves Market report?

                                                              While the report offers comprehensive insights, it's advisable to review the specific contents or supplementary materials provided to ascertain if additional resources or data are available.

                                                              14. How can I stay updated on further developments or reports in the Naval Actuators And Valves Market?

                                                              To stay informed about further developments, trends, and reports in the Naval Actuators And Valves Market, consider subscribing to industry newsletters, following relevant companies and organizations, or regularly checking reputable industry news sources and publications.


                                                              Methodology

                                                              Step 1 - Identification of Relevant Samples Size from Population Database

                                                              Step Chart
                                                              Bar Chart
                                                              Method Chart

                                                              Step 2 - Approaches for Defining Global Market Size (Value, Volume* & Price*)

                                                              Approach Chart
                                                              Top-down and bottom-up approaches are used to validate the global market size and estimate the market size for manufactures, regional segments, product, and application.

                                                              Note*: In applicable scenarios

                                                              Step 3 - Data Sources

                                                              Primary Research

                                                              • Web Analytics
                                                              • Survey Reports
                                                              • Research Institute
                                                              • Latest Research Reports
                                                              • Opinion Leaders

                                                              Secondary Research

                                                              • Annual Reports
                                                              • White Paper
                                                              • Latest Press Release
                                                              • Industry Association
                                                              • Paid Database
                                                              • Investor Presentations
                                                              Analyst Chart

                                                              Step 4 - Data Triangulation

                                                              Involves using different sources of information in order to increase the validity of a study

                                                              These sources are likely to be stakeholders in a program - participants, other researchers, program staff, other community members, and so on.

                                                              Then we put all data in single framework & apply various statistical tools to find out the dynamic on the market.

                                                              During the analysis stage, feedback from the stakeholder groups would be compared to determine areas of agreement as well as areas of divergence

                                                              Additionally, after gathering mixed and scattered data from a wide range of sources, data is triangulated and correlated to come up with estimated figures which are further validated through primary mediums or industry experts, opinion leaders.

                                                              About Research Axiom

                                                              Research Axiom delivers in-depth market research, industry analysis, and consulting for pharmaceuticals, automotive, IT, and consumer goods. Our reports provide the clarity you need to make informed decisions and drive innovation.

                                                              Our team combines primary research, advanced analytics, and sector expertise to deliver actionable intelligence. We offer syndicated reports, custom research, and consulting services tailored to your business needs.

                                                              At Research Axiom, we are committed to quality, transparency, and client satisfaction. Every report is rigorously validated to ensure accuracy and relevance. Our global perspective and local expertise help you understand both the big picture and the finer details of your market.

                                                              Stay informed with Research Axiom. Subscribe to our newsletter for the latest updates and research highlights, and follow us on social media for real-time insights. Research Axiom – Turning Data into Business Advantage.

                                                              artwork spiralartwork spiralRelated Reports
                                                              artwork underline

                                                              Southeast Asia, Middle-East And Africa Small Arms And Ammunition Market 2025-2033: Preparing for Growth and Change

                                                              The Southeast Asia, Middle East & Africa small arms and ammunition market is projected to reach \$1.07 billion by 2033, growing at a CAGR of 1.83%. This report analyzes market drivers, restraints, and key players, offering valuable insights into this dynamic sector. Explore regional breakdowns and future projections.

                                                              July 2025
                                                              Base Year: 2024
                                                              No Of Pages: 234
                                                              Price: $4750

                                                              Naval Combat Weapons Market Strategic Roadmap: Analysis and Forecasts 2025-2033

                                                              The Naval Combat Weapons market is booming, projected to reach $XX million by 2033 with a 4% CAGR. This comprehensive analysis explores market drivers, trends, restraints, and key players like General Dynamics and Lockheed Martin, covering segments like underwater and surface-based weapons across diverse regions. Discover the future of naval warfare technology.

                                                              July 2025
                                                              Base Year: 2024
                                                              No Of Pages: 234
                                                              Price: $4750

                                                              Target Acquisition Systems Market Report 2025: Growth Driven by Government Incentives and Partnerships

                                                              Discover the explosive growth in the Target Acquisition Systems market, projected to exceed a 5.5% CAGR through 2033. This in-depth analysis reveals key drivers, market segments (land, airborne, naval), leading companies, and regional trends. Learn how technological advancements and geopolitical factors are shaping this lucrative sector.

                                                              July 2025
                                                              Base Year: 2024
                                                              No Of Pages: 234
                                                              Price: $4750

                                                              Aerospace Plastics Industry Market Outlook and Strategic Insights

                                                              The Aerospace Plastics Market is booming, projected to reach $25 billion by 2033 at a CAGR of 7.66%. Driven by lightweighting and fuel efficiency demands, this report analyzes market trends, key players (Premium AEROTEC, Toray Industries), regional growth (North America, Asia-Pacific), and segment applications (aerostructures, cabin interiors). Discover insights into this rapidly expanding sector.

                                                              July 2025
                                                              Base Year: 2024
                                                              No Of Pages: 234
                                                              Price: $4750

                                                              Challenges to Overcome in Commercial Airport Lighting Market Market Growth: Analysis 2025-2033

                                                              The commercial airport lighting market is booming, projected to reach [estimated 2033 market size] by 2033, driven by LED adoption and infrastructure expansion. Learn about market trends, key players (Honeywell, ADB SAFEGATE, etc.), and regional growth in this in-depth analysis.

                                                              July 2025
                                                              Base Year: 2024
                                                              No Of Pages: 234
                                                              Price: $4750

                                                              North America Small Satellite Market 2025-2033 Trends: Unveiling Growth Opportunities and Competitor Dynamics

                                                              The North American small satellite market is booming, with a projected CAGR of 5.18% through 2033. Driven by commercial and government demand for Earth observation, communication, and navigation, this report analyzes market size, key players (SpaceX, Swarm Technologies, etc.), and emerging trends in LEO, GEO, and MEO satellite technology. Discover the opportunities and challenges shaping this dynamic sector.

                                                              July 2025
                                                              Base Year: 2024
                                                              No Of Pages: 197
                                                              Price: $3800

                                                              Aircraft Door Market CAGR Growth Drivers and Trends: Forecasts 2025-2033

                                                              The aircraft door market is booming, projected to reach $8.48 billion by 2033 at a CAGR of 5.69%. This in-depth analysis explores market drivers, trends, restraints, segmentation (commercial, military, general aviation; passenger, cargo, emergency doors), key players (Safran, Collins Aerospace, etc.), and regional growth forecasts. Discover the opportunities and challenges shaping this dynamic sector.

                                                              July 2025
                                                              Base Year: 2024
                                                              No Of Pages: 234
                                                              Price: $4750

                                                              Future-Forward Strategies for EMEA Aviation Infrastructure Industry Industry

                                                              The EMEA aviation infrastructure market is booming, projected to reach $1.47 billion by 2033 with a 4.42% CAGR. Discover key market trends, drivers, restraints, and major players shaping this dynamic sector. Explore regional breakdowns and infrastructure segment analyses.

                                                              July 2025
                                                              Base Year: 2024
                                                              No Of Pages: 234
                                                              Price: $4750

                                                              APAC Military Aircraft Modernization and Retrofit Market 2025 Market Trends and 2033 Forecasts: Exploring Growth Potential

                                                              The APAC military aircraft modernization and retrofit market is booming, projected to reach $13.71 billion by 2025, driven by geopolitical tensions and technological advancements. Learn about key market trends, major players, and growth forecasts until 2033.

                                                              July 2025
                                                              Base Year: 2024
                                                              No Of Pages: 197
                                                              Price: $3800

                                                              Future-Ready Strategies for North America Charter Jet Services Market Market Growth

                                                              The North America charter jet services market is booming, projected to reach \$24.2 billion by 2033 with a 9.1% CAGR. Discover key trends, drivers, and leading companies shaping this lucrative private aviation sector. Learn about market segmentation by aircraft size and regional analysis focusing on the US, Canada, and Mexico.

                                                              July 2025
                                                              Base Year: 2024
                                                              No Of Pages: 234
                                                              Price: $4750

                                                              Middle East Aviation Market Report Probes the XXX Million Size, Share, Growth Report and Future Analysis by 2033

                                                              The Middle East aviation market, a $27.18 billion industry in 2025, is booming. Discover key trends, growth drivers (tourism, infrastructure investments), and leading companies shaping this rapidly expanding sector with a projected 4.40% CAGR until 2033. Explore regional market shares and future projections for commercial, military, and general aviation.

                                                              July 2025
                                                              Base Year: 2024
                                                              No Of Pages: 234
                                                              Price: $4750

                                                              Commercial Airport Radar Systems Industry Future-proof Strategies: Trends, Competitor Dynamics, and Opportunities 2025-2033

                                                              The Commercial Airport Radar Systems market is booming, projected to reach $5.98B in 2025 with a 7.48% CAGR. Discover key trends, drivers, restraints, and leading companies shaping this vital sector for air traffic management. Learn about market segmentation by application (surveillance, weather, approach radars) and regional analysis.

                                                              July 2025
                                                              Base Year: 2024
                                                              No Of Pages: 234
                                                              Price: $4750

                                                              Market Deep Dive: Exploring Defense Aircraft Materials Market Trends 2025-2033

                                                              Discover the booming defense aircraft materials market! This comprehensive analysis reveals key trends, drivers, and restraints impacting growth through 2033, covering materials like aluminum alloys, titanium, and composites, and major players like Toray and DuPont. Explore regional market shares and forecast data.

                                                              July 2025
                                                              Base Year: 2024
                                                              No Of Pages: 234
                                                              Price: $4750

                                                              Future Trends Shaping Naval ISR Market Growth

                                                              Discover the booming Naval ISR market, projected to reach $XX million by 2033 with a 3.5% CAGR. Explore market drivers, trends, and key players like Lockheed Martin and General Dynamics. Learn about regional growth in North America, Europe, and Asia-Pacific. Get the insights you need for strategic planning.

                                                              July 2025
                                                              Base Year: 2024
                                                              No Of Pages: 234
                                                              Price: $4750

                                                              Latin America Inflight Services Market Market’s Growth Blueprint

                                                              Discover the booming Latin American inflight services market! This comprehensive analysis reveals a $1.11B market in 2025, projecting 9.91% CAGR growth to 2033. Explore key drivers, trends, and challenges impacting airlines, catering companies, and passenger experiences. Learn about market segmentation, leading players, and regional opportunities.

                                                              July 2025
                                                              Base Year: 2024
                                                              No Of Pages: 234
                                                              Price: $4750

                                                              Airport Ground Handling Vehicles Industry 2025-2033 Trends: Unveiling Growth Opportunities and Competitor Dynamics

                                                              The Airport Ground Handling Vehicles market is booming, projected to reach $8.94B by 2025 with a 5.99% CAGR. Discover key trends, drivers, and restraints shaping this industry, including the rise of electric vehicles and regional market analysis. Learn about leading companies and future growth forecasts.

                                                              July 2025
                                                              Base Year: 2024
                                                              No Of Pages: 234
                                                              Price: $4750

                                                              Exploring Opportunities in Naval Gas Turbine Market Sector

                                                              Discover the booming Naval Gas Turbine Market, projected to reach $X million by 2033 with a CAGR exceeding 7.80%. Explore market drivers, trends, restraints, key players (GE, Rolls Royce, Mitsubishi), and regional analysis (North America, Europe, Asia-Pacific). Get the insights you need to navigate this high-growth sector.

                                                              July 2025
                                                              Base Year: 2024
                                                              No Of Pages: 234
                                                              Price: $4750

                                                              Middle East Civil Aviation Flight Training and Simulation Market in Emerging Markets: Analysis and Projections 2025-2033

                                                              The Middle East Civil Aviation Flight Training & Simulation Market is booming, with a CAGR exceeding 15%! Discover key trends, drivers, restraints, and leading companies shaping this lucrative sector. Explore market size projections to 2033 and regional breakdowns for the UAE, Saudi Arabia, and more.

                                                              July 2025
                                                              Base Year: 2024
                                                              No Of Pages: 234
                                                              Price: $4750

                                                              Aircraft Winglets Market Market Expansion: Growth Outlook 2025-2033

                                                              The Aircraft Winglets Market is booming, projected to reach \$4.78 billion by 2033, with a CAGR of 7.90%. This report analyzes market drivers, trends, and key players like Aviation Partners Boeing and BLR Aerospace, offering insights into fuel-efficient aviation technologies.

                                                              July 2025
                                                              Base Year: 2024
                                                              No Of Pages: 234
                                                              Price: $4750

                                                              SATCOM Industry Market Expansion Strategies

                                                              The global SATCOM market is booming, with a projected 23.54% CAGR through 2033. Driven by IoT, cloud computing, and government initiatives, this report analyzes market size, segments (LEO, GEO, MEO, satellite mass), key players (SpaceX, Intelsat, Airbus), and regional trends. Discover the future of satellite communication!

                                                              July 2025
                                                              Base Year: 2024
                                                              No Of Pages: 197
                                                              Price: $3800
                                                              • Home
                                                              • About Us
                                                              • Industries
                                                                • Aerospace & Defense
                                                                • Agriculture
                                                                • Animal Nutrition & Wellness
                                                                • Automotive
                                                                • Chemicals & Materials
                                                                • Consumer Goods and Services
                                                                • Energy & Power
                                                                • Financial Services and Investment Intelligence
                                                                • Food & Beverage
                                                                • Home and Property Improvement
                                                                • Hospitality and Tourism
                                                                • Logistics
                                                                • Manufacturing Products and Services
                                                                • Packaging
                                                                • Professional and Commercial Services
                                                                • Real Estate and Construction
                                                                • Retail
                                                                • Technology, Media and Telecom
                                                                • Healthcare
                                                              • Services
                                                              • Contact
                                                              Main Logo
                                                              • Home
                                                              • About Us
                                                              • Industries
                                                                • Aerospace & Defense
                                                                • Agriculture
                                                                • Animal Nutrition & Wellness
                                                                • Automotive
                                                                • Chemicals & Materials
                                                                • Consumer Goods and Services
                                                                • Energy & Power
                                                                • Financial Services and Investment Intelligence
                                                                • Food & Beverage
                                                                • Home and Property Improvement
                                                                • Hospitality and Tourism
                                                                • Logistics
                                                                • Manufacturing Products and Services
                                                                • Packaging
                                                                • Professional and Commercial Services
                                                                • Real Estate and Construction
                                                                • Retail
                                                                • Technology, Media and Telecom
                                                                • Healthcare
                                                              • Services
                                                              • Contact
                                                              +17162654855
                                                              [email protected]

                                                              +17162654855

                                                              [email protected]

                                                              Business Address

                                                              Head Office

                                                              Office no. A 5010, fifth floor, Solitaire Business Hub, Near Phoenix mall, Pune, Maharashtra 411014

                                                              Contact Information

                                                              Craig Francis

                                                              Business Development Head

                                                              +17162654855

                                                              [email protected]

                                                              Connect With Us

                                                              Secure Payment Partners

                                                              payment image
                                                              RetailLogisticsPackagingAutomotiveHealthcareAgricultureEnergy & PowerFood & BeverageAerospace & DefenseChemicals & MaterialsHospitality and TourismAnimal Nutrition & WellnessConsumer Goods and ServicesReal Estate and ConstructionHome and Property ImprovementTechnology, Media and TelecomManufacturing Products and ServicesFinancial Services and Investment Intelligence

                                                              © 2025 All rights reserved


                                                              Privacy Policy
                                                              Terms and Conditions
                                                              FAQ