
Key Insights
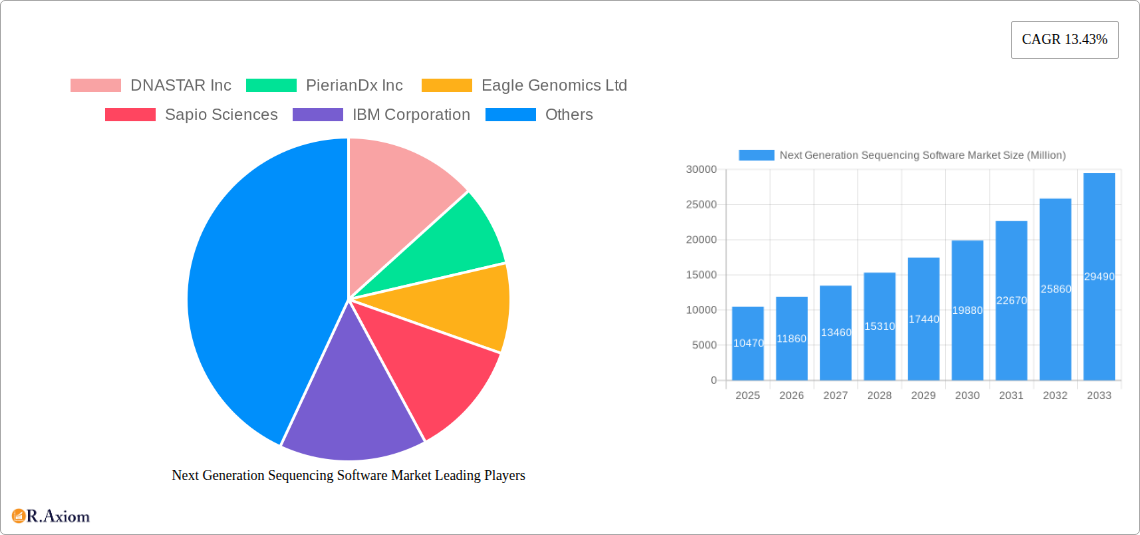
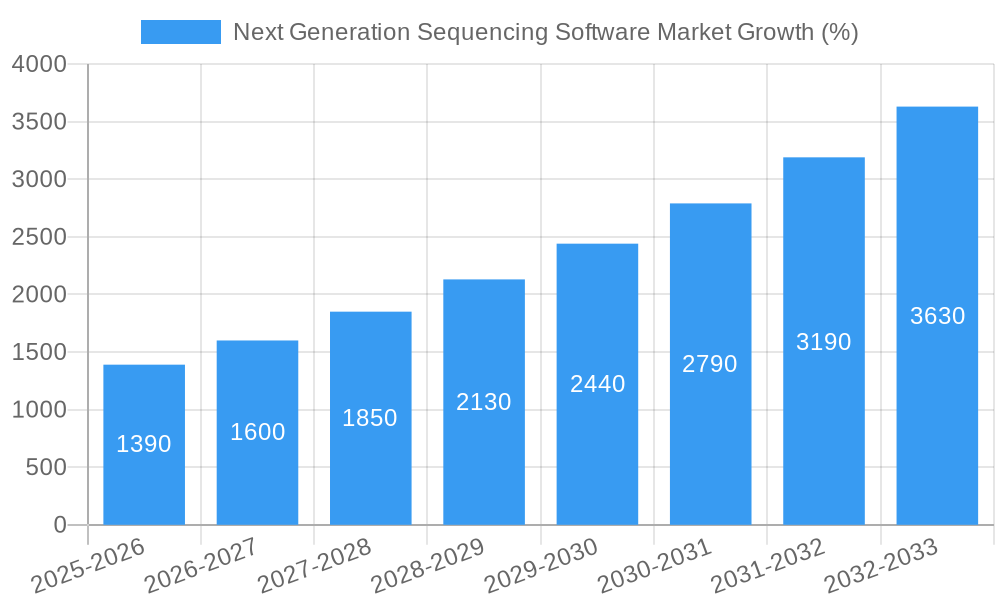
The Next Generation Sequencing (NGS) Software market is experiencing robust growth, projected to reach \$10.47 billion in 2025 and exhibiting a Compound Annual Growth Rate (CAGR) of 13.43% from 2025 to 2033. This expansion is driven by several key factors. The increasing adoption of NGS technologies across diverse applications, including drug discovery, genetic screening, and precision medicine, fuels significant demand for sophisticated software solutions. Hospitals and clinics are major end-users, leveraging NGS software for improved diagnostics and personalized treatment plans. Simultaneously, the burgeoning field of academic and research institutions fuels the need for advanced data analysis and management tools. Pharmaceutical companies are increasingly integrating NGS software into their drug development pipelines, accelerating the process and enhancing efficacy. The market is segmented by software type (NGS Informatics Services, Data Analysis and Management Tools, Data Interpretation and Reporting Tools) and application, creating specialized niche markets and opportunities for various vendors. The competitive landscape includes both established players like Illumina, Thermo Fisher Scientific, and Agilent Technologies, and emerging innovative companies focusing on niche applications. Continued technological advancements in NGS and the growing need for efficient data processing and analysis will further propel market growth.
The market's substantial growth is fueled by several trends. The increasing availability of high-throughput NGS data necessitates robust software to manage and analyze the large datasets effectively. The demand for cloud-based NGS software solutions is increasing due to scalability, accessibility, and cost-effectiveness. The rising focus on personalized medicine and precision oncology is driving demand for sophisticated analysis tools capable of identifying targeted therapeutic strategies. However, challenges remain. The high cost of NGS software, the complexity of data analysis, and the need for specialized training to effectively utilize these sophisticated tools can pose limitations. Furthermore, data security and privacy concerns related to genomic data require strong regulatory frameworks and robust security protocols within the software solutions, which itself is a driving force of innovation and market growth. Despite these restraints, the overall market outlook remains optimistic, driven by the transformative potential of NGS in various sectors.
This comprehensive report provides an in-depth analysis of the Next Generation Sequencing (NGS) Software market, offering actionable insights for stakeholders across the industry. Covering the period 2019-2033, with a base year of 2025, this report analyzes market dynamics, key players, and future growth potential. The report uses Million for all monetary values.
Next Generation Sequencing Software Market Concentration & Innovation
The NGS software market exhibits a moderately concentrated landscape, with a few major players holding significant market share. However, the market also features a considerable number of smaller, specialized companies offering niche solutions. The overall market concentration is estimated at xx% in 2025, with the top 5 players holding approximately xx% of the market. Innovation is a key driver, fueled by advancements in sequencing technologies, increasing demand for data analysis tools, and the growing need for personalized medicine. Regulatory frameworks, including data privacy regulations like GDPR and HIPAA, significantly influence market dynamics. The market sees continuous M&A activity, with deal values exceeding xx Million in the last 5 years. These acquisitions often involve larger companies integrating smaller companies with specialized software solutions. For example, the acquisition of xx by xx in 2023 resulted in xx Million market share increase for the acquirer.
- Market Share: Top 5 players hold approximately xx% in 2025.
- M&A Activity: Over xx Million in deal value over the past 5 years.
- Innovation Drivers: Advancements in sequencing technologies, personalized medicine needs, increased data volume.
- Regulatory Frameworks: GDPR, HIPAA, and other regional regulations shape market practices.
- End-User Trends: Shift towards cloud-based solutions and increased demand for AI-driven analytics.
Next Generation Sequencing Software Market Industry Trends & Insights
The NGS software market is experiencing robust growth, driven by factors such as the increasing adoption of NGS technologies in various applications like genomics research, drug discovery, and diagnostics. The market's Compound Annual Growth Rate (CAGR) is projected at xx% during the forecast period (2025-2033). Technological disruptions, such as the development of AI-powered analytics tools and cloud-based platforms, are transforming the market landscape. Consumer preferences are shifting towards user-friendly interfaces and integrated platforms offering comprehensive data analysis and reporting capabilities. Intense competition among established players and emerging startups is driving innovation and price pressures. Market penetration is expected to reach xx% by 2033, primarily driven by the increasing affordability of NGS technologies and the rising awareness about the benefits of personalized medicine.
Dominant Markets & Segments in Next Generation Sequencing Software Market
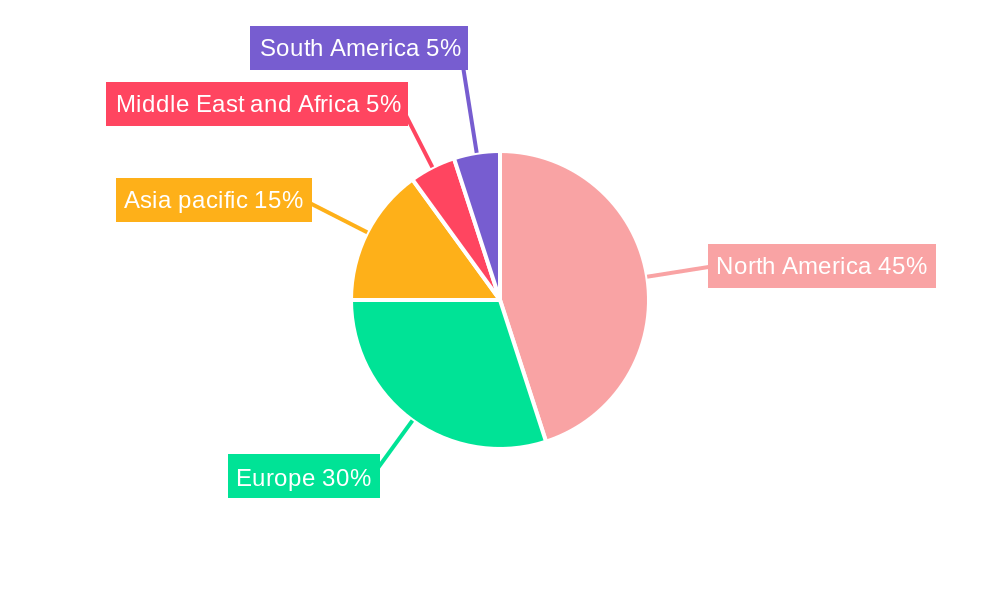
The North American region currently holds the largest market share, driven by robust research funding, advanced healthcare infrastructure, and early adoption of NGS technologies. Within the end-user segment, pharmaceutical companies represent the largest contributor to market revenue. The highest demand is observed in the Data Analysis and Management Tool segment and the precision medicine application.
- Leading Region: North America
- Dominant End User: Pharmaceutical Companies
- Largest Product Segment: Data Analysis and Management Tools
- Key Application: Precision Medicine
Key Drivers for Dominant Segments:
- Pharmaceutical Companies: High R&D budgets, focus on personalized medicine development.
- Data Analysis and Management Tools: Essential for handling the massive datasets generated by NGS.
- Precision Medicine: Growing demand for targeted therapies and diagnostics.
Next Generation Sequencing Software Market Product Developments
Recent product innovations include the development of user-friendly interfaces, integrated workflows, and AI-powered analytical capabilities that enhance data interpretation and reporting. These advancements are designed to improve the efficiency and accuracy of NGS data analysis, catering to the growing needs of researchers and clinicians. Cloud-based solutions and enhanced data visualization tools are gaining significant traction, driving the market's growth. The focus is on providing comprehensive solutions that streamline the entire NGS workflow, from data generation to interpretation and reporting.
Report Scope & Segmentation Analysis
This report segments the NGS software market by end-user (Hospitals and Clinics, Academics and Research Institutes, Pharmaceuticals Companies, Other End Users), products and services (NGS Informatics Services, Data Analysis and Management Tools, Data Interpretation and Reporting Tools: Primary and Secondary Data Analysis Tools), and applications (Drug Discovery, Genetic Screening, Precision Medicine, Other Applications). Each segment's growth projections, market size, and competitive dynamics are extensively analyzed. For instance, the Hospitals and Clinics segment is projected to grow at xx% CAGR during the forecast period, driven by the increasing adoption of NGS-based diagnostics. The Data Analysis and Management Tools segment is expected to dominate due to the ever-increasing volume of NGS data needing sophisticated management.
Key Drivers of Next Generation Sequencing Software Market Growth
The NGS software market is propelled by several factors, including technological advancements in sequencing technologies, increasing demand for personalized medicine, growing investments in genomics research, and supportive government initiatives. The falling cost of NGS sequencing is also a significant driver, making the technology more accessible to a wider range of users. Furthermore, the development of innovative analytical tools and the integration of AI and machine learning are enhancing the efficiency and accuracy of data analysis.
Challenges in the Next Generation Sequencing Software Market Sector
The market faces challenges such as the high cost of software licenses and maintenance, the need for specialized expertise in bioinformatics, the complexity of data analysis, and stringent regulatory requirements. Data security and privacy concerns also pose a significant challenge. Competition among numerous vendors also creates pricing pressures and necessitates continuous innovation to stay relevant. These factors collectively impact market penetration and profitability.
Emerging Opportunities in Next Generation Sequencing Software Market
Emerging opportunities include the growing adoption of cloud-based solutions, the increasing demand for AI-powered analytical tools, the development of specialized software for specific applications (e.g., oncology, infectious diseases), and the expansion into new geographical markets. The integration of NGS data with other -omics data (e.g., proteomics, metabolomics) presents significant growth potential. The market is also ripe for innovative approaches to data visualization and interpretation.
Leading Players in the Next Generation Sequencing Software Market Market
- DNASTAR Inc
- PierianDx Inc
- Eagle Genomics Ltd
- Sapio Sciences
- IBM Corporation
- Partek Incorporated
- F Hoffmann-La Roche Ltd
- Intrexon Bioinformatics Germany GmbH (Genomatix AG)
- Agilent Technologies Inc
- Dnanexus Inc
- Real Time Genomics Inc
- GENEWIZ Inc
- Thermo Fischer Scientific Inc
- Illumina Inc
- BIOVIA (Dassault Systemes)
- PerkinElmer Inc
- Qiagen NV
- Fabric Genomics Inc (Omicia Inc)
- SoftGenetics LLC
Key Developments in Next Generation Sequencing Software Market Industry
May 2022: NanoString Technologies, Inc. announced a seamless, cloud-based workflow improving spatial data analysis using Illumina NextSeq systems and the GeoMx Digital Spatial Profiler. This development significantly enhances the usability and efficiency of spatial genomics analysis.
March 2022: ARUP launched a new bioinformatics platform for faster NGS test results. This improved turnaround time for clinical diagnostics accelerates patient care.
Strategic Outlook for Next Generation Sequencing Software Market Market
The future of the NGS software market is bright, driven by continued technological advancements, the growing adoption of NGS in various fields, and the increasing demand for personalized medicine. The market is poised for significant expansion, with opportunities for both established players and new entrants to capitalize on emerging trends. Continuous innovation, strategic partnerships, and a focus on user-friendly solutions will be critical for success in this dynamic market.
Next Generation Sequencing Software Market Segmentation
-
1. Products and Services
- 1.1. NGS Informatics Services
-
1.2. Data Analysis and Management Tool
- 1.2.1. Storage and Computing Tool
- 1.2.2. Laboratory Information Management System (LIMS)
- 1.2.3. Data Interpretation and Reporting Tools
- 1.3. Primary and Secondary Data Analysis Tools
-
2. Application
- 2.1. Drug Discovery
- 2.2. Genetic Screening
- 2.3. Precision Medicine
- 2.4. Other Applications
-
3. End User
- 3.1. Hospitals and Clinics
- 3.2. Academics and Research Institutes
- 3.3. Pharmaceuticals Companies
- 3.4. Other End Users
Next Generation Sequencing Software Market Segmentation By Geography
-
1. North America
- 1.1. United States
- 1.2. Canada
- 1.3. Mexico
-
2. Europe
- 2.1. Germany
- 2.2. United Kingdom
- 2.3. France
- 2.4. Italy
- 2.5. Spain
- 2.6. Rest of Europe
-
3. Asia pacific
- 3.1. China
- 3.2. Japan
- 3.3. India
- 3.4. Australia
- 3.5. South Korea
- 3.6. Rest of Asia pacific
-
4. Middle East and Africa
- 4.1. GCC
- 4.2. South Africa
- 4.3. Rest of Middle East and Africa
-
5. South America
- 5.1. Brazil
- 5.2. Argentina
- 5.3. Rest of South America
Next Generation Sequencing Software Market REPORT HIGHLIGHTS
| Aspects | Details |
|---|---|
| Study Period | 2019-2033 |
| Base Year | 2024 |
| Estimated Year | 2025 |
| Forecast Period | 2025-2033 |
| Historical Period | 2019-2024 |
| Growth Rate | CAGR of 13.43% from 2019-2033 |
| Segmentation |
|
Table of Contents
- 1. Introduction
- 1.1. Research Scope
- 1.2. Market Segmentation
- 1.3. Research Methodology
- 1.4. Definitions and Assumptions
- 2. Executive Summary
- 2.1. Introduction
- 3. Market Dynamics
- 3.1. Introduction
- 3.2. Market Drivers
- 3.2.1. Increasing Clinical Applications of NGS; Technological Advancements in NGS Informatics Tools; Growing Preference toward Personalized Medicines and Early Disease Diagnosis; Increasing Demand for NGS Services and Rising Investment by Key Players
- 3.3. Market Restrains
- 3.3.1. Lack of Skilled Technicians for NGS Informatics Services; Challenges Associated with Data Storage and Integration
- 3.4. Market Trends
- 3.4.1 Genetic Screening Segment
- 3.4.2 by Application
- 3.4.3 is Expected to Experience the Fastest Growth in the Market
- 4. Market Factor Analysis
- 4.1. Porters Five Forces
- 4.2. Supply/Value Chain
- 4.3. PESTEL analysis
- 4.4. Market Entropy
- 4.5. Patent/Trademark Analysis
- 5. Global Next Generation Sequencing Software Market Analysis, Insights and Forecast, 2019-2031
- 5.1. Market Analysis, Insights and Forecast - by Products and Services
- 5.1.1. NGS Informatics Services
- 5.1.2. Data Analysis and Management Tool
- 5.1.2.1. Storage and Computing Tool
- 5.1.2.2. Laboratory Information Management System (LIMS)
- 5.1.2.3. Data Interpretation and Reporting Tools
- 5.1.3. Primary and Secondary Data Analysis Tools
- 5.2. Market Analysis, Insights and Forecast - by Application
- 5.2.1. Drug Discovery
- 5.2.2. Genetic Screening
- 5.2.3. Precision Medicine
- 5.2.4. Other Applications
- 5.3. Market Analysis, Insights and Forecast - by End User
- 5.3.1. Hospitals and Clinics
- 5.3.2. Academics and Research Institutes
- 5.3.3. Pharmaceuticals Companies
- 5.3.4. Other End Users
- 5.4. Market Analysis, Insights and Forecast - by Region
- 5.4.1. North America
- 5.4.2. Europe
- 5.4.3. Asia pacific
- 5.4.4. Middle East and Africa
- 5.4.5. South America
- 5.1. Market Analysis, Insights and Forecast - by Products and Services
- 6. North America Next Generation Sequencing Software Market Analysis, Insights and Forecast, 2019-2031
- 6.1. Market Analysis, Insights and Forecast - by Products and Services
- 6.1.1. NGS Informatics Services
- 6.1.2. Data Analysis and Management Tool
- 6.1.2.1. Storage and Computing Tool
- 6.1.2.2. Laboratory Information Management System (LIMS)
- 6.1.2.3. Data Interpretation and Reporting Tools
- 6.1.3. Primary and Secondary Data Analysis Tools
- 6.2. Market Analysis, Insights and Forecast - by Application
- 6.2.1. Drug Discovery
- 6.2.2. Genetic Screening
- 6.2.3. Precision Medicine
- 6.2.4. Other Applications
- 6.3. Market Analysis, Insights and Forecast - by End User
- 6.3.1. Hospitals and Clinics
- 6.3.2. Academics and Research Institutes
- 6.3.3. Pharmaceuticals Companies
- 6.3.4. Other End Users
- 6.1. Market Analysis, Insights and Forecast - by Products and Services
- 7. Europe Next Generation Sequencing Software Market Analysis, Insights and Forecast, 2019-2031
- 7.1. Market Analysis, Insights and Forecast - by Products and Services
- 7.1.1. NGS Informatics Services
- 7.1.2. Data Analysis and Management Tool
- 7.1.2.1. Storage and Computing Tool
- 7.1.2.2. Laboratory Information Management System (LIMS)
- 7.1.2.3. Data Interpretation and Reporting Tools
- 7.1.3. Primary and Secondary Data Analysis Tools
- 7.2. Market Analysis, Insights and Forecast - by Application
- 7.2.1. Drug Discovery
- 7.2.2. Genetic Screening
- 7.2.3. Precision Medicine
- 7.2.4. Other Applications
- 7.3. Market Analysis, Insights and Forecast - by End User
- 7.3.1. Hospitals and Clinics
- 7.3.2. Academics and Research Institutes
- 7.3.3. Pharmaceuticals Companies
- 7.3.4. Other End Users
- 7.1. Market Analysis, Insights and Forecast - by Products and Services
- 8. Asia pacific Next Generation Sequencing Software Market Analysis, Insights and Forecast, 2019-2031
- 8.1. Market Analysis, Insights and Forecast - by Products and Services
- 8.1.1. NGS Informatics Services
- 8.1.2. Data Analysis and Management Tool
- 8.1.2.1. Storage and Computing Tool
- 8.1.2.2. Laboratory Information Management System (LIMS)
- 8.1.2.3. Data Interpretation and Reporting Tools
- 8.1.3. Primary and Secondary Data Analysis Tools
- 8.2. Market Analysis, Insights and Forecast - by Application
- 8.2.1. Drug Discovery
- 8.2.2. Genetic Screening
- 8.2.3. Precision Medicine
- 8.2.4. Other Applications
- 8.3. Market Analysis, Insights and Forecast - by End User
- 8.3.1. Hospitals and Clinics
- 8.3.2. Academics and Research Institutes
- 8.3.3. Pharmaceuticals Companies
- 8.3.4. Other End Users
- 8.1. Market Analysis, Insights and Forecast - by Products and Services
- 9. Middle East and Africa Next Generation Sequencing Software Market Analysis, Insights and Forecast, 2019-2031
- 9.1. Market Analysis, Insights and Forecast - by Products and Services
- 9.1.1. NGS Informatics Services
- 9.1.2. Data Analysis and Management Tool
- 9.1.2.1. Storage and Computing Tool
- 9.1.2.2. Laboratory Information Management System (LIMS)
- 9.1.2.3. Data Interpretation and Reporting Tools
- 9.1.3. Primary and Secondary Data Analysis Tools
- 9.2. Market Analysis, Insights and Forecast - by Application
- 9.2.1. Drug Discovery
- 9.2.2. Genetic Screening
- 9.2.3. Precision Medicine
- 9.2.4. Other Applications
- 9.3. Market Analysis, Insights and Forecast - by End User
- 9.3.1. Hospitals and Clinics
- 9.3.2. Academics and Research Institutes
- 9.3.3. Pharmaceuticals Companies
- 9.3.4. Other End Users
- 9.1. Market Analysis, Insights and Forecast - by Products and Services
- 10. South America Next Generation Sequencing Software Market Analysis, Insights and Forecast, 2019-2031
- 10.1. Market Analysis, Insights and Forecast - by Products and Services
- 10.1.1. NGS Informatics Services
- 10.1.2. Data Analysis and Management Tool
- 10.1.2.1. Storage and Computing Tool
- 10.1.2.2. Laboratory Information Management System (LIMS)
- 10.1.2.3. Data Interpretation and Reporting Tools
- 10.1.3. Primary and Secondary Data Analysis Tools
- 10.2. Market Analysis, Insights and Forecast - by Application
- 10.2.1. Drug Discovery
- 10.2.2. Genetic Screening
- 10.2.3. Precision Medicine
- 10.2.4. Other Applications
- 10.3. Market Analysis, Insights and Forecast - by End User
- 10.3.1. Hospitals and Clinics
- 10.3.2. Academics and Research Institutes
- 10.3.3. Pharmaceuticals Companies
- 10.3.4. Other End Users
- 10.1. Market Analysis, Insights and Forecast - by Products and Services
- 11. North America Next Generation Sequencing Software Market Analysis, Insights and Forecast, 2019-2031
- 11.1. Market Analysis, Insights and Forecast - By Country/Sub-region
- 11.1.1 United States
- 11.1.2 Canada
- 11.1.3 Mexico
- 12. Europe Next Generation Sequencing Software Market Analysis, Insights and Forecast, 2019-2031
- 12.1. Market Analysis, Insights and Forecast - By Country/Sub-region
- 12.1.1 Germany
- 12.1.2 United Kingdom
- 12.1.3 France
- 12.1.4 Italy
- 12.1.5 Spain
- 12.1.6 Rest of Europe
- 13. Asia pacific Next Generation Sequencing Software Market Analysis, Insights and Forecast, 2019-2031
- 13.1. Market Analysis, Insights and Forecast - By Country/Sub-region
- 13.1.1 China
- 13.1.2 Japan
- 13.1.3 India
- 13.1.4 Australia
- 13.1.5 South Korea
- 13.1.6 Rest of Asia pacific
- 14. Middle East and Africa Next Generation Sequencing Software Market Analysis, Insights and Forecast, 2019-2031
- 14.1. Market Analysis, Insights and Forecast - By Country/Sub-region
- 14.1.1 GCC
- 14.1.2 South Africa
- 14.1.3 Rest of Middle East and Africa
- 15. South America Next Generation Sequencing Software Market Analysis, Insights and Forecast, 2019-2031
- 15.1. Market Analysis, Insights and Forecast - By Country/Sub-region
- 15.1.1 Brazil
- 15.1.2 Argentina
- 15.1.3 Rest of South America
- 16. Competitive Analysis
- 16.1. Global Market Share Analysis 2024
- 16.2. Company Profiles
- 16.2.1 DNASTAR Inc
- 16.2.1.1. Overview
- 16.2.1.2. Products
- 16.2.1.3. SWOT Analysis
- 16.2.1.4. Recent Developments
- 16.2.1.5. Financials (Based on Availability)
- 16.2.2 PierianDx Inc
- 16.2.2.1. Overview
- 16.2.2.2. Products
- 16.2.2.3. SWOT Analysis
- 16.2.2.4. Recent Developments
- 16.2.2.5. Financials (Based on Availability)
- 16.2.3 Eagle Genomics Ltd
- 16.2.3.1. Overview
- 16.2.3.2. Products
- 16.2.3.3. SWOT Analysis
- 16.2.3.4. Recent Developments
- 16.2.3.5. Financials (Based on Availability)
- 16.2.4 Sapio Sciences
- 16.2.4.1. Overview
- 16.2.4.2. Products
- 16.2.4.3. SWOT Analysis
- 16.2.4.4. Recent Developments
- 16.2.4.5. Financials (Based on Availability)
- 16.2.5 IBM Corporation
- 16.2.5.1. Overview
- 16.2.5.2. Products
- 16.2.5.3. SWOT Analysis
- 16.2.5.4. Recent Developments
- 16.2.5.5. Financials (Based on Availability)
- 16.2.6 Partek Incorporated
- 16.2.6.1. Overview
- 16.2.6.2. Products
- 16.2.6.3. SWOT Analysis
- 16.2.6.4. Recent Developments
- 16.2.6.5. Financials (Based on Availability)
- 16.2.7 F Hoffmann-La Roche Ltd
- 16.2.7.1. Overview
- 16.2.7.2. Products
- 16.2.7.3. SWOT Analysis
- 16.2.7.4. Recent Developments
- 16.2.7.5. Financials (Based on Availability)
- 16.2.8 Intrexon Bioinformatics Germany GmbH (Genomatix AG)
- 16.2.8.1. Overview
- 16.2.8.2. Products
- 16.2.8.3. SWOT Analysis
- 16.2.8.4. Recent Developments
- 16.2.8.5. Financials (Based on Availability)
- 16.2.9 Agilent Technologies Inc
- 16.2.9.1. Overview
- 16.2.9.2. Products
- 16.2.9.3. SWOT Analysis
- 16.2.9.4. Recent Developments
- 16.2.9.5. Financials (Based on Availability)
- 16.2.10 Dnanexus Inc
- 16.2.10.1. Overview
- 16.2.10.2. Products
- 16.2.10.3. SWOT Analysis
- 16.2.10.4. Recent Developments
- 16.2.10.5. Financials (Based on Availability)
- 16.2.11 Real Time Genomics Inc
- 16.2.11.1. Overview
- 16.2.11.2. Products
- 16.2.11.3. SWOT Analysis
- 16.2.11.4. Recent Developments
- 16.2.11.5. Financials (Based on Availability)
- 16.2.12 GENEWIZ Inc
- 16.2.12.1. Overview
- 16.2.12.2. Products
- 16.2.12.3. SWOT Analysis
- 16.2.12.4. Recent Developments
- 16.2.12.5. Financials (Based on Availability)
- 16.2.13 Thermo Fischer Scientific Inc
- 16.2.13.1. Overview
- 16.2.13.2. Products
- 16.2.13.3. SWOT Analysis
- 16.2.13.4. Recent Developments
- 16.2.13.5. Financials (Based on Availability)
- 16.2.14 llumina Inc
- 16.2.14.1. Overview
- 16.2.14.2. Products
- 16.2.14.3. SWOT Analysis
- 16.2.14.4. Recent Developments
- 16.2.14.5. Financials (Based on Availability)
- 16.2.15 BIOVIA(Dassault Systemes)
- 16.2.15.1. Overview
- 16.2.15.2. Products
- 16.2.15.3. SWOT Analysis
- 16.2.15.4. Recent Developments
- 16.2.15.5. Financials (Based on Availability)
- 16.2.16 PerkinElmer Inc
- 16.2.16.1. Overview
- 16.2.16.2. Products
- 16.2.16.3. SWOT Analysis
- 16.2.16.4. Recent Developments
- 16.2.16.5. Financials (Based on Availability)
- 16.2.17 Qiagen NV
- 16.2.17.1. Overview
- 16.2.17.2. Products
- 16.2.17.3. SWOT Analysis
- 16.2.17.4. Recent Developments
- 16.2.17.5. Financials (Based on Availability)
- 16.2.18 Fabric Genomics Inc (Omicia Inc )
- 16.2.18.1. Overview
- 16.2.18.2. Products
- 16.2.18.3. SWOT Analysis
- 16.2.18.4. Recent Developments
- 16.2.18.5. Financials (Based on Availability)
- 16.2.19 SoftGenetics LLC
- 16.2.19.1. Overview
- 16.2.19.2. Products
- 16.2.19.3. SWOT Analysis
- 16.2.19.4. Recent Developments
- 16.2.19.5. Financials (Based on Availability)
- 16.2.1 DNASTAR Inc
List of Figures
- Figure 1: Global Next Generation Sequencing Software Market Revenue Breakdown (Million, %) by Region 2024 & 2032
- Figure 2: Global Next Generation Sequencing Software Market Volume Breakdown (K Unit, %) by Region 2024 & 2032
- Figure 3: North America Next Generation Sequencing Software Market Revenue (Million), by Country 2024 & 2032
- Figure 4: North America Next Generation Sequencing Software Market Volume (K Unit), by Country 2024 & 2032
- Figure 5: North America Next Generation Sequencing Software Market Revenue Share (%), by Country 2024 & 2032
- Figure 6: North America Next Generation Sequencing Software Market Volume Share (%), by Country 2024 & 2032
- Figure 7: Europe Next Generation Sequencing Software Market Revenue (Million), by Country 2024 & 2032
- Figure 8: Europe Next Generation Sequencing Software Market Volume (K Unit), by Country 2024 & 2032
- Figure 9: Europe Next Generation Sequencing Software Market Revenue Share (%), by Country 2024 & 2032
- Figure 10: Europe Next Generation Sequencing Software Market Volume Share (%), by Country 2024 & 2032
- Figure 11: Asia pacific Next Generation Sequencing Software Market Revenue (Million), by Country 2024 & 2032
- Figure 12: Asia pacific Next Generation Sequencing Software Market Volume (K Unit), by Country 2024 & 2032
- Figure 13: Asia pacific Next Generation Sequencing Software Market Revenue Share (%), by Country 2024 & 2032
- Figure 14: Asia pacific Next Generation Sequencing Software Market Volume Share (%), by Country 2024 & 2032
- Figure 15: Middle East and Africa Next Generation Sequencing Software Market Revenue (Million), by Country 2024 & 2032
- Figure 16: Middle East and Africa Next Generation Sequencing Software Market Volume (K Unit), by Country 2024 & 2032
- Figure 17: Middle East and Africa Next Generation Sequencing Software Market Revenue Share (%), by Country 2024 & 2032
- Figure 18: Middle East and Africa Next Generation Sequencing Software Market Volume Share (%), by Country 2024 & 2032
- Figure 19: South America Next Generation Sequencing Software Market Revenue (Million), by Country 2024 & 2032
- Figure 20: South America Next Generation Sequencing Software Market Volume (K Unit), by Country 2024 & 2032
- Figure 21: South America Next Generation Sequencing Software Market Revenue Share (%), by Country 2024 & 2032
- Figure 22: South America Next Generation Sequencing Software Market Volume Share (%), by Country 2024 & 2032
- Figure 23: North America Next Generation Sequencing Software Market Revenue (Million), by Products and Services 2024 & 2032
- Figure 24: North America Next Generation Sequencing Software Market Volume (K Unit), by Products and Services 2024 & 2032
- Figure 25: North America Next Generation Sequencing Software Market Revenue Share (%), by Products and Services 2024 & 2032
- Figure 26: North America Next Generation Sequencing Software Market Volume Share (%), by Products and Services 2024 & 2032
- Figure 27: North America Next Generation Sequencing Software Market Revenue (Million), by Application 2024 & 2032
- Figure 28: North America Next Generation Sequencing Software Market Volume (K Unit), by Application 2024 & 2032
- Figure 29: North America Next Generation Sequencing Software Market Revenue Share (%), by Application 2024 & 2032
- Figure 30: North America Next Generation Sequencing Software Market Volume Share (%), by Application 2024 & 2032
- Figure 31: North America Next Generation Sequencing Software Market Revenue (Million), by End User 2024 & 2032
- Figure 32: North America Next Generation Sequencing Software Market Volume (K Unit), by End User 2024 & 2032
- Figure 33: North America Next Generation Sequencing Software Market Revenue Share (%), by End User 2024 & 2032
- Figure 34: North America Next Generation Sequencing Software Market Volume Share (%), by End User 2024 & 2032
- Figure 35: North America Next Generation Sequencing Software Market Revenue (Million), by Country 2024 & 2032
- Figure 36: North America Next Generation Sequencing Software Market Volume (K Unit), by Country 2024 & 2032
- Figure 37: North America Next Generation Sequencing Software Market Revenue Share (%), by Country 2024 & 2032
- Figure 38: North America Next Generation Sequencing Software Market Volume Share (%), by Country 2024 & 2032
- Figure 39: Europe Next Generation Sequencing Software Market Revenue (Million), by Products and Services 2024 & 2032
- Figure 40: Europe Next Generation Sequencing Software Market Volume (K Unit), by Products and Services 2024 & 2032
- Figure 41: Europe Next Generation Sequencing Software Market Revenue Share (%), by Products and Services 2024 & 2032
- Figure 42: Europe Next Generation Sequencing Software Market Volume Share (%), by Products and Services 2024 & 2032
- Figure 43: Europe Next Generation Sequencing Software Market Revenue (Million), by Application 2024 & 2032
- Figure 44: Europe Next Generation Sequencing Software Market Volume (K Unit), by Application 2024 & 2032
- Figure 45: Europe Next Generation Sequencing Software Market Revenue Share (%), by Application 2024 & 2032
- Figure 46: Europe Next Generation Sequencing Software Market Volume Share (%), by Application 2024 & 2032
- Figure 47: Europe Next Generation Sequencing Software Market Revenue (Million), by End User 2024 & 2032
- Figure 48: Europe Next Generation Sequencing Software Market Volume (K Unit), by End User 2024 & 2032
- Figure 49: Europe Next Generation Sequencing Software Market Revenue Share (%), by End User 2024 & 2032
- Figure 50: Europe Next Generation Sequencing Software Market Volume Share (%), by End User 2024 & 2032
- Figure 51: Europe Next Generation Sequencing Software Market Revenue (Million), by Country 2024 & 2032
- Figure 52: Europe Next Generation Sequencing Software Market Volume (K Unit), by Country 2024 & 2032
- Figure 53: Europe Next Generation Sequencing Software Market Revenue Share (%), by Country 2024 & 2032
- Figure 54: Europe Next Generation Sequencing Software Market Volume Share (%), by Country 2024 & 2032
- Figure 55: Asia pacific Next Generation Sequencing Software Market Revenue (Million), by Products and Services 2024 & 2032
- Figure 56: Asia pacific Next Generation Sequencing Software Market Volume (K Unit), by Products and Services 2024 & 2032
- Figure 57: Asia pacific Next Generation Sequencing Software Market Revenue Share (%), by Products and Services 2024 & 2032
- Figure 58: Asia pacific Next Generation Sequencing Software Market Volume Share (%), by Products and Services 2024 & 2032
- Figure 59: Asia pacific Next Generation Sequencing Software Market Revenue (Million), by Application 2024 & 2032
- Figure 60: Asia pacific Next Generation Sequencing Software Market Volume (K Unit), by Application 2024 & 2032
- Figure 61: Asia pacific Next Generation Sequencing Software Market Revenue Share (%), by Application 2024 & 2032
- Figure 62: Asia pacific Next Generation Sequencing Software Market Volume Share (%), by Application 2024 & 2032
- Figure 63: Asia pacific Next Generation Sequencing Software Market Revenue (Million), by End User 2024 & 2032
- Figure 64: Asia pacific Next Generation Sequencing Software Market Volume (K Unit), by End User 2024 & 2032
- Figure 65: Asia pacific Next Generation Sequencing Software Market Revenue Share (%), by End User 2024 & 2032
- Figure 66: Asia pacific Next Generation Sequencing Software Market Volume Share (%), by End User 2024 & 2032
- Figure 67: Asia pacific Next Generation Sequencing Software Market Revenue (Million), by Country 2024 & 2032
- Figure 68: Asia pacific Next Generation Sequencing Software Market Volume (K Unit), by Country 2024 & 2032
- Figure 69: Asia pacific Next Generation Sequencing Software Market Revenue Share (%), by Country 2024 & 2032
- Figure 70: Asia pacific Next Generation Sequencing Software Market Volume Share (%), by Country 2024 & 2032
- Figure 71: Middle East and Africa Next Generation Sequencing Software Market Revenue (Million), by Products and Services 2024 & 2032
- Figure 72: Middle East and Africa Next Generation Sequencing Software Market Volume (K Unit), by Products and Services 2024 & 2032
- Figure 73: Middle East and Africa Next Generation Sequencing Software Market Revenue Share (%), by Products and Services 2024 & 2032
- Figure 74: Middle East and Africa Next Generation Sequencing Software Market Volume Share (%), by Products and Services 2024 & 2032
- Figure 75: Middle East and Africa Next Generation Sequencing Software Market Revenue (Million), by Application 2024 & 2032
- Figure 76: Middle East and Africa Next Generation Sequencing Software Market Volume (K Unit), by Application 2024 & 2032
- Figure 77: Middle East and Africa Next Generation Sequencing Software Market Revenue Share (%), by Application 2024 & 2032
- Figure 78: Middle East and Africa Next Generation Sequencing Software Market Volume Share (%), by Application 2024 & 2032
- Figure 79: Middle East and Africa Next Generation Sequencing Software Market Revenue (Million), by End User 2024 & 2032
- Figure 80: Middle East and Africa Next Generation Sequencing Software Market Volume (K Unit), by End User 2024 & 2032
- Figure 81: Middle East and Africa Next Generation Sequencing Software Market Revenue Share (%), by End User 2024 & 2032
- Figure 82: Middle East and Africa Next Generation Sequencing Software Market Volume Share (%), by End User 2024 & 2032
- Figure 83: Middle East and Africa Next Generation Sequencing Software Market Revenue (Million), by Country 2024 & 2032
- Figure 84: Middle East and Africa Next Generation Sequencing Software Market Volume (K Unit), by Country 2024 & 2032
- Figure 85: Middle East and Africa Next Generation Sequencing Software Market Revenue Share (%), by Country 2024 & 2032
- Figure 86: Middle East and Africa Next Generation Sequencing Software Market Volume Share (%), by Country 2024 & 2032
- Figure 87: South America Next Generation Sequencing Software Market Revenue (Million), by Products and Services 2024 & 2032
- Figure 88: South America Next Generation Sequencing Software Market Volume (K Unit), by Products and Services 2024 & 2032
- Figure 89: South America Next Generation Sequencing Software Market Revenue Share (%), by Products and Services 2024 & 2032
- Figure 90: South America Next Generation Sequencing Software Market Volume Share (%), by Products and Services 2024 & 2032
- Figure 91: South America Next Generation Sequencing Software Market Revenue (Million), by Application 2024 & 2032
- Figure 92: South America Next Generation Sequencing Software Market Volume (K Unit), by Application 2024 & 2032
- Figure 93: South America Next Generation Sequencing Software Market Revenue Share (%), by Application 2024 & 2032
- Figure 94: South America Next Generation Sequencing Software Market Volume Share (%), by Application 2024 & 2032
- Figure 95: South America Next Generation Sequencing Software Market Revenue (Million), by End User 2024 & 2032
- Figure 96: South America Next Generation Sequencing Software Market Volume (K Unit), by End User 2024 & 2032
- Figure 97: South America Next Generation Sequencing Software Market Revenue Share (%), by End User 2024 & 2032
- Figure 98: South America Next Generation Sequencing Software Market Volume Share (%), by End User 2024 & 2032
- Figure 99: South America Next Generation Sequencing Software Market Revenue (Million), by Country 2024 & 2032
- Figure 100: South America Next Generation Sequencing Software Market Volume (K Unit), by Country 2024 & 2032
- Figure 101: South America Next Generation Sequencing Software Market Revenue Share (%), by Country 2024 & 2032
- Figure 102: South America Next Generation Sequencing Software Market Volume Share (%), by Country 2024 & 2032
List of Tables
- Table 1: Global Next Generation Sequencing Software Market Revenue Million Forecast, by Region 2019 & 2032
- Table 2: Global Next Generation Sequencing Software Market Volume K Unit Forecast, by Region 2019 & 2032
- Table 3: Global Next Generation Sequencing Software Market Revenue Million Forecast, by Products and Services 2019 & 2032
- Table 4: Global Next Generation Sequencing Software Market Volume K Unit Forecast, by Products and Services 2019 & 2032
- Table 5: Global Next Generation Sequencing Software Market Revenue Million Forecast, by Application 2019 & 2032
- Table 6: Global Next Generation Sequencing Software Market Volume K Unit Forecast, by Application 2019 & 2032
- Table 7: Global Next Generation Sequencing Software Market Revenue Million Forecast, by End User 2019 & 2032
- Table 8: Global Next Generation Sequencing Software Market Volume K Unit Forecast, by End User 2019 & 2032
- Table 9: Global Next Generation Sequencing Software Market Revenue Million Forecast, by Region 2019 & 2032
- Table 10: Global Next Generation Sequencing Software Market Volume K Unit Forecast, by Region 2019 & 2032
- Table 11: Global Next Generation Sequencing Software Market Revenue Million Forecast, by Country 2019 & 2032
- Table 12: Global Next Generation Sequencing Software Market Volume K Unit Forecast, by Country 2019 & 2032
- Table 13: United States Next Generation Sequencing Software Market Revenue (Million) Forecast, by Application 2019 & 2032
- Table 14: United States Next Generation Sequencing Software Market Volume (K Unit) Forecast, by Application 2019 & 2032
- Table 15: Canada Next Generation Sequencing Software Market Revenue (Million) Forecast, by Application 2019 & 2032
- Table 16: Canada Next Generation Sequencing Software Market Volume (K Unit) Forecast, by Application 2019 & 2032
- Table 17: Mexico Next Generation Sequencing Software Market Revenue (Million) Forecast, by Application 2019 & 2032
- Table 18: Mexico Next Generation Sequencing Software Market Volume (K Unit) Forecast, by Application 2019 & 2032
- Table 19: Global Next Generation Sequencing Software Market Revenue Million Forecast, by Country 2019 & 2032
- Table 20: Global Next Generation Sequencing Software Market Volume K Unit Forecast, by Country 2019 & 2032
- Table 21: Germany Next Generation Sequencing Software Market Revenue (Million) Forecast, by Application 2019 & 2032
- Table 22: Germany Next Generation Sequencing Software Market Volume (K Unit) Forecast, by Application 2019 & 2032
- Table 23: United Kingdom Next Generation Sequencing Software Market Revenue (Million) Forecast, by Application 2019 & 2032
- Table 24: United Kingdom Next Generation Sequencing Software Market Volume (K Unit) Forecast, by Application 2019 & 2032
- Table 25: France Next Generation Sequencing Software Market Revenue (Million) Forecast, by Application 2019 & 2032
- Table 26: France Next Generation Sequencing Software Market Volume (K Unit) Forecast, by Application 2019 & 2032
- Table 27: Italy Next Generation Sequencing Software Market Revenue (Million) Forecast, by Application 2019 & 2032
- Table 28: Italy Next Generation Sequencing Software Market Volume (K Unit) Forecast, by Application 2019 & 2032
- Table 29: Spain Next Generation Sequencing Software Market Revenue (Million) Forecast, by Application 2019 & 2032
- Table 30: Spain Next Generation Sequencing Software Market Volume (K Unit) Forecast, by Application 2019 & 2032
- Table 31: Rest of Europe Next Generation Sequencing Software Market Revenue (Million) Forecast, by Application 2019 & 2032
- Table 32: Rest of Europe Next Generation Sequencing Software Market Volume (K Unit) Forecast, by Application 2019 & 2032
- Table 33: Global Next Generation Sequencing Software Market Revenue Million Forecast, by Country 2019 & 2032
- Table 34: Global Next Generation Sequencing Software Market Volume K Unit Forecast, by Country 2019 & 2032
- Table 35: China Next Generation Sequencing Software Market Revenue (Million) Forecast, by Application 2019 & 2032
- Table 36: China Next Generation Sequencing Software Market Volume (K Unit) Forecast, by Application 2019 & 2032
- Table 37: Japan Next Generation Sequencing Software Market Revenue (Million) Forecast, by Application 2019 & 2032
- Table 38: Japan Next Generation Sequencing Software Market Volume (K Unit) Forecast, by Application 2019 & 2032
- Table 39: India Next Generation Sequencing Software Market Revenue (Million) Forecast, by Application 2019 & 2032
- Table 40: India Next Generation Sequencing Software Market Volume (K Unit) Forecast, by Application 2019 & 2032
- Table 41: Australia Next Generation Sequencing Software Market Revenue (Million) Forecast, by Application 2019 & 2032
- Table 42: Australia Next Generation Sequencing Software Market Volume (K Unit) Forecast, by Application 2019 & 2032
- Table 43: South Korea Next Generation Sequencing Software Market Revenue (Million) Forecast, by Application 2019 & 2032
- Table 44: South Korea Next Generation Sequencing Software Market Volume (K Unit) Forecast, by Application 2019 & 2032
- Table 45: Rest of Asia pacific Next Generation Sequencing Software Market Revenue (Million) Forecast, by Application 2019 & 2032
- Table 46: Rest of Asia pacific Next Generation Sequencing Software Market Volume (K Unit) Forecast, by Application 2019 & 2032
- Table 47: Global Next Generation Sequencing Software Market Revenue Million Forecast, by Country 2019 & 2032
- Table 48: Global Next Generation Sequencing Software Market Volume K Unit Forecast, by Country 2019 & 2032
- Table 49: GCC Next Generation Sequencing Software Market Revenue (Million) Forecast, by Application 2019 & 2032
- Table 50: GCC Next Generation Sequencing Software Market Volume (K Unit) Forecast, by Application 2019 & 2032
- Table 51: South Africa Next Generation Sequencing Software Market Revenue (Million) Forecast, by Application 2019 & 2032
- Table 52: South Africa Next Generation Sequencing Software Market Volume (K Unit) Forecast, by Application 2019 & 2032
- Table 53: Rest of Middle East and Africa Next Generation Sequencing Software Market Revenue (Million) Forecast, by Application 2019 & 2032
- Table 54: Rest of Middle East and Africa Next Generation Sequencing Software Market Volume (K Unit) Forecast, by Application 2019 & 2032
- Table 55: Global Next Generation Sequencing Software Market Revenue Million Forecast, by Country 2019 & 2032
- Table 56: Global Next Generation Sequencing Software Market Volume K Unit Forecast, by Country 2019 & 2032
- Table 57: Brazil Next Generation Sequencing Software Market Revenue (Million) Forecast, by Application 2019 & 2032
- Table 58: Brazil Next Generation Sequencing Software Market Volume (K Unit) Forecast, by Application 2019 & 2032
- Table 59: Argentina Next Generation Sequencing Software Market Revenue (Million) Forecast, by Application 2019 & 2032
- Table 60: Argentina Next Generation Sequencing Software Market Volume (K Unit) Forecast, by Application 2019 & 2032
- Table 61: Rest of South America Next Generation Sequencing Software Market Revenue (Million) Forecast, by Application 2019 & 2032
- Table 62: Rest of South America Next Generation Sequencing Software Market Volume (K Unit) Forecast, by Application 2019 & 2032
- Table 63: Global Next Generation Sequencing Software Market Revenue Million Forecast, by Products and Services 2019 & 2032
- Table 64: Global Next Generation Sequencing Software Market Volume K Unit Forecast, by Products and Services 2019 & 2032
- Table 65: Global Next Generation Sequencing Software Market Revenue Million Forecast, by Application 2019 & 2032
- Table 66: Global Next Generation Sequencing Software Market Volume K Unit Forecast, by Application 2019 & 2032
- Table 67: Global Next Generation Sequencing Software Market Revenue Million Forecast, by End User 2019 & 2032
- Table 68: Global Next Generation Sequencing Software Market Volume K Unit Forecast, by End User 2019 & 2032
- Table 69: Global Next Generation Sequencing Software Market Revenue Million Forecast, by Country 2019 & 2032
- Table 70: Global Next Generation Sequencing Software Market Volume K Unit Forecast, by Country 2019 & 2032
- Table 71: United States Next Generation Sequencing Software Market Revenue (Million) Forecast, by Application 2019 & 2032
- Table 72: United States Next Generation Sequencing Software Market Volume (K Unit) Forecast, by Application 2019 & 2032
- Table 73: Canada Next Generation Sequencing Software Market Revenue (Million) Forecast, by Application 2019 & 2032
- Table 74: Canada Next Generation Sequencing Software Market Volume (K Unit) Forecast, by Application 2019 & 2032
- Table 75: Mexico Next Generation Sequencing Software Market Revenue (Million) Forecast, by Application 2019 & 2032
- Table 76: Mexico Next Generation Sequencing Software Market Volume (K Unit) Forecast, by Application 2019 & 2032
- Table 77: Global Next Generation Sequencing Software Market Revenue Million Forecast, by Products and Services 2019 & 2032
- Table 78: Global Next Generation Sequencing Software Market Volume K Unit Forecast, by Products and Services 2019 & 2032
- Table 79: Global Next Generation Sequencing Software Market Revenue Million Forecast, by Application 2019 & 2032
- Table 80: Global Next Generation Sequencing Software Market Volume K Unit Forecast, by Application 2019 & 2032
- Table 81: Global Next Generation Sequencing Software Market Revenue Million Forecast, by End User 2019 & 2032
- Table 82: Global Next Generation Sequencing Software Market Volume K Unit Forecast, by End User 2019 & 2032
- Table 83: Global Next Generation Sequencing Software Market Revenue Million Forecast, by Country 2019 & 2032
- Table 84: Global Next Generation Sequencing Software Market Volume K Unit Forecast, by Country 2019 & 2032
- Table 85: Germany Next Generation Sequencing Software Market Revenue (Million) Forecast, by Application 2019 & 2032
- Table 86: Germany Next Generation Sequencing Software Market Volume (K Unit) Forecast, by Application 2019 & 2032
- Table 87: United Kingdom Next Generation Sequencing Software Market Revenue (Million) Forecast, by Application 2019 & 2032
- Table 88: United Kingdom Next Generation Sequencing Software Market Volume (K Unit) Forecast, by Application 2019 & 2032
- Table 89: France Next Generation Sequencing Software Market Revenue (Million) Forecast, by Application 2019 & 2032
- Table 90: France Next Generation Sequencing Software Market Volume (K Unit) Forecast, by Application 2019 & 2032
- Table 91: Italy Next Generation Sequencing Software Market Revenue (Million) Forecast, by Application 2019 & 2032
- Table 92: Italy Next Generation Sequencing Software Market Volume (K Unit) Forecast, by Application 2019 & 2032
- Table 93: Spain Next Generation Sequencing Software Market Revenue (Million) Forecast, by Application 2019 & 2032
- Table 94: Spain Next Generation Sequencing Software Market Volume (K Unit) Forecast, by Application 2019 & 2032
- Table 95: Rest of Europe Next Generation Sequencing Software Market Revenue (Million) Forecast, by Application 2019 & 2032
- Table 96: Rest of Europe Next Generation Sequencing Software Market Volume (K Unit) Forecast, by Application 2019 & 2032
- Table 97: Global Next Generation Sequencing Software Market Revenue Million Forecast, by Products and Services 2019 & 2032
- Table 98: Global Next Generation Sequencing Software Market Volume K Unit Forecast, by Products and Services 2019 & 2032
- Table 99: Global Next Generation Sequencing Software Market Revenue Million Forecast, by Application 2019 & 2032
- Table 100: Global Next Generation Sequencing Software Market Volume K Unit Forecast, by Application 2019 & 2032
- Table 101: Global Next Generation Sequencing Software Market Revenue Million Forecast, by End User 2019 & 2032
- Table 102: Global Next Generation Sequencing Software Market Volume K Unit Forecast, by End User 2019 & 2032
- Table 103: Global Next Generation Sequencing Software Market Revenue Million Forecast, by Country 2019 & 2032
- Table 104: Global Next Generation Sequencing Software Market Volume K Unit Forecast, by Country 2019 & 2032
- Table 105: China Next Generation Sequencing Software Market Revenue (Million) Forecast, by Application 2019 & 2032
- Table 106: China Next Generation Sequencing Software Market Volume (K Unit) Forecast, by Application 2019 & 2032
- Table 107: Japan Next Generation Sequencing Software Market Revenue (Million) Forecast, by Application 2019 & 2032
- Table 108: Japan Next Generation Sequencing Software Market Volume (K Unit) Forecast, by Application 2019 & 2032
- Table 109: India Next Generation Sequencing Software Market Revenue (Million) Forecast, by Application 2019 & 2032
- Table 110: India Next Generation Sequencing Software Market Volume (K Unit) Forecast, by Application 2019 & 2032
- Table 111: Australia Next Generation Sequencing Software Market Revenue (Million) Forecast, by Application 2019 & 2032
- Table 112: Australia Next Generation Sequencing Software Market Volume (K Unit) Forecast, by Application 2019 & 2032
- Table 113: South Korea Next Generation Sequencing Software Market Revenue (Million) Forecast, by Application 2019 & 2032
- Table 114: South Korea Next Generation Sequencing Software Market Volume (K Unit) Forecast, by Application 2019 & 2032
- Table 115: Rest of Asia pacific Next Generation Sequencing Software Market Revenue (Million) Forecast, by Application 2019 & 2032
- Table 116: Rest of Asia pacific Next Generation Sequencing Software Market Volume (K Unit) Forecast, by Application 2019 & 2032
- Table 117: Global Next Generation Sequencing Software Market Revenue Million Forecast, by Products and Services 2019 & 2032
- Table 118: Global Next Generation Sequencing Software Market Volume K Unit Forecast, by Products and Services 2019 & 2032
- Table 119: Global Next Generation Sequencing Software Market Revenue Million Forecast, by Application 2019 & 2032
- Table 120: Global Next Generation Sequencing Software Market Volume K Unit Forecast, by Application 2019 & 2032
- Table 121: Global Next Generation Sequencing Software Market Revenue Million Forecast, by End User 2019 & 2032
- Table 122: Global Next Generation Sequencing Software Market Volume K Unit Forecast, by End User 2019 & 2032
- Table 123: Global Next Generation Sequencing Software Market Revenue Million Forecast, by Country 2019 & 2032
- Table 124: Global Next Generation Sequencing Software Market Volume K Unit Forecast, by Country 2019 & 2032
- Table 125: GCC Next Generation Sequencing Software Market Revenue (Million) Forecast, by Application 2019 & 2032
- Table 126: GCC Next Generation Sequencing Software Market Volume (K Unit) Forecast, by Application 2019 & 2032
- Table 127: South Africa Next Generation Sequencing Software Market Revenue (Million) Forecast, by Application 2019 & 2032
- Table 128: South Africa Next Generation Sequencing Software Market Volume (K Unit) Forecast, by Application 2019 & 2032
- Table 129: Rest of Middle East and Africa Next Generation Sequencing Software Market Revenue (Million) Forecast, by Application 2019 & 2032
- Table 130: Rest of Middle East and Africa Next Generation Sequencing Software Market Volume (K Unit) Forecast, by Application 2019 & 2032
- Table 131: Global Next Generation Sequencing Software Market Revenue Million Forecast, by Products and Services 2019 & 2032
- Table 132: Global Next Generation Sequencing Software Market Volume K Unit Forecast, by Products and Services 2019 & 2032
- Table 133: Global Next Generation Sequencing Software Market Revenue Million Forecast, by Application 2019 & 2032
- Table 134: Global Next Generation Sequencing Software Market Volume K Unit Forecast, by Application 2019 & 2032
- Table 135: Global Next Generation Sequencing Software Market Revenue Million Forecast, by End User 2019 & 2032
- Table 136: Global Next Generation Sequencing Software Market Volume K Unit Forecast, by End User 2019 & 2032
- Table 137: Global Next Generation Sequencing Software Market Revenue Million Forecast, by Country 2019 & 2032
- Table 138: Global Next Generation Sequencing Software Market Volume K Unit Forecast, by Country 2019 & 2032
- Table 139: Brazil Next Generation Sequencing Software Market Revenue (Million) Forecast, by Application 2019 & 2032
- Table 140: Brazil Next Generation Sequencing Software Market Volume (K Unit) Forecast, by Application 2019 & 2032
- Table 141: Argentina Next Generation Sequencing Software Market Revenue (Million) Forecast, by Application 2019 & 2032
- Table 142: Argentina Next Generation Sequencing Software Market Volume (K Unit) Forecast, by Application 2019 & 2032
- Table 143: Rest of South America Next Generation Sequencing Software Market Revenue (Million) Forecast, by Application 2019 & 2032
- Table 144: Rest of South America Next Generation Sequencing Software Market Volume (K Unit) Forecast, by Application 2019 & 2032
Frequently Asked Questions
1. What is the projected Compound Annual Growth Rate (CAGR) of the Next Generation Sequencing Software Market?
The projected CAGR is approximately 13.43%.
2. Which companies are prominent players in the Next Generation Sequencing Software Market?
Key companies in the market include DNASTAR Inc, PierianDx Inc , Eagle Genomics Ltd, Sapio Sciences, IBM Corporation, Partek Incorporated, F Hoffmann-La Roche Ltd, Intrexon Bioinformatics Germany GmbH (Genomatix AG), Agilent Technologies Inc, Dnanexus Inc, Real Time Genomics Inc, GENEWIZ Inc, Thermo Fischer Scientific Inc, llumina Inc, BIOVIA(Dassault Systemes), PerkinElmer Inc, Qiagen NV, Fabric Genomics Inc (Omicia Inc ), SoftGenetics LLC.
3. What are the main segments of the Next Generation Sequencing Software Market?
The market segments include Products and Services, Application, End User.
4. Can you provide details about the market size?
The market size is estimated to be USD 10.47 Million as of 2022.
5. What are some drivers contributing to market growth?
Increasing Clinical Applications of NGS; Technological Advancements in NGS Informatics Tools; Growing Preference toward Personalized Medicines and Early Disease Diagnosis; Increasing Demand for NGS Services and Rising Investment by Key Players.
6. What are the notable trends driving market growth?
Genetic Screening Segment. by Application. is Expected to Experience the Fastest Growth in the Market.
7. Are there any restraints impacting market growth?
Lack of Skilled Technicians for NGS Informatics Services; Challenges Associated with Data Storage and Integration.
8. Can you provide examples of recent developments in the market?
May 2022: NanoString Technologies, Inc. announced a seamless, cloud-based workflow that improves customers' spatial data analysis experience using Illumina NextSeq 1000 and NextSeq 2000 sequencing systems and the GeoMx Digital Spatial Profiler.
9. What pricing options are available for accessing the report?
Pricing options include single-user, multi-user, and enterprise licenses priced at USD 4750, USD 5250, and USD 8750 respectively.
10. Is the market size provided in terms of value or volume?
The market size is provided in terms of value, measured in Million and volume, measured in K Unit.
11. Are there any specific market keywords associated with the report?
Yes, the market keyword associated with the report is "Next Generation Sequencing Software Market," which aids in identifying and referencing the specific market segment covered.
12. How do I determine which pricing option suits my needs best?
The pricing options vary based on user requirements and access needs. Individual users may opt for single-user licenses, while businesses requiring broader access may choose multi-user or enterprise licenses for cost-effective access to the report.
13. Are there any additional resources or data provided in the Next Generation Sequencing Software Market report?
While the report offers comprehensive insights, it's advisable to review the specific contents or supplementary materials provided to ascertain if additional resources or data are available.
14. How can I stay updated on further developments or reports in the Next Generation Sequencing Software Market?
To stay informed about further developments, trends, and reports in the Next Generation Sequencing Software Market, consider subscribing to industry newsletters, following relevant companies and organizations, or regularly checking reputable industry news sources and publications.
Methodology
Step 1 - Identification of Relevant Samples Size from Population Database


Step 2 - Approaches for Defining Global Market Size (Value, Volume* & Price*)

Note*: In applicable scenarios
Step 3 - Data Sources
Primary Research
- Web Analytics
- Survey Reports
- Research Institute
- Latest Research Reports
- Opinion Leaders
Secondary Research
- Annual Reports
- White Paper
- Latest Press Release
- Industry Association
- Paid Database
- Investor Presentations

Step 4 - Data Triangulation
Involves using different sources of information in order to increase the validity of a study
These sources are likely to be stakeholders in a program - participants, other researchers, program staff, other community members, and so on.
Then we put all data in single framework & apply various statistical tools to find out the dynamic on the market.
During the analysis stage, feedback from the stakeholder groups would be compared to determine areas of agreement as well as areas of divergence


