
Key Insights
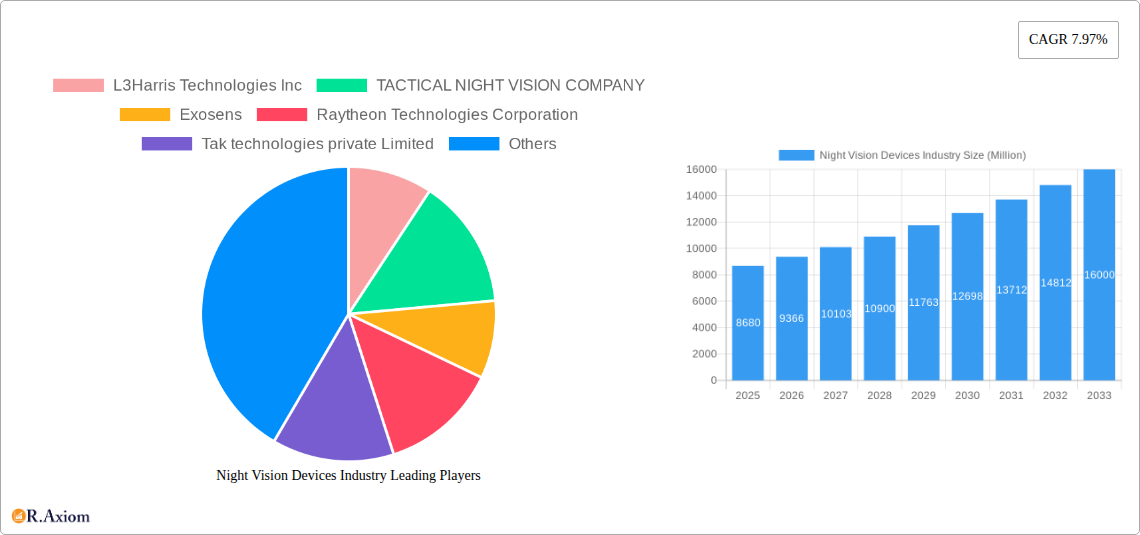
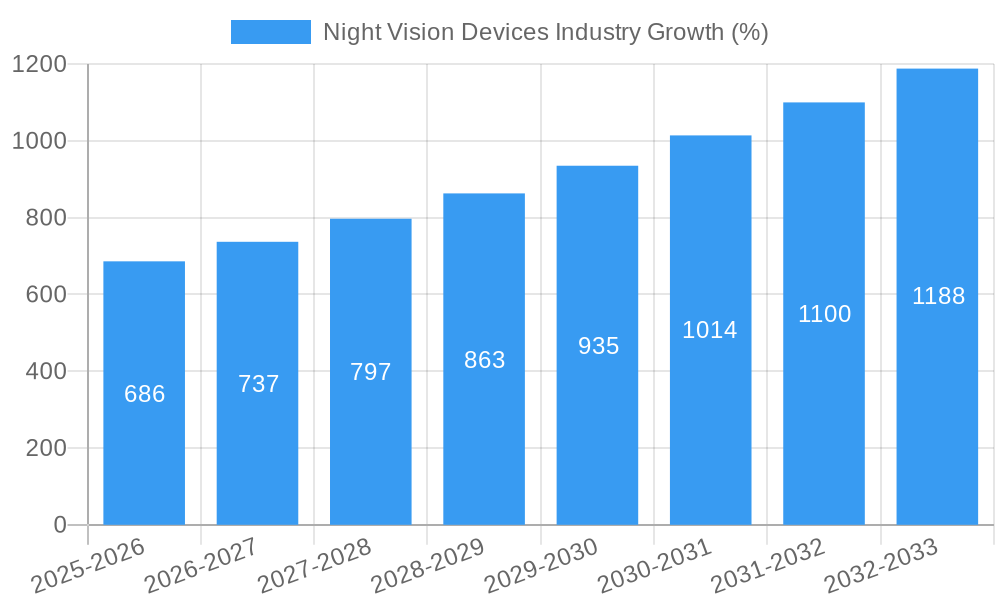
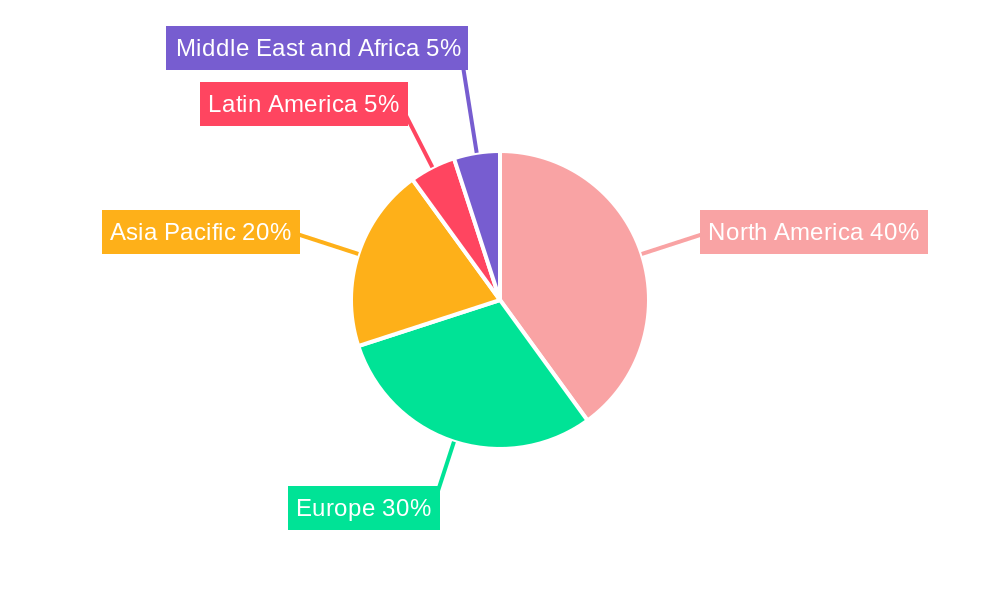
The Night Vision Devices (NVD) market, valued at $8.68 billion in 2025, is experiencing robust growth, projected to expand at a Compound Annual Growth Rate (CAGR) of 7.97% from 2025 to 2033. This growth is fueled by increasing demand from military and defense sectors, driven by modernization initiatives and ongoing geopolitical instability. Furthermore, advancements in thermal imaging and image intensifier technologies are enhancing NVD capabilities, leading to wider adoption in surveillance, wildlife conservation, and navigation applications. The market segmentation reveals strong performance across various device types, including cameras, goggles, and rifle scopes, with thermal imaging technology leading the technological advancements. North America and Europe currently hold significant market share, but the Asia-Pacific region is anticipated to witness substantial growth due to increasing investments in defense and security infrastructure and rising consumer demand for outdoor recreational activities. However, the high cost of advanced NVDs and stringent regulatory frameworks in certain regions pose challenges to market expansion.
Despite these challenges, the long-term outlook for the NVD market remains positive. Technological innovation, particularly in miniaturization and improved image quality, is driving down costs and expanding the potential applications of NVDs. The increasing integration of NVDs with other technologies, such as drones and autonomous vehicles, presents further growth opportunities. The market is expected to see a shift towards lighter, more compact, and user-friendly devices. Furthermore, the rise of private security companies and increasing emphasis on border security and anti-terrorism measures globally contributes to a sustained demand for high-quality night vision equipment. Competition within the market is intense, with both established players and emerging innovators vying for market share. Strategic partnerships and mergers and acquisitions are likely to shape the market landscape in the coming years.
Night Vision Devices Industry Market Report: 2019-2033
This comprehensive report provides an in-depth analysis of the Night Vision Devices industry, covering market size, segmentation, key players, technological advancements, and future growth prospects. The study period spans from 2019 to 2033, with 2025 as the base and estimated year. The report offers actionable insights for industry stakeholders, investors, and businesses seeking to navigate this dynamic market.
Night Vision Devices Industry Market Concentration & Innovation
The night vision devices market is characterized by a moderately concentrated landscape with a few dominant players holding significant market share. L3Harris Technologies Inc., Raytheon Technologies Corporation, and Teledyne FLIR LLC are among the leading companies, each commanding a substantial portion of the global market. However, several smaller, specialized companies also contribute significantly, particularly in niche segments like thermal imaging or specific military applications. The exact market share distribution is dynamic and varies across segments. Market concentration is expected to remain relatively stable in the forecast period, though strategic mergers and acquisitions (M&A) could alter this.
Several factors drive innovation:
- Technological advancements: Continuous improvement in image intensification, thermal imaging, and sensor fusion technologies.
- Military and defense spending: Government investments in advanced night vision systems significantly impact innovation.
- Commercial applications: Growing demand from security, surveillance, and wildlife observation sectors.
Regulatory frameworks, particularly those related to military export controls and environmental regulations concerning materials used in night vision devices, influence market dynamics. Product substitutes, such as enhanced low-light cameras, pose a challenge in specific applications. However, the unique capabilities of night vision devices, particularly in low-light and complete darkness, retain a strong competitive edge. The rise of miniaturization and integration with augmented reality (AR) technologies is a key innovation driver.
Recent M&A activity has been moderate, with deal values averaging xx Million USD per transaction in the historical period (2019-2024). Future M&A activity is anticipated to focus on consolidating market share and acquiring specialized technologies.
Night Vision Devices Industry Industry Trends & Insights
The night vision devices market is experiencing robust growth, driven by increasing demand from various sectors. The Compound Annual Growth Rate (CAGR) for the forecast period (2025-2033) is estimated at xx%, driven by several key factors:
- Military modernization: Significant investments in defense modernization programs worldwide are fueling demand for sophisticated night vision equipment.
- Rising adoption in commercial sectors: Increased use in surveillance, wildlife monitoring, and search and rescue operations.
- Technological advancements: Improved image quality, smaller form factors, and integration with other technologies, like AR.
Technological disruptions, such as the development of advanced sensor fusion and AI-powered image processing, are reshaping the industry. Consumer preferences are shifting towards lighter, more compact, and user-friendly devices with enhanced image quality and extended battery life. Competitive dynamics remain intense, with companies focusing on differentiation through technological innovation, cost-effectiveness, and strategic partnerships. Market penetration varies considerably across different geographic regions and applications. The penetration of night vision devices in law enforcement and civilian security is rising steadily, while military applications maintain a large market share.
Dominant Markets & Segments in Night Vision Devices Industry
The North American market currently holds the largest share of the global night vision devices market, driven primarily by high defense spending and a strong technological base. However, the Asia-Pacific region shows significant growth potential due to rising defense budgets and increasing commercial applications.
By Type:
- Goggles: This segment is currently the largest, driven by its widespread use in military and law enforcement.
- Rifle Scopes: This segment shows steady growth, fueled by increasing demand from civilian and military markets.
- Cameras: The camera segment holds a considerable share and is gaining traction due to the improved quality and capabilities.
By Technology:
- Thermal Imaging: This technology is experiencing rapid growth due to its effectiveness in various applications, regardless of lighting conditions.
- Image Intensifier: This segment retains significant market share, especially in military and defense applications.
By Application:
- Military and Defense: This remains the largest application segment, accounting for xx% of the market.
- Surveillance: The surveillance segment demonstrates strong growth, fueled by advancements in security systems.
Key drivers vary across segments and regions:
- Military and Defense: High defense budgets, modernization programs, and geopolitical instability.
- Commercial Applications: Increased security concerns, growing adoption in wildlife conservation, and advancements in autonomous vehicles.
Night Vision Devices Industry Product Developments
Recent product innovations focus on enhanced image quality, miniaturization, improved durability, and integration with AR and other technologies. Companies are actively developing lightweight, compact devices with improved ergonomics and user interfaces. The integration of thermal imaging and image intensification technologies, along with sensor fusion, is a key trend, offering superior performance in various operating conditions. This allows for better situational awareness and target acquisition, providing a clear competitive advantage in the market.
Report Scope & Segmentation Analysis
This report segments the night vision devices market by type (Camera, Goggles, Monoculars and Binoculars, Rifle Scope, Other Types), technology (Thermal Imaging, Image Intensifier, Infrared Illumination, Other Technologies), and application (Military and Defense, Wildlife Spotting and Conservation, Surveillance, Navigation, Other Applications). Each segment's growth projections, market sizes (in Millions USD), and competitive dynamics are analyzed in detail. The report provides historical data (2019-2024), estimates for 2025, and forecasts for 2025-2033.
Key Drivers of Night Vision Devices Industry Growth
The night vision devices industry's growth is driven by several factors:
- Technological advancements: Improved image quality, miniaturization, and integration with other technologies like AR.
- Increased military spending: Global defense budgets are driving demand for sophisticated night vision equipment.
- Growing adoption in commercial sectors: Expansion into security, surveillance, wildlife conservation, and other applications.
Challenges in the Night Vision Devices Industry Sector
Several challenges hinder the industry's growth:
- High manufacturing costs: Advanced technologies and specialized components contribute to high production costs.
- Stringent regulatory requirements: Military export controls and environmental regulations impact operations.
- Intense competition: Several established and emerging players compete for market share.
Emerging Opportunities in Night Vision Devices Industry
Several opportunities exist for growth:
- Expansion into new markets: Developing countries represent significant growth potential.
- Integration with emerging technologies: Combining night vision with AI, AR, and IoT.
- Development of specialized applications: Creating niche products for specific sectors.
Leading Players in the Night Vision Devices Industry Market
- L3Harris Technologies Inc.
- TACTICAL NIGHT VISION COMPANY
- Exosens
- Raytheon Technologies Corporation
- Tak technologies private Limited
- Satir
- nivisys LLC
- Excelitas Technologies Corp
- sharp Corporation
- Elibit Systems Ltd
- BAE Systems PLC
- EOTECH LLC
- Thales Group SA
- Opgal Optronic Industries Ltd
- Apresys International Inc
- Luna Optics Inc
- Panasonic Holding Corporation
- American Technologies Network Corp
- Bushnell Inc
- Teledyne FLIR LLC
Key Developments in Night Vision Devices Industry Industry
- November 2023: Night Vision LLC (Elbit Systems of America) secured a USD 500 Million contract from the US Department of Defense for SBNVG systems.
- October 2023: Thermoteknix Systems launched the Fused Night Vision Goggle with Augmented Reality (FNVG-AR).
Strategic Outlook for Night Vision Devices Industry Market
The night vision devices market holds significant future potential, driven by continuous technological advancements, increasing defense spending, and the expanding commercial applications. The integration of emerging technologies, such as AI and AR, will further enhance the capabilities of night vision systems, opening new markets and applications. The industry is poised for sustained growth, driven by both military and commercial demand.
Night Vision Devices Industry Segmentation
-
1. Type
- 1.1. Camera
- 1.2. Goggles
- 1.3. Monoculars and Binoculars
- 1.4. Rifle Scope
- 1.5. Other Types
-
2. Technology
- 2.1. Thermal Imaging
- 2.2. Image Intensifier
- 2.3. Infrared Illumination
- 2.4. Other Technologies
-
3. Application
- 3.1. Military and Defense
- 3.2. Wildlife Spotting and Conservation
- 3.3. Surveillance
- 3.4. Navigation
- 3.5. Other Applications
Night Vision Devices Industry Segmentation By Geography
- 1. North America
- 2. Europe
- 3. Asia Pacific
- 4. Latin America
- 5. Middle East and Africa
Night Vision Devices Industry REPORT HIGHLIGHTS
| Aspects | Details |
|---|---|
| Study Period | 2019-2033 |
| Base Year | 2024 |
| Estimated Year | 2025 |
| Forecast Period | 2025-2033 |
| Historical Period | 2019-2024 |
| Growth Rate | CAGR of 7.97% from 2019-2033 |
| Segmentation |
|
Table of Contents
- 1. Introduction
- 1.1. Research Scope
- 1.2. Market Segmentation
- 1.3. Research Methodology
- 1.4. Definitions and Assumptions
- 2. Executive Summary
- 2.1. Introduction
- 3. Market Dynamics
- 3.1. Introduction
- 3.2. Market Drivers
- 3.2.1. Increasing Military Expenditure; Increasing Adoption from Law Enforcement
- 3.3. Market Restrains
- 3.3.1. High Costs Associated with Maintenance
- 3.4. Market Trends
- 3.4.1. Surveillance Applications to Hold Significant Share
- 4. Market Factor Analysis
- 4.1. Porters Five Forces
- 4.2. Supply/Value Chain
- 4.3. PESTEL analysis
- 4.4. Market Entropy
- 4.5. Patent/Trademark Analysis
- 5. Global Night Vision Devices Industry Analysis, Insights and Forecast, 2019-2031
- 5.1. Market Analysis, Insights and Forecast - by Type
- 5.1.1. Camera
- 5.1.2. Goggles
- 5.1.3. Monoculars and Binoculars
- 5.1.4. Rifle Scope
- 5.1.5. Other Types
- 5.2. Market Analysis, Insights and Forecast - by Technology
- 5.2.1. Thermal Imaging
- 5.2.2. Image Intensifier
- 5.2.3. Infrared Illumination
- 5.2.4. Other Technologies
- 5.3. Market Analysis, Insights and Forecast - by Application
- 5.3.1. Military and Defense
- 5.3.2. Wildlife Spotting and Conservation
- 5.3.3. Surveillance
- 5.3.4. Navigation
- 5.3.5. Other Applications
- 5.4. Market Analysis, Insights and Forecast - by Region
- 5.4.1. North America
- 5.4.2. Europe
- 5.4.3. Asia Pacific
- 5.4.4. Latin America
- 5.4.5. Middle East and Africa
- 5.1. Market Analysis, Insights and Forecast - by Type
- 6. North America Night Vision Devices Industry Analysis, Insights and Forecast, 2019-2031
- 6.1. Market Analysis, Insights and Forecast - by Type
- 6.1.1. Camera
- 6.1.2. Goggles
- 6.1.3. Monoculars and Binoculars
- 6.1.4. Rifle Scope
- 6.1.5. Other Types
- 6.2. Market Analysis, Insights and Forecast - by Technology
- 6.2.1. Thermal Imaging
- 6.2.2. Image Intensifier
- 6.2.3. Infrared Illumination
- 6.2.4. Other Technologies
- 6.3. Market Analysis, Insights and Forecast - by Application
- 6.3.1. Military and Defense
- 6.3.2. Wildlife Spotting and Conservation
- 6.3.3. Surveillance
- 6.3.4. Navigation
- 6.3.5. Other Applications
- 6.1. Market Analysis, Insights and Forecast - by Type
- 7. Europe Night Vision Devices Industry Analysis, Insights and Forecast, 2019-2031
- 7.1. Market Analysis, Insights and Forecast - by Type
- 7.1.1. Camera
- 7.1.2. Goggles
- 7.1.3. Monoculars and Binoculars
- 7.1.4. Rifle Scope
- 7.1.5. Other Types
- 7.2. Market Analysis, Insights and Forecast - by Technology
- 7.2.1. Thermal Imaging
- 7.2.2. Image Intensifier
- 7.2.3. Infrared Illumination
- 7.2.4. Other Technologies
- 7.3. Market Analysis, Insights and Forecast - by Application
- 7.3.1. Military and Defense
- 7.3.2. Wildlife Spotting and Conservation
- 7.3.3. Surveillance
- 7.3.4. Navigation
- 7.3.5. Other Applications
- 7.1. Market Analysis, Insights and Forecast - by Type
- 8. Asia Pacific Night Vision Devices Industry Analysis, Insights and Forecast, 2019-2031
- 8.1. Market Analysis, Insights and Forecast - by Type
- 8.1.1. Camera
- 8.1.2. Goggles
- 8.1.3. Monoculars and Binoculars
- 8.1.4. Rifle Scope
- 8.1.5. Other Types
- 8.2. Market Analysis, Insights and Forecast - by Technology
- 8.2.1. Thermal Imaging
- 8.2.2. Image Intensifier
- 8.2.3. Infrared Illumination
- 8.2.4. Other Technologies
- 8.3. Market Analysis, Insights and Forecast - by Application
- 8.3.1. Military and Defense
- 8.3.2. Wildlife Spotting and Conservation
- 8.3.3. Surveillance
- 8.3.4. Navigation
- 8.3.5. Other Applications
- 8.1. Market Analysis, Insights and Forecast - by Type
- 9. Latin America Night Vision Devices Industry Analysis, Insights and Forecast, 2019-2031
- 9.1. Market Analysis, Insights and Forecast - by Type
- 9.1.1. Camera
- 9.1.2. Goggles
- 9.1.3. Monoculars and Binoculars
- 9.1.4. Rifle Scope
- 9.1.5. Other Types
- 9.2. Market Analysis, Insights and Forecast - by Technology
- 9.2.1. Thermal Imaging
- 9.2.2. Image Intensifier
- 9.2.3. Infrared Illumination
- 9.2.4. Other Technologies
- 9.3. Market Analysis, Insights and Forecast - by Application
- 9.3.1. Military and Defense
- 9.3.2. Wildlife Spotting and Conservation
- 9.3.3. Surveillance
- 9.3.4. Navigation
- 9.3.5. Other Applications
- 9.1. Market Analysis, Insights and Forecast - by Type
- 10. Middle East and Africa Night Vision Devices Industry Analysis, Insights and Forecast, 2019-2031
- 10.1. Market Analysis, Insights and Forecast - by Type
- 10.1.1. Camera
- 10.1.2. Goggles
- 10.1.3. Monoculars and Binoculars
- 10.1.4. Rifle Scope
- 10.1.5. Other Types
- 10.2. Market Analysis, Insights and Forecast - by Technology
- 10.2.1. Thermal Imaging
- 10.2.2. Image Intensifier
- 10.2.3. Infrared Illumination
- 10.2.4. Other Technologies
- 10.3. Market Analysis, Insights and Forecast - by Application
- 10.3.1. Military and Defense
- 10.3.2. Wildlife Spotting and Conservation
- 10.3.3. Surveillance
- 10.3.4. Navigation
- 10.3.5. Other Applications
- 10.1. Market Analysis, Insights and Forecast - by Type
- 11. North America Night Vision Devices Industry Analysis, Insights and Forecast, 2019-2031
- 11.1. Market Analysis, Insights and Forecast - By Country/Sub-region
- 11.1.1.
- 12. Europe Night Vision Devices Industry Analysis, Insights and Forecast, 2019-2031
- 12.1. Market Analysis, Insights and Forecast - By Country/Sub-region
- 12.1.1.
- 13. Asia Pacific Night Vision Devices Industry Analysis, Insights and Forecast, 2019-2031
- 13.1. Market Analysis, Insights and Forecast - By Country/Sub-region
- 13.1.1.
- 14. Latin America Night Vision Devices Industry Analysis, Insights and Forecast, 2019-2031
- 14.1. Market Analysis, Insights and Forecast - By Country/Sub-region
- 14.1.1.
- 15. Middle East and Africa Night Vision Devices Industry Analysis, Insights and Forecast, 2019-2031
- 15.1. Market Analysis, Insights and Forecast - By Country/Sub-region
- 15.1.1.
- 16. Competitive Analysis
- 16.1. Global Market Share Analysis 2024
- 16.2. Company Profiles
- 16.2.1 L3Harris Technologies Inc
- 16.2.1.1. Overview
- 16.2.1.2. Products
- 16.2.1.3. SWOT Analysis
- 16.2.1.4. Recent Developments
- 16.2.1.5. Financials (Based on Availability)
- 16.2.2 TACTICAL NIGHT VISION COMPANY
- 16.2.2.1. Overview
- 16.2.2.2. Products
- 16.2.2.3. SWOT Analysis
- 16.2.2.4. Recent Developments
- 16.2.2.5. Financials (Based on Availability)
- 16.2.3 Exosens
- 16.2.3.1. Overview
- 16.2.3.2. Products
- 16.2.3.3. SWOT Analysis
- 16.2.3.4. Recent Developments
- 16.2.3.5. Financials (Based on Availability)
- 16.2.4 Raytheon Technologies Corporation
- 16.2.4.1. Overview
- 16.2.4.2. Products
- 16.2.4.3. SWOT Analysis
- 16.2.4.4. Recent Developments
- 16.2.4.5. Financials (Based on Availability)
- 16.2.5 Tak technologies private Limited
- 16.2.5.1. Overview
- 16.2.5.2. Products
- 16.2.5.3. SWOT Analysis
- 16.2.5.4. Recent Developments
- 16.2.5.5. Financials (Based on Availability)
- 16.2.6 Satir
- 16.2.6.1. Overview
- 16.2.6.2. Products
- 16.2.6.3. SWOT Analysis
- 16.2.6.4. Recent Developments
- 16.2.6.5. Financials (Based on Availability)
- 16.2.7 nivisys LLC
- 16.2.7.1. Overview
- 16.2.7.2. Products
- 16.2.7.3. SWOT Analysis
- 16.2.7.4. Recent Developments
- 16.2.7.5. Financials (Based on Availability)
- 16.2.8 Excelitas Technologies Corp
- 16.2.8.1. Overview
- 16.2.8.2. Products
- 16.2.8.3. SWOT Analysis
- 16.2.8.4. Recent Developments
- 16.2.8.5. Financials (Based on Availability)
- 16.2.9 sharp Corporation
- 16.2.9.1. Overview
- 16.2.9.2. Products
- 16.2.9.3. SWOT Analysis
- 16.2.9.4. Recent Developments
- 16.2.9.5. Financials (Based on Availability)
- 16.2.10 Elibit Systems Ltd
- 16.2.10.1. Overview
- 16.2.10.2. Products
- 16.2.10.3. SWOT Analysis
- 16.2.10.4. Recent Developments
- 16.2.10.5. Financials (Based on Availability)
- 16.2.11 BAE Systems PLC
- 16.2.11.1. Overview
- 16.2.11.2. Products
- 16.2.11.3. SWOT Analysis
- 16.2.11.4. Recent Developments
- 16.2.11.5. Financials (Based on Availability)
- 16.2.12 EOTECH LLC
- 16.2.12.1. Overview
- 16.2.12.2. Products
- 16.2.12.3. SWOT Analysis
- 16.2.12.4. Recent Developments
- 16.2.12.5. Financials (Based on Availability)
- 16.2.13 Thales Group SA
- 16.2.13.1. Overview
- 16.2.13.2. Products
- 16.2.13.3. SWOT Analysis
- 16.2.13.4. Recent Developments
- 16.2.13.5. Financials (Based on Availability)
- 16.2.14 Opgal Optronic Industries Ltd
- 16.2.14.1. Overview
- 16.2.14.2. Products
- 16.2.14.3. SWOT Analysis
- 16.2.14.4. Recent Developments
- 16.2.14.5. Financials (Based on Availability)
- 16.2.15 Apresys International Inc
- 16.2.15.1. Overview
- 16.2.15.2. Products
- 16.2.15.3. SWOT Analysis
- 16.2.15.4. Recent Developments
- 16.2.15.5. Financials (Based on Availability)
- 16.2.16 Luna Optics Inc
- 16.2.16.1. Overview
- 16.2.16.2. Products
- 16.2.16.3. SWOT Analysis
- 16.2.16.4. Recent Developments
- 16.2.16.5. Financials (Based on Availability)
- 16.2.17 Panasonic Holding Corporation
- 16.2.17.1. Overview
- 16.2.17.2. Products
- 16.2.17.3. SWOT Analysis
- 16.2.17.4. Recent Developments
- 16.2.17.5. Financials (Based on Availability)
- 16.2.18 American Technologies Network Corp
- 16.2.18.1. Overview
- 16.2.18.2. Products
- 16.2.18.3. SWOT Analysis
- 16.2.18.4. Recent Developments
- 16.2.18.5. Financials (Based on Availability)
- 16.2.19 Bushnell Inc
- 16.2.19.1. Overview
- 16.2.19.2. Products
- 16.2.19.3. SWOT Analysis
- 16.2.19.4. Recent Developments
- 16.2.19.5. Financials (Based on Availability)
- 16.2.20 Teledyne FLIR LLC
- 16.2.20.1. Overview
- 16.2.20.2. Products
- 16.2.20.3. SWOT Analysis
- 16.2.20.4. Recent Developments
- 16.2.20.5. Financials (Based on Availability)
- 16.2.1 L3Harris Technologies Inc
List of Figures
- Figure 1: Global Night Vision Devices Industry Revenue Breakdown (Million, %) by Region 2024 & 2032
- Figure 2: North America Night Vision Devices Industry Revenue (Million), by Country 2024 & 2032
- Figure 3: North America Night Vision Devices Industry Revenue Share (%), by Country 2024 & 2032
- Figure 4: Europe Night Vision Devices Industry Revenue (Million), by Country 2024 & 2032
- Figure 5: Europe Night Vision Devices Industry Revenue Share (%), by Country 2024 & 2032
- Figure 6: Asia Pacific Night Vision Devices Industry Revenue (Million), by Country 2024 & 2032
- Figure 7: Asia Pacific Night Vision Devices Industry Revenue Share (%), by Country 2024 & 2032
- Figure 8: Latin America Night Vision Devices Industry Revenue (Million), by Country 2024 & 2032
- Figure 9: Latin America Night Vision Devices Industry Revenue Share (%), by Country 2024 & 2032
- Figure 10: Middle East and Africa Night Vision Devices Industry Revenue (Million), by Country 2024 & 2032
- Figure 11: Middle East and Africa Night Vision Devices Industry Revenue Share (%), by Country 2024 & 2032
- Figure 12: North America Night Vision Devices Industry Revenue (Million), by Type 2024 & 2032
- Figure 13: North America Night Vision Devices Industry Revenue Share (%), by Type 2024 & 2032
- Figure 14: North America Night Vision Devices Industry Revenue (Million), by Technology 2024 & 2032
- Figure 15: North America Night Vision Devices Industry Revenue Share (%), by Technology 2024 & 2032
- Figure 16: North America Night Vision Devices Industry Revenue (Million), by Application 2024 & 2032
- Figure 17: North America Night Vision Devices Industry Revenue Share (%), by Application 2024 & 2032
- Figure 18: North America Night Vision Devices Industry Revenue (Million), by Country 2024 & 2032
- Figure 19: North America Night Vision Devices Industry Revenue Share (%), by Country 2024 & 2032
- Figure 20: Europe Night Vision Devices Industry Revenue (Million), by Type 2024 & 2032
- Figure 21: Europe Night Vision Devices Industry Revenue Share (%), by Type 2024 & 2032
- Figure 22: Europe Night Vision Devices Industry Revenue (Million), by Technology 2024 & 2032
- Figure 23: Europe Night Vision Devices Industry Revenue Share (%), by Technology 2024 & 2032
- Figure 24: Europe Night Vision Devices Industry Revenue (Million), by Application 2024 & 2032
- Figure 25: Europe Night Vision Devices Industry Revenue Share (%), by Application 2024 & 2032
- Figure 26: Europe Night Vision Devices Industry Revenue (Million), by Country 2024 & 2032
- Figure 27: Europe Night Vision Devices Industry Revenue Share (%), by Country 2024 & 2032
- Figure 28: Asia Pacific Night Vision Devices Industry Revenue (Million), by Type 2024 & 2032
- Figure 29: Asia Pacific Night Vision Devices Industry Revenue Share (%), by Type 2024 & 2032
- Figure 30: Asia Pacific Night Vision Devices Industry Revenue (Million), by Technology 2024 & 2032
- Figure 31: Asia Pacific Night Vision Devices Industry Revenue Share (%), by Technology 2024 & 2032
- Figure 32: Asia Pacific Night Vision Devices Industry Revenue (Million), by Application 2024 & 2032
- Figure 33: Asia Pacific Night Vision Devices Industry Revenue Share (%), by Application 2024 & 2032
- Figure 34: Asia Pacific Night Vision Devices Industry Revenue (Million), by Country 2024 & 2032
- Figure 35: Asia Pacific Night Vision Devices Industry Revenue Share (%), by Country 2024 & 2032
- Figure 36: Latin America Night Vision Devices Industry Revenue (Million), by Type 2024 & 2032
- Figure 37: Latin America Night Vision Devices Industry Revenue Share (%), by Type 2024 & 2032
- Figure 38: Latin America Night Vision Devices Industry Revenue (Million), by Technology 2024 & 2032
- Figure 39: Latin America Night Vision Devices Industry Revenue Share (%), by Technology 2024 & 2032
- Figure 40: Latin America Night Vision Devices Industry Revenue (Million), by Application 2024 & 2032
- Figure 41: Latin America Night Vision Devices Industry Revenue Share (%), by Application 2024 & 2032
- Figure 42: Latin America Night Vision Devices Industry Revenue (Million), by Country 2024 & 2032
- Figure 43: Latin America Night Vision Devices Industry Revenue Share (%), by Country 2024 & 2032
- Figure 44: Middle East and Africa Night Vision Devices Industry Revenue (Million), by Type 2024 & 2032
- Figure 45: Middle East and Africa Night Vision Devices Industry Revenue Share (%), by Type 2024 & 2032
- Figure 46: Middle East and Africa Night Vision Devices Industry Revenue (Million), by Technology 2024 & 2032
- Figure 47: Middle East and Africa Night Vision Devices Industry Revenue Share (%), by Technology 2024 & 2032
- Figure 48: Middle East and Africa Night Vision Devices Industry Revenue (Million), by Application 2024 & 2032
- Figure 49: Middle East and Africa Night Vision Devices Industry Revenue Share (%), by Application 2024 & 2032
- Figure 50: Middle East and Africa Night Vision Devices Industry Revenue (Million), by Country 2024 & 2032
- Figure 51: Middle East and Africa Night Vision Devices Industry Revenue Share (%), by Country 2024 & 2032
List of Tables
- Table 1: Global Night Vision Devices Industry Revenue Million Forecast, by Region 2019 & 2032
- Table 2: Global Night Vision Devices Industry Revenue Million Forecast, by Type 2019 & 2032
- Table 3: Global Night Vision Devices Industry Revenue Million Forecast, by Technology 2019 & 2032
- Table 4: Global Night Vision Devices Industry Revenue Million Forecast, by Application 2019 & 2032
- Table 5: Global Night Vision Devices Industry Revenue Million Forecast, by Region 2019 & 2032
- Table 6: Global Night Vision Devices Industry Revenue Million Forecast, by Country 2019 & 2032
- Table 7: Night Vision Devices Industry Revenue (Million) Forecast, by Application 2019 & 2032
- Table 8: Global Night Vision Devices Industry Revenue Million Forecast, by Country 2019 & 2032
- Table 9: Night Vision Devices Industry Revenue (Million) Forecast, by Application 2019 & 2032
- Table 10: Global Night Vision Devices Industry Revenue Million Forecast, by Country 2019 & 2032
- Table 11: Night Vision Devices Industry Revenue (Million) Forecast, by Application 2019 & 2032
- Table 12: Global Night Vision Devices Industry Revenue Million Forecast, by Country 2019 & 2032
- Table 13: Night Vision Devices Industry Revenue (Million) Forecast, by Application 2019 & 2032
- Table 14: Global Night Vision Devices Industry Revenue Million Forecast, by Country 2019 & 2032
- Table 15: Night Vision Devices Industry Revenue (Million) Forecast, by Application 2019 & 2032
- Table 16: Global Night Vision Devices Industry Revenue Million Forecast, by Type 2019 & 2032
- Table 17: Global Night Vision Devices Industry Revenue Million Forecast, by Technology 2019 & 2032
- Table 18: Global Night Vision Devices Industry Revenue Million Forecast, by Application 2019 & 2032
- Table 19: Global Night Vision Devices Industry Revenue Million Forecast, by Country 2019 & 2032
- Table 20: Global Night Vision Devices Industry Revenue Million Forecast, by Type 2019 & 2032
- Table 21: Global Night Vision Devices Industry Revenue Million Forecast, by Technology 2019 & 2032
- Table 22: Global Night Vision Devices Industry Revenue Million Forecast, by Application 2019 & 2032
- Table 23: Global Night Vision Devices Industry Revenue Million Forecast, by Country 2019 & 2032
- Table 24: Global Night Vision Devices Industry Revenue Million Forecast, by Type 2019 & 2032
- Table 25: Global Night Vision Devices Industry Revenue Million Forecast, by Technology 2019 & 2032
- Table 26: Global Night Vision Devices Industry Revenue Million Forecast, by Application 2019 & 2032
- Table 27: Global Night Vision Devices Industry Revenue Million Forecast, by Country 2019 & 2032
- Table 28: Global Night Vision Devices Industry Revenue Million Forecast, by Type 2019 & 2032
- Table 29: Global Night Vision Devices Industry Revenue Million Forecast, by Technology 2019 & 2032
- Table 30: Global Night Vision Devices Industry Revenue Million Forecast, by Application 2019 & 2032
- Table 31: Global Night Vision Devices Industry Revenue Million Forecast, by Country 2019 & 2032
- Table 32: Global Night Vision Devices Industry Revenue Million Forecast, by Type 2019 & 2032
- Table 33: Global Night Vision Devices Industry Revenue Million Forecast, by Technology 2019 & 2032
- Table 34: Global Night Vision Devices Industry Revenue Million Forecast, by Application 2019 & 2032
- Table 35: Global Night Vision Devices Industry Revenue Million Forecast, by Country 2019 & 2032
Frequently Asked Questions
1. What is the projected Compound Annual Growth Rate (CAGR) of the Night Vision Devices Industry?
The projected CAGR is approximately 7.97%.
2. Which companies are prominent players in the Night Vision Devices Industry?
Key companies in the market include L3Harris Technologies Inc, TACTICAL NIGHT VISION COMPANY, Exosens, Raytheon Technologies Corporation, Tak technologies private Limited, Satir, nivisys LLC, Excelitas Technologies Corp, sharp Corporation, Elibit Systems Ltd, BAE Systems PLC, EOTECH LLC, Thales Group SA, Opgal Optronic Industries Ltd, Apresys International Inc, Luna Optics Inc, Panasonic Holding Corporation, American Technologies Network Corp, Bushnell Inc, Teledyne FLIR LLC.
3. What are the main segments of the Night Vision Devices Industry?
The market segments include Type, Technology, Application.
4. Can you provide details about the market size?
The market size is estimated to be USD 8.68 Million as of 2022.
5. What are some drivers contributing to market growth?
Increasing Military Expenditure; Increasing Adoption from Law Enforcement.
6. What are the notable trends driving market growth?
Surveillance Applications to Hold Significant Share.
7. Are there any restraints impacting market growth?
High Costs Associated with Maintenance.
8. Can you provide examples of recent developments in the market?
November 2023 - Night Vision LLC, a subsidiary of Elbit Systems of America, announced that it secured USD 500 million from the US Department of Defense to enhance the US Marine Corps’ efficiency with the supply of Squad Binocular Night Vision Goggle (SBNVG) systems. The contract is expected to be completed by 2028, aiming to equip the Marines with technology for nighttime situational awareness, with work to be executed in Roanoke, Virginia.
9. What pricing options are available for accessing the report?
Pricing options include single-user, multi-user, and enterprise licenses priced at USD 4750, USD 5250, and USD 8750 respectively.
10. Is the market size provided in terms of value or volume?
The market size is provided in terms of value, measured in Million.
11. Are there any specific market keywords associated with the report?
Yes, the market keyword associated with the report is "Night Vision Devices Industry," which aids in identifying and referencing the specific market segment covered.
12. How do I determine which pricing option suits my needs best?
The pricing options vary based on user requirements and access needs. Individual users may opt for single-user licenses, while businesses requiring broader access may choose multi-user or enterprise licenses for cost-effective access to the report.
13. Are there any additional resources or data provided in the Night Vision Devices Industry report?
While the report offers comprehensive insights, it's advisable to review the specific contents or supplementary materials provided to ascertain if additional resources or data are available.
14. How can I stay updated on further developments or reports in the Night Vision Devices Industry?
To stay informed about further developments, trends, and reports in the Night Vision Devices Industry, consider subscribing to industry newsletters, following relevant companies and organizations, or regularly checking reputable industry news sources and publications.
Methodology
Step 1 - Identification of Relevant Samples Size from Population Database


Step 2 - Approaches for Defining Global Market Size (Value, Volume* & Price*)

Note*: In applicable scenarios
Step 3 - Data Sources
Primary Research
- Web Analytics
- Survey Reports
- Research Institute
- Latest Research Reports
- Opinion Leaders
Secondary Research
- Annual Reports
- White Paper
- Latest Press Release
- Industry Association
- Paid Database
- Investor Presentations

Step 4 - Data Triangulation
Involves using different sources of information in order to increase the validity of a study
These sources are likely to be stakeholders in a program - participants, other researchers, program staff, other community members, and so on.
Then we put all data in single framework & apply various statistical tools to find out the dynamic on the market.
During the analysis stage, feedback from the stakeholder groups would be compared to determine areas of agreement as well as areas of divergence


