
Key Insights
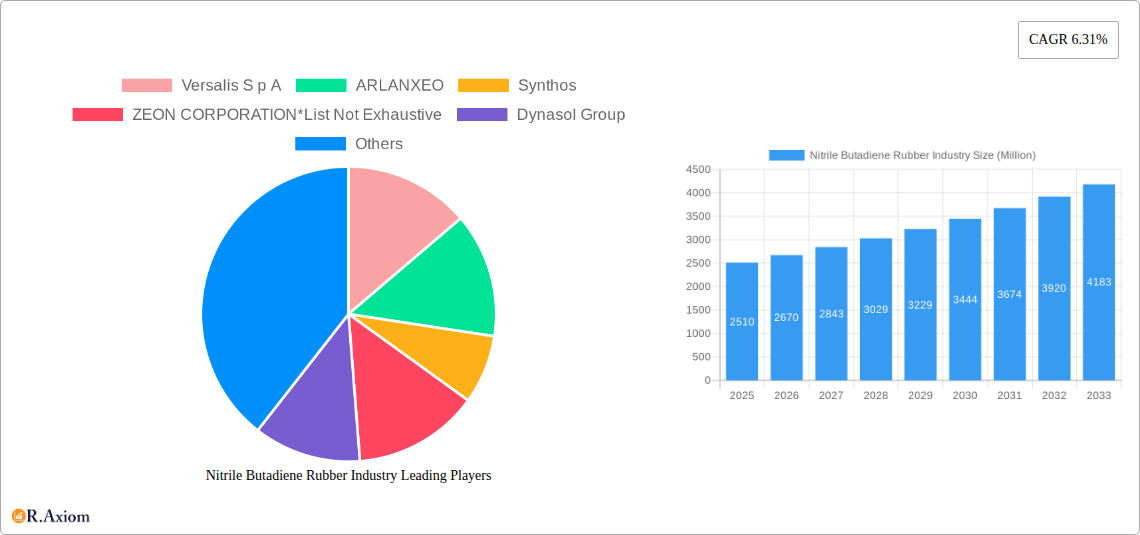
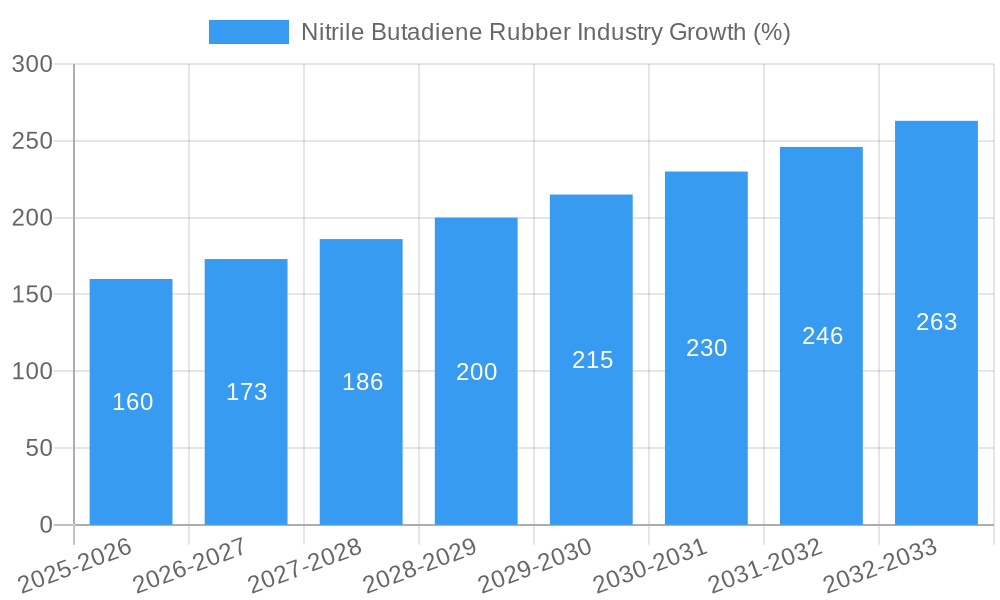
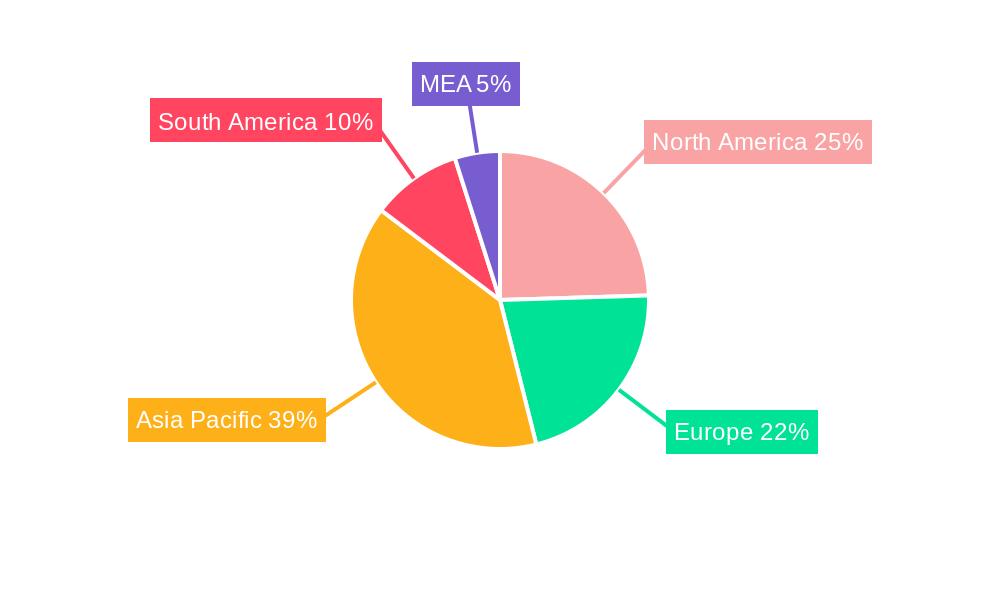
The global Nitrile Butadiene Rubber (NBR) market, valued at $2.51 billion in 2025, is projected to experience robust growth, driven by a compound annual growth rate (CAGR) of 6.31% from 2025 to 2033. This expansion is fueled by increasing demand across diverse applications, particularly in the automotive and construction sectors. The automotive industry's reliance on NBR for seals, hoses, and belts, coupled with the booming construction sector's need for durable adhesives and sealants, are key drivers. Furthermore, the medical industry's adoption of NBR in gloves and other medical devices contributes significantly to market growth. Growth is also expected from increasing demand in other end-user industries such as oil and gas, and aerospace. While potential supply chain disruptions and fluctuations in raw material prices pose challenges, technological advancements leading to improved NBR properties (e.g., enhanced resistance to heat and chemicals) are expected to mitigate these restraints and sustain the market's upward trajectory. The Asia-Pacific region, particularly China and India, is anticipated to be a significant growth engine due to rapid industrialization and infrastructure development. Competition among established players like Versalis S.p.A., Arlanxeo, and Synthos, alongside emerging players, is expected to intensify, potentially leading to product innovation and pricing pressures.
The segment breakdown reveals a dynamic market landscape. The adhesives and sealants application segment is projected to maintain a substantial market share due to its widespread use in various industries. Similarly, the automotive and transportation end-user segment is expected to contribute significantly, reflecting the industry's dependence on NBR for critical components. Future growth will likely be influenced by factors such as government regulations promoting sustainable materials, increasing awareness of NBR's performance advantages, and the development of specialized NBR grades tailored to specific application requirements. The continued expansion of the global economy and the rise of emerging markets will further underpin the long-term growth prospects of the NBR market. Strategic collaborations, mergers and acquisitions, and investments in research and development are likely to shape the competitive landscape in the coming years.
Nitrile Butadiene Rubber (NBR) Industry: A Comprehensive Market Report (2019-2033)
This comprehensive report provides a detailed analysis of the global Nitrile Butadiene Rubber (NBR) industry, offering invaluable insights for stakeholders across the value chain. Covering the period from 2019 to 2033, with a base year of 2025, this study meticulously examines market dynamics, key players, and future growth prospects. The report leverages extensive primary and secondary research to deliver actionable intelligence for strategic decision-making.
Keywords: Nitrile Butadiene Rubber, NBR, Market Analysis, Industry Report, Market Size, Market Share, Market Growth, CAGR, Automotive, Medical, Industrial, Adhesives, Sealants, Gloves, Hoses, Gaskets, O-rings, Versalis S.p.A, ARLANXEO, Synthos, ZEON CORPORATION, Dynasol Group, ENEOS Materials Corporation, KUMHO PETROCHEMICAL, SIBUR, Synthomer PLC, LG Chem, Sinopec, Apcotex, Lanxess, TSRC, Market Segmentation, Competitive Landscape, Industry Trends, Future Outlook, Investment Opportunities.
Nitrile Butadiene Rubber Industry Market Concentration & Innovation
The global NBR market exhibits a moderately concentrated structure, with several key players holding significant market share. However, the presence of numerous smaller regional players ensures a dynamic competitive landscape. Market share data for 2024 indicates that the top five players control approximately xx% of the market, while the remaining share is dispersed among numerous regional manufacturers. Innovation is driven by the need for improved material properties, such as enhanced oil resistance, temperature stability, and durability. Stringent regulatory frameworks, particularly concerning environmental impact and material safety, are also influencing the development of sustainable NBR solutions. The industry witnesses regular M&A activity, with deal values in recent years totaling approximately xx Million USD. This activity is primarily driven by companies aiming to expand their product portfolios, access new technologies, and enhance their global reach. Notable recent examples include [mention specific M&A deal if available, and its value]. Product substitution is a continuous challenge, with other elastomers competing for market share; however, NBR's unique properties maintain its strong position in several key applications. End-user trends, particularly towards lightweighting and enhanced performance in automotive and medical applications, are driving demand for specialized NBR grades.
Nitrile Butadiene Rubber Industry Industry Trends & Insights
The global NBR market is projected to experience significant growth during the forecast period (2025-2033), with a Compound Annual Growth Rate (CAGR) estimated at xx%. This growth is propelled by several key factors. The automotive industry's continuous demand for high-performance seals, hoses, and other components is a primary driver. Furthermore, the expanding medical sector, particularly in disposable medical devices and protective equipment, significantly contributes to NBR demand. Technological disruptions, such as the development of advanced NBR compounds with improved properties, further fuel market expansion. Consumer preferences for durable and reliable products continue to drive demand. The competitive dynamics are characterized by intense rivalry amongst major players focused on product differentiation, cost optimization, and technological advancements. Market penetration in emerging economies is also contributing substantially to the overall market growth, with a projected penetration rate of xx% by 2033.
Dominant Markets & Segments in Nitrile Butadiene Rubber Industry
Leading Region: The Asia-Pacific region dominates the global NBR market, driven by strong growth in automotive and industrial sectors.
Leading Country: China, owing to its robust manufacturing sector and expanding automotive industry, is the leading NBR consuming country.
Dominant Application Segments: Gloves and automotive components (hoses, seals, gaskets) are the primary application segments for NBR, driven by consistent demand from the medical and automotive sectors, respectively.
Key Drivers for Dominant Segments:
- Gloves: Increasing demand for healthcare and personal protective equipment.
- Automotive: Growing vehicle production and stringent automotive safety standards.
- Other Application Segments: The consumer goods segment experiences steady growth due to the versatility of NBR in various applications.
Dominant End-user Industries: The automotive and transportation sectors represent the largest end-use industry for NBR, followed by the medical and industrial sectors.
Economic Policies and Infrastructure: Favorable government policies supporting manufacturing and infrastructure development in key regions significantly contribute to NBR market dominance. The significant investment by Kumho Petrochemical (detailed below) exemplifies this point.
Nitrile Butadiene Rubber Industry Product Developments
Recent product innovations focus on enhancing NBR's performance characteristics, particularly its oil resistance, temperature tolerance, and chemical compatibility. Manufacturers are developing specialized NBR compounds tailored for specific applications, such as high-temperature seals in the automotive industry or biocompatible materials in the medical sector. These advancements leverage nanotechnology and advanced compounding techniques to improve product attributes and address the demands of evolving end-user requirements. The market also witnesses a growing focus on sustainable and eco-friendly NBR solutions, emphasizing reduced environmental impact and improved recyclability.
Report Scope & Segmentation Analysis
This report comprehensively segments the NBR market based on application (Adhesives and Sealants, Belts and Cables, Gloves, Hoses, Gaskets and O-Rings, Other Applications (Consumer Goods)) and end-user industry (Automotive and Transportation, Building and Construction, Industrial, Medical, Other End-user Industries (Oil and Gas, Aerospace)). Each segment's growth projections, market size, and competitive dynamics are meticulously analyzed. For example, the gloves segment is projected to exhibit a xx% CAGR due to heightened demand in the healthcare sector. The automotive segment, a major consumer of NBR, showcases strong growth driven by production volumes and increased adoption of advanced automotive technologies. Market sizes for each segment are detailed within the full report.
Key Drivers of Nitrile Butadiene Rubber Industry Growth
Several factors contribute to the growth of the NBR industry. Strong growth in the automotive sector, particularly in emerging markets, drives considerable demand. The increasing demand for medical devices and protective equipment fuels the expansion of NBR application in the healthcare sector. Furthermore, technological advancements leading to improved NBR properties and new applications, such as in aerospace and oil & gas, contribute significantly to market expansion. Favorable government policies and investments in infrastructure in key regions also play a crucial role.
Challenges in the Nitrile Butadiene Rubber Industry Sector
The NBR industry faces several challenges. Fluctuations in raw material prices, specifically butadiene and acrylonitrile, impact profitability. Supply chain disruptions can lead to production delays and increased costs. Intense competition among major players necessitates continuous innovation and cost optimization. Furthermore, stringent environmental regulations concerning the production and disposal of NBR pose operational challenges. These factors can collectively impact market growth by xx% in the short term.
Emerging Opportunities in Nitrile Butadiene Rubber Industry
The NBR industry presents numerous opportunities. The growing demand for sustainable and eco-friendly materials creates scope for developing biodegradable and recyclable NBR solutions. Expansion into new applications, such as in renewable energy and advanced electronics, offers substantial growth potential. The increasing adoption of NBR in emerging markets driven by economic growth and infrastructure development presents lucrative opportunities.
Leading Players in the Nitrile Butadiene Rubber Industry Market
- Versalis S.p.A
- ARLANXEO
- Synthos
- ZEON CORPORATION
- Dynasol Group
- ENEOS Materials Corporation
- KUMHO PETROCHEMICAL
- SIBUR
- Synthomer PLC
- LG Chem
- China Petrochemical Corporation (Sinopec)
- Apcotex
- Lanxess
- TSRC
Key Developments in Nitrile Butadiene Rubber Industry Industry
- August 2022: Kumho Petrochemical announced a KRW 6,000 billion (~USD 5.10 billion) investment plan over five years, with KRW 3,300 billion (~USD 2.81 billion) allocated to core businesses including NB latex and SSBR manufacturing. This significant investment signals strong growth expectations within the NBR sector and its related materials.
Strategic Outlook for Nitrile Butadiene Rubber Industry Market
The future of the NBR market appears bright, driven by continued growth in key end-use sectors and technological advancements. The focus on sustainable and specialized NBR grades will further fuel market expansion. Opportunities in emerging markets and new applications, combined with ongoing innovation, are expected to drive significant growth in the coming years. The industry's players are well-positioned to capitalize on these opportunities through strategic investments in research and development, expansion into new markets, and strategic partnerships.
Nitrile Butadiene Rubber Industry Segmentation
-
1. Application
- 1.1. Adhesives and Sealants
- 1.2. Belts and Cables
- 1.3. Gloves
- 1.4. Hoses
- 1.5. Gaskets and O-Rings
- 1.6. Other Applications (Consumer Goods)
-
2. End-user Industry
- 2.1. Automotive and Transportation
- 2.2. Building and Construction
- 2.3. Industrial
- 2.4. Medical
- 2.5. Other End-user Industries (Oil and Gas, Aerospace)
Nitrile Butadiene Rubber Industry Segmentation By Geography
-
1. Asia Pacific
- 1.1. China
- 1.2. India
- 1.3. Japan
- 1.4. South Korea
- 1.5. Malaysia
- 1.6. Thailand
- 1.7. Vietnam
- 1.8. Indonesia
- 1.9. Rest of Asia Pacific
-
2. North America
- 2.1. United States
- 2.2. Canada
- 2.3. Mexico
-
3. Europe
- 3.1. Germany
- 3.2. United Kingdom
- 3.3. Italy
- 3.4. France
- 3.5. Spain
- 3.6. Turkey
- 3.7. Russia
- 3.8. NORDIC
- 3.9. Rest of Europe
-
4. South America
- 4.1. Brazil
- 4.2. Argentina
- 4.3. Colombia
- 4.4. Rest of South America
-
5. Middle East and Africa
- 5.1. Saudi Arabia
- 5.2. South Africa
- 5.3. Nigeria
- 5.4. Egypt
- 5.5. Qatar
- 5.6. UAE
- 5.7. Rest of Middle East and Africa
Nitrile Butadiene Rubber Industry REPORT HIGHLIGHTS
| Aspects | Details |
|---|---|
| Study Period | 2019-2033 |
| Base Year | 2024 |
| Estimated Year | 2025 |
| Forecast Period | 2025-2033 |
| Historical Period | 2019-2024 |
| Growth Rate | CAGR of 6.31% from 2019-2033 |
| Segmentation |
|
Table of Contents
- 1. Introduction
- 1.1. Research Scope
- 1.2. Market Segmentation
- 1.3. Research Methodology
- 1.4. Definitions and Assumptions
- 2. Executive Summary
- 2.1. Introduction
- 3. Market Dynamics
- 3.1. Introduction
- 3.2. Market Drivers
- 3.2.1. Expanding Automotive Industry; Industrial and Infrastructure Development Projects
- 3.3. Market Restrains
- 3.3.1. Availability of Substitute Materials; Fluctuating Raw Material Prices
- 3.4. Market Trends
- 3.4.1. Automotive and Transportation Sector Dominates the Market
- 4. Market Factor Analysis
- 4.1. Porters Five Forces
- 4.2. Supply/Value Chain
- 4.3. PESTEL analysis
- 4.4. Market Entropy
- 4.5. Patent/Trademark Analysis
- 5. Global Nitrile Butadiene Rubber Industry Analysis, Insights and Forecast, 2019-2031
- 5.1. Market Analysis, Insights and Forecast - by Application
- 5.1.1. Adhesives and Sealants
- 5.1.2. Belts and Cables
- 5.1.3. Gloves
- 5.1.4. Hoses
- 5.1.5. Gaskets and O-Rings
- 5.1.6. Other Applications (Consumer Goods)
- 5.2. Market Analysis, Insights and Forecast - by End-user Industry
- 5.2.1. Automotive and Transportation
- 5.2.2. Building and Construction
- 5.2.3. Industrial
- 5.2.4. Medical
- 5.2.5. Other End-user Industries (Oil and Gas, Aerospace)
- 5.3. Market Analysis, Insights and Forecast - by Region
- 5.3.1. Asia Pacific
- 5.3.2. North America
- 5.3.3. Europe
- 5.3.4. South America
- 5.3.5. Middle East and Africa
- 5.1. Market Analysis, Insights and Forecast - by Application
- 6. Asia Pacific Nitrile Butadiene Rubber Industry Analysis, Insights and Forecast, 2019-2031
- 6.1. Market Analysis, Insights and Forecast - by Application
- 6.1.1. Adhesives and Sealants
- 6.1.2. Belts and Cables
- 6.1.3. Gloves
- 6.1.4. Hoses
- 6.1.5. Gaskets and O-Rings
- 6.1.6. Other Applications (Consumer Goods)
- 6.2. Market Analysis, Insights and Forecast - by End-user Industry
- 6.2.1. Automotive and Transportation
- 6.2.2. Building and Construction
- 6.2.3. Industrial
- 6.2.4. Medical
- 6.2.5. Other End-user Industries (Oil and Gas, Aerospace)
- 6.1. Market Analysis, Insights and Forecast - by Application
- 7. North America Nitrile Butadiene Rubber Industry Analysis, Insights and Forecast, 2019-2031
- 7.1. Market Analysis, Insights and Forecast - by Application
- 7.1.1. Adhesives and Sealants
- 7.1.2. Belts and Cables
- 7.1.3. Gloves
- 7.1.4. Hoses
- 7.1.5. Gaskets and O-Rings
- 7.1.6. Other Applications (Consumer Goods)
- 7.2. Market Analysis, Insights and Forecast - by End-user Industry
- 7.2.1. Automotive and Transportation
- 7.2.2. Building and Construction
- 7.2.3. Industrial
- 7.2.4. Medical
- 7.2.5. Other End-user Industries (Oil and Gas, Aerospace)
- 7.1. Market Analysis, Insights and Forecast - by Application
- 8. Europe Nitrile Butadiene Rubber Industry Analysis, Insights and Forecast, 2019-2031
- 8.1. Market Analysis, Insights and Forecast - by Application
- 8.1.1. Adhesives and Sealants
- 8.1.2. Belts and Cables
- 8.1.3. Gloves
- 8.1.4. Hoses
- 8.1.5. Gaskets and O-Rings
- 8.1.6. Other Applications (Consumer Goods)
- 8.2. Market Analysis, Insights and Forecast - by End-user Industry
- 8.2.1. Automotive and Transportation
- 8.2.2. Building and Construction
- 8.2.3. Industrial
- 8.2.4. Medical
- 8.2.5. Other End-user Industries (Oil and Gas, Aerospace)
- 8.1. Market Analysis, Insights and Forecast - by Application
- 9. South America Nitrile Butadiene Rubber Industry Analysis, Insights and Forecast, 2019-2031
- 9.1. Market Analysis, Insights and Forecast - by Application
- 9.1.1. Adhesives and Sealants
- 9.1.2. Belts and Cables
- 9.1.3. Gloves
- 9.1.4. Hoses
- 9.1.5. Gaskets and O-Rings
- 9.1.6. Other Applications (Consumer Goods)
- 9.2. Market Analysis, Insights and Forecast - by End-user Industry
- 9.2.1. Automotive and Transportation
- 9.2.2. Building and Construction
- 9.2.3. Industrial
- 9.2.4. Medical
- 9.2.5. Other End-user Industries (Oil and Gas, Aerospace)
- 9.1. Market Analysis, Insights and Forecast - by Application
- 10. Middle East and Africa Nitrile Butadiene Rubber Industry Analysis, Insights and Forecast, 2019-2031
- 10.1. Market Analysis, Insights and Forecast - by Application
- 10.1.1. Adhesives and Sealants
- 10.1.2. Belts and Cables
- 10.1.3. Gloves
- 10.1.4. Hoses
- 10.1.5. Gaskets and O-Rings
- 10.1.6. Other Applications (Consumer Goods)
- 10.2. Market Analysis, Insights and Forecast - by End-user Industry
- 10.2.1. Automotive and Transportation
- 10.2.2. Building and Construction
- 10.2.3. Industrial
- 10.2.4. Medical
- 10.2.5. Other End-user Industries (Oil and Gas, Aerospace)
- 10.1. Market Analysis, Insights and Forecast - by Application
- 11. North America Nitrile Butadiene Rubber Industry Analysis, Insights and Forecast, 2019-2031
- 11.1. Market Analysis, Insights and Forecast - By Country/Sub-region
- 11.1.1 United States
- 11.1.2 Canada
- 11.1.3 Mexico
- 12. Europe Nitrile Butadiene Rubber Industry Analysis, Insights and Forecast, 2019-2031
- 12.1. Market Analysis, Insights and Forecast - By Country/Sub-region
- 12.1.1 Germany
- 12.1.2 France
- 12.1.3 Italy
- 12.1.4 United Kingdom
- 12.1.5 Netherlands
- 12.1.6 Rest of Europe
- 13. Asia Pacific Nitrile Butadiene Rubber Industry Analysis, Insights and Forecast, 2019-2031
- 13.1. Market Analysis, Insights and Forecast - By Country/Sub-region
- 13.1.1 China
- 13.1.2 Japan
- 13.1.3 India
- 13.1.4 South Korea
- 13.1.5 Taiwan
- 13.1.6 Australia
- 13.1.7 Rest of Asia-Pacific
- 14. South America Nitrile Butadiene Rubber Industry Analysis, Insights and Forecast, 2019-2031
- 14.1. Market Analysis, Insights and Forecast - By Country/Sub-region
- 14.1.1 Brazil
- 14.1.2 Argentina
- 14.1.3 Rest of South America
- 15. MEA Nitrile Butadiene Rubber Industry Analysis, Insights and Forecast, 2019-2031
- 15.1. Market Analysis, Insights and Forecast - By Country/Sub-region
- 15.1.1 Middle East
- 15.1.2 Africa
- 16. Competitive Analysis
- 16.1. Global Market Share Analysis 2024
- 16.2. Company Profiles
- 16.2.1 Versalis S p A
- 16.2.1.1. Overview
- 16.2.1.2. Products
- 16.2.1.3. SWOT Analysis
- 16.2.1.4. Recent Developments
- 16.2.1.5. Financials (Based on Availability)
- 16.2.2 ARLANXEO
- 16.2.2.1. Overview
- 16.2.2.2. Products
- 16.2.2.3. SWOT Analysis
- 16.2.2.4. Recent Developments
- 16.2.2.5. Financials (Based on Availability)
- 16.2.3 Synthos
- 16.2.3.1. Overview
- 16.2.3.2. Products
- 16.2.3.3. SWOT Analysis
- 16.2.3.4. Recent Developments
- 16.2.3.5. Financials (Based on Availability)
- 16.2.4 ZEON CORPORATION*List Not Exhaustive
- 16.2.4.1. Overview
- 16.2.4.2. Products
- 16.2.4.3. SWOT Analysis
- 16.2.4.4. Recent Developments
- 16.2.4.5. Financials (Based on Availability)
- 16.2.5 Dynasol Group
- 16.2.5.1. Overview
- 16.2.5.2. Products
- 16.2.5.3. SWOT Analysis
- 16.2.5.4. Recent Developments
- 16.2.5.5. Financials (Based on Availability)
- 16.2.6 ENEOS Materials Corporation
- 16.2.6.1. Overview
- 16.2.6.2. Products
- 16.2.6.3. SWOT Analysis
- 16.2.6.4. Recent Developments
- 16.2.6.5. Financials (Based on Availability)
- 16.2.7 KUMHO PETROCHEMICAL
- 16.2.7.1. Overview
- 16.2.7.2. Products
- 16.2.7.3. SWOT Analysis
- 16.2.7.4. Recent Developments
- 16.2.7.5. Financials (Based on Availability)
- 16.2.8 SIBUR
- 16.2.8.1. Overview
- 16.2.8.2. Products
- 16.2.8.3. SWOT Analysis
- 16.2.8.4. Recent Developments
- 16.2.8.5. Financials (Based on Availability)
- 16.2.9 Synthomer PLC
- 16.2.9.1. Overview
- 16.2.9.2. Products
- 16.2.9.3. SWOT Analysis
- 16.2.9.4. Recent Developments
- 16.2.9.5. Financials (Based on Availability)
- 16.2.10 LG Chem
- 16.2.10.1. Overview
- 16.2.10.2. Products
- 16.2.10.3. SWOT Analysis
- 16.2.10.4. Recent Developments
- 16.2.10.5. Financials (Based on Availability)
- 16.2.11 China Petrochemical Corporation (Sinopec)
- 16.2.11.1. Overview
- 16.2.11.2. Products
- 16.2.11.3. SWOT Analysis
- 16.2.11.4. Recent Developments
- 16.2.11.5. Financials (Based on Availability)
- 16.2.12 Apcotex
- 16.2.12.1. Overview
- 16.2.12.2. Products
- 16.2.12.3. SWOT Analysis
- 16.2.12.4. Recent Developments
- 16.2.12.5. Financials (Based on Availability)
- 16.2.13 Lanxess
- 16.2.13.1. Overview
- 16.2.13.2. Products
- 16.2.13.3. SWOT Analysis
- 16.2.13.4. Recent Developments
- 16.2.13.5. Financials (Based on Availability)
- 16.2.14 TSRC
- 16.2.14.1. Overview
- 16.2.14.2. Products
- 16.2.14.3. SWOT Analysis
- 16.2.14.4. Recent Developments
- 16.2.14.5. Financials (Based on Availability)
- 16.2.1 Versalis S p A
List of Figures
- Figure 1: Global Nitrile Butadiene Rubber Industry Revenue Breakdown (Million, %) by Region 2024 & 2032
- Figure 2: Global Nitrile Butadiene Rubber Industry Volume Breakdown (K Tons, %) by Region 2024 & 2032
- Figure 3: North America Nitrile Butadiene Rubber Industry Revenue (Million), by Country 2024 & 2032
- Figure 4: North America Nitrile Butadiene Rubber Industry Volume (K Tons), by Country 2024 & 2032
- Figure 5: North America Nitrile Butadiene Rubber Industry Revenue Share (%), by Country 2024 & 2032
- Figure 6: North America Nitrile Butadiene Rubber Industry Volume Share (%), by Country 2024 & 2032
- Figure 7: Europe Nitrile Butadiene Rubber Industry Revenue (Million), by Country 2024 & 2032
- Figure 8: Europe Nitrile Butadiene Rubber Industry Volume (K Tons), by Country 2024 & 2032
- Figure 9: Europe Nitrile Butadiene Rubber Industry Revenue Share (%), by Country 2024 & 2032
- Figure 10: Europe Nitrile Butadiene Rubber Industry Volume Share (%), by Country 2024 & 2032
- Figure 11: Asia Pacific Nitrile Butadiene Rubber Industry Revenue (Million), by Country 2024 & 2032
- Figure 12: Asia Pacific Nitrile Butadiene Rubber Industry Volume (K Tons), by Country 2024 & 2032
- Figure 13: Asia Pacific Nitrile Butadiene Rubber Industry Revenue Share (%), by Country 2024 & 2032
- Figure 14: Asia Pacific Nitrile Butadiene Rubber Industry Volume Share (%), by Country 2024 & 2032
- Figure 15: South America Nitrile Butadiene Rubber Industry Revenue (Million), by Country 2024 & 2032
- Figure 16: South America Nitrile Butadiene Rubber Industry Volume (K Tons), by Country 2024 & 2032
- Figure 17: South America Nitrile Butadiene Rubber Industry Revenue Share (%), by Country 2024 & 2032
- Figure 18: South America Nitrile Butadiene Rubber Industry Volume Share (%), by Country 2024 & 2032
- Figure 19: MEA Nitrile Butadiene Rubber Industry Revenue (Million), by Country 2024 & 2032
- Figure 20: MEA Nitrile Butadiene Rubber Industry Volume (K Tons), by Country 2024 & 2032
- Figure 21: MEA Nitrile Butadiene Rubber Industry Revenue Share (%), by Country 2024 & 2032
- Figure 22: MEA Nitrile Butadiene Rubber Industry Volume Share (%), by Country 2024 & 2032
- Figure 23: Asia Pacific Nitrile Butadiene Rubber Industry Revenue (Million), by Application 2024 & 2032
- Figure 24: Asia Pacific Nitrile Butadiene Rubber Industry Volume (K Tons), by Application 2024 & 2032
- Figure 25: Asia Pacific Nitrile Butadiene Rubber Industry Revenue Share (%), by Application 2024 & 2032
- Figure 26: Asia Pacific Nitrile Butadiene Rubber Industry Volume Share (%), by Application 2024 & 2032
- Figure 27: Asia Pacific Nitrile Butadiene Rubber Industry Revenue (Million), by End-user Industry 2024 & 2032
- Figure 28: Asia Pacific Nitrile Butadiene Rubber Industry Volume (K Tons), by End-user Industry 2024 & 2032
- Figure 29: Asia Pacific Nitrile Butadiene Rubber Industry Revenue Share (%), by End-user Industry 2024 & 2032
- Figure 30: Asia Pacific Nitrile Butadiene Rubber Industry Volume Share (%), by End-user Industry 2024 & 2032
- Figure 31: Asia Pacific Nitrile Butadiene Rubber Industry Revenue (Million), by Country 2024 & 2032
- Figure 32: Asia Pacific Nitrile Butadiene Rubber Industry Volume (K Tons), by Country 2024 & 2032
- Figure 33: Asia Pacific Nitrile Butadiene Rubber Industry Revenue Share (%), by Country 2024 & 2032
- Figure 34: Asia Pacific Nitrile Butadiene Rubber Industry Volume Share (%), by Country 2024 & 2032
- Figure 35: North America Nitrile Butadiene Rubber Industry Revenue (Million), by Application 2024 & 2032
- Figure 36: North America Nitrile Butadiene Rubber Industry Volume (K Tons), by Application 2024 & 2032
- Figure 37: North America Nitrile Butadiene Rubber Industry Revenue Share (%), by Application 2024 & 2032
- Figure 38: North America Nitrile Butadiene Rubber Industry Volume Share (%), by Application 2024 & 2032
- Figure 39: North America Nitrile Butadiene Rubber Industry Revenue (Million), by End-user Industry 2024 & 2032
- Figure 40: North America Nitrile Butadiene Rubber Industry Volume (K Tons), by End-user Industry 2024 & 2032
- Figure 41: North America Nitrile Butadiene Rubber Industry Revenue Share (%), by End-user Industry 2024 & 2032
- Figure 42: North America Nitrile Butadiene Rubber Industry Volume Share (%), by End-user Industry 2024 & 2032
- Figure 43: North America Nitrile Butadiene Rubber Industry Revenue (Million), by Country 2024 & 2032
- Figure 44: North America Nitrile Butadiene Rubber Industry Volume (K Tons), by Country 2024 & 2032
- Figure 45: North America Nitrile Butadiene Rubber Industry Revenue Share (%), by Country 2024 & 2032
- Figure 46: North America Nitrile Butadiene Rubber Industry Volume Share (%), by Country 2024 & 2032
- Figure 47: Europe Nitrile Butadiene Rubber Industry Revenue (Million), by Application 2024 & 2032
- Figure 48: Europe Nitrile Butadiene Rubber Industry Volume (K Tons), by Application 2024 & 2032
- Figure 49: Europe Nitrile Butadiene Rubber Industry Revenue Share (%), by Application 2024 & 2032
- Figure 50: Europe Nitrile Butadiene Rubber Industry Volume Share (%), by Application 2024 & 2032
- Figure 51: Europe Nitrile Butadiene Rubber Industry Revenue (Million), by End-user Industry 2024 & 2032
- Figure 52: Europe Nitrile Butadiene Rubber Industry Volume (K Tons), by End-user Industry 2024 & 2032
- Figure 53: Europe Nitrile Butadiene Rubber Industry Revenue Share (%), by End-user Industry 2024 & 2032
- Figure 54: Europe Nitrile Butadiene Rubber Industry Volume Share (%), by End-user Industry 2024 & 2032
- Figure 55: Europe Nitrile Butadiene Rubber Industry Revenue (Million), by Country 2024 & 2032
- Figure 56: Europe Nitrile Butadiene Rubber Industry Volume (K Tons), by Country 2024 & 2032
- Figure 57: Europe Nitrile Butadiene Rubber Industry Revenue Share (%), by Country 2024 & 2032
- Figure 58: Europe Nitrile Butadiene Rubber Industry Volume Share (%), by Country 2024 & 2032
- Figure 59: South America Nitrile Butadiene Rubber Industry Revenue (Million), by Application 2024 & 2032
- Figure 60: South America Nitrile Butadiene Rubber Industry Volume (K Tons), by Application 2024 & 2032
- Figure 61: South America Nitrile Butadiene Rubber Industry Revenue Share (%), by Application 2024 & 2032
- Figure 62: South America Nitrile Butadiene Rubber Industry Volume Share (%), by Application 2024 & 2032
- Figure 63: South America Nitrile Butadiene Rubber Industry Revenue (Million), by End-user Industry 2024 & 2032
- Figure 64: South America Nitrile Butadiene Rubber Industry Volume (K Tons), by End-user Industry 2024 & 2032
- Figure 65: South America Nitrile Butadiene Rubber Industry Revenue Share (%), by End-user Industry 2024 & 2032
- Figure 66: South America Nitrile Butadiene Rubber Industry Volume Share (%), by End-user Industry 2024 & 2032
- Figure 67: South America Nitrile Butadiene Rubber Industry Revenue (Million), by Country 2024 & 2032
- Figure 68: South America Nitrile Butadiene Rubber Industry Volume (K Tons), by Country 2024 & 2032
- Figure 69: South America Nitrile Butadiene Rubber Industry Revenue Share (%), by Country 2024 & 2032
- Figure 70: South America Nitrile Butadiene Rubber Industry Volume Share (%), by Country 2024 & 2032
- Figure 71: Middle East and Africa Nitrile Butadiene Rubber Industry Revenue (Million), by Application 2024 & 2032
- Figure 72: Middle East and Africa Nitrile Butadiene Rubber Industry Volume (K Tons), by Application 2024 & 2032
- Figure 73: Middle East and Africa Nitrile Butadiene Rubber Industry Revenue Share (%), by Application 2024 & 2032
- Figure 74: Middle East and Africa Nitrile Butadiene Rubber Industry Volume Share (%), by Application 2024 & 2032
- Figure 75: Middle East and Africa Nitrile Butadiene Rubber Industry Revenue (Million), by End-user Industry 2024 & 2032
- Figure 76: Middle East and Africa Nitrile Butadiene Rubber Industry Volume (K Tons), by End-user Industry 2024 & 2032
- Figure 77: Middle East and Africa Nitrile Butadiene Rubber Industry Revenue Share (%), by End-user Industry 2024 & 2032
- Figure 78: Middle East and Africa Nitrile Butadiene Rubber Industry Volume Share (%), by End-user Industry 2024 & 2032
- Figure 79: Middle East and Africa Nitrile Butadiene Rubber Industry Revenue (Million), by Country 2024 & 2032
- Figure 80: Middle East and Africa Nitrile Butadiene Rubber Industry Volume (K Tons), by Country 2024 & 2032
- Figure 81: Middle East and Africa Nitrile Butadiene Rubber Industry Revenue Share (%), by Country 2024 & 2032
- Figure 82: Middle East and Africa Nitrile Butadiene Rubber Industry Volume Share (%), by Country 2024 & 2032
List of Tables
- Table 1: Global Nitrile Butadiene Rubber Industry Revenue Million Forecast, by Region 2019 & 2032
- Table 2: Global Nitrile Butadiene Rubber Industry Volume K Tons Forecast, by Region 2019 & 2032
- Table 3: Global Nitrile Butadiene Rubber Industry Revenue Million Forecast, by Application 2019 & 2032
- Table 4: Global Nitrile Butadiene Rubber Industry Volume K Tons Forecast, by Application 2019 & 2032
- Table 5: Global Nitrile Butadiene Rubber Industry Revenue Million Forecast, by End-user Industry 2019 & 2032
- Table 6: Global Nitrile Butadiene Rubber Industry Volume K Tons Forecast, by End-user Industry 2019 & 2032
- Table 7: Global Nitrile Butadiene Rubber Industry Revenue Million Forecast, by Region 2019 & 2032
- Table 8: Global Nitrile Butadiene Rubber Industry Volume K Tons Forecast, by Region 2019 & 2032
- Table 9: Global Nitrile Butadiene Rubber Industry Revenue Million Forecast, by Country 2019 & 2032
- Table 10: Global Nitrile Butadiene Rubber Industry Volume K Tons Forecast, by Country 2019 & 2032
- Table 11: United States Nitrile Butadiene Rubber Industry Revenue (Million) Forecast, by Application 2019 & 2032
- Table 12: United States Nitrile Butadiene Rubber Industry Volume (K Tons) Forecast, by Application 2019 & 2032
- Table 13: Canada Nitrile Butadiene Rubber Industry Revenue (Million) Forecast, by Application 2019 & 2032
- Table 14: Canada Nitrile Butadiene Rubber Industry Volume (K Tons) Forecast, by Application 2019 & 2032
- Table 15: Mexico Nitrile Butadiene Rubber Industry Revenue (Million) Forecast, by Application 2019 & 2032
- Table 16: Mexico Nitrile Butadiene Rubber Industry Volume (K Tons) Forecast, by Application 2019 & 2032
- Table 17: Global Nitrile Butadiene Rubber Industry Revenue Million Forecast, by Country 2019 & 2032
- Table 18: Global Nitrile Butadiene Rubber Industry Volume K Tons Forecast, by Country 2019 & 2032
- Table 19: Germany Nitrile Butadiene Rubber Industry Revenue (Million) Forecast, by Application 2019 & 2032
- Table 20: Germany Nitrile Butadiene Rubber Industry Volume (K Tons) Forecast, by Application 2019 & 2032
- Table 21: France Nitrile Butadiene Rubber Industry Revenue (Million) Forecast, by Application 2019 & 2032
- Table 22: France Nitrile Butadiene Rubber Industry Volume (K Tons) Forecast, by Application 2019 & 2032
- Table 23: Italy Nitrile Butadiene Rubber Industry Revenue (Million) Forecast, by Application 2019 & 2032
- Table 24: Italy Nitrile Butadiene Rubber Industry Volume (K Tons) Forecast, by Application 2019 & 2032
- Table 25: United Kingdom Nitrile Butadiene Rubber Industry Revenue (Million) Forecast, by Application 2019 & 2032
- Table 26: United Kingdom Nitrile Butadiene Rubber Industry Volume (K Tons) Forecast, by Application 2019 & 2032
- Table 27: Netherlands Nitrile Butadiene Rubber Industry Revenue (Million) Forecast, by Application 2019 & 2032
- Table 28: Netherlands Nitrile Butadiene Rubber Industry Volume (K Tons) Forecast, by Application 2019 & 2032
- Table 29: Rest of Europe Nitrile Butadiene Rubber Industry Revenue (Million) Forecast, by Application 2019 & 2032
- Table 30: Rest of Europe Nitrile Butadiene Rubber Industry Volume (K Tons) Forecast, by Application 2019 & 2032
- Table 31: Global Nitrile Butadiene Rubber Industry Revenue Million Forecast, by Country 2019 & 2032
- Table 32: Global Nitrile Butadiene Rubber Industry Volume K Tons Forecast, by Country 2019 & 2032
- Table 33: China Nitrile Butadiene Rubber Industry Revenue (Million) Forecast, by Application 2019 & 2032
- Table 34: China Nitrile Butadiene Rubber Industry Volume (K Tons) Forecast, by Application 2019 & 2032
- Table 35: Japan Nitrile Butadiene Rubber Industry Revenue (Million) Forecast, by Application 2019 & 2032
- Table 36: Japan Nitrile Butadiene Rubber Industry Volume (K Tons) Forecast, by Application 2019 & 2032
- Table 37: India Nitrile Butadiene Rubber Industry Revenue (Million) Forecast, by Application 2019 & 2032
- Table 38: India Nitrile Butadiene Rubber Industry Volume (K Tons) Forecast, by Application 2019 & 2032
- Table 39: South Korea Nitrile Butadiene Rubber Industry Revenue (Million) Forecast, by Application 2019 & 2032
- Table 40: South Korea Nitrile Butadiene Rubber Industry Volume (K Tons) Forecast, by Application 2019 & 2032
- Table 41: Taiwan Nitrile Butadiene Rubber Industry Revenue (Million) Forecast, by Application 2019 & 2032
- Table 42: Taiwan Nitrile Butadiene Rubber Industry Volume (K Tons) Forecast, by Application 2019 & 2032
- Table 43: Australia Nitrile Butadiene Rubber Industry Revenue (Million) Forecast, by Application 2019 & 2032
- Table 44: Australia Nitrile Butadiene Rubber Industry Volume (K Tons) Forecast, by Application 2019 & 2032
- Table 45: Rest of Asia-Pacific Nitrile Butadiene Rubber Industry Revenue (Million) Forecast, by Application 2019 & 2032
- Table 46: Rest of Asia-Pacific Nitrile Butadiene Rubber Industry Volume (K Tons) Forecast, by Application 2019 & 2032
- Table 47: Global Nitrile Butadiene Rubber Industry Revenue Million Forecast, by Country 2019 & 2032
- Table 48: Global Nitrile Butadiene Rubber Industry Volume K Tons Forecast, by Country 2019 & 2032
- Table 49: Brazil Nitrile Butadiene Rubber Industry Revenue (Million) Forecast, by Application 2019 & 2032
- Table 50: Brazil Nitrile Butadiene Rubber Industry Volume (K Tons) Forecast, by Application 2019 & 2032
- Table 51: Argentina Nitrile Butadiene Rubber Industry Revenue (Million) Forecast, by Application 2019 & 2032
- Table 52: Argentina Nitrile Butadiene Rubber Industry Volume (K Tons) Forecast, by Application 2019 & 2032
- Table 53: Rest of South America Nitrile Butadiene Rubber Industry Revenue (Million) Forecast, by Application 2019 & 2032
- Table 54: Rest of South America Nitrile Butadiene Rubber Industry Volume (K Tons) Forecast, by Application 2019 & 2032
- Table 55: Global Nitrile Butadiene Rubber Industry Revenue Million Forecast, by Country 2019 & 2032
- Table 56: Global Nitrile Butadiene Rubber Industry Volume K Tons Forecast, by Country 2019 & 2032
- Table 57: Middle East Nitrile Butadiene Rubber Industry Revenue (Million) Forecast, by Application 2019 & 2032
- Table 58: Middle East Nitrile Butadiene Rubber Industry Volume (K Tons) Forecast, by Application 2019 & 2032
- Table 59: Africa Nitrile Butadiene Rubber Industry Revenue (Million) Forecast, by Application 2019 & 2032
- Table 60: Africa Nitrile Butadiene Rubber Industry Volume (K Tons) Forecast, by Application 2019 & 2032
- Table 61: Global Nitrile Butadiene Rubber Industry Revenue Million Forecast, by Application 2019 & 2032
- Table 62: Global Nitrile Butadiene Rubber Industry Volume K Tons Forecast, by Application 2019 & 2032
- Table 63: Global Nitrile Butadiene Rubber Industry Revenue Million Forecast, by End-user Industry 2019 & 2032
- Table 64: Global Nitrile Butadiene Rubber Industry Volume K Tons Forecast, by End-user Industry 2019 & 2032
- Table 65: Global Nitrile Butadiene Rubber Industry Revenue Million Forecast, by Country 2019 & 2032
- Table 66: Global Nitrile Butadiene Rubber Industry Volume K Tons Forecast, by Country 2019 & 2032
- Table 67: China Nitrile Butadiene Rubber Industry Revenue (Million) Forecast, by Application 2019 & 2032
- Table 68: China Nitrile Butadiene Rubber Industry Volume (K Tons) Forecast, by Application 2019 & 2032
- Table 69: India Nitrile Butadiene Rubber Industry Revenue (Million) Forecast, by Application 2019 & 2032
- Table 70: India Nitrile Butadiene Rubber Industry Volume (K Tons) Forecast, by Application 2019 & 2032
- Table 71: Japan Nitrile Butadiene Rubber Industry Revenue (Million) Forecast, by Application 2019 & 2032
- Table 72: Japan Nitrile Butadiene Rubber Industry Volume (K Tons) Forecast, by Application 2019 & 2032
- Table 73: South Korea Nitrile Butadiene Rubber Industry Revenue (Million) Forecast, by Application 2019 & 2032
- Table 74: South Korea Nitrile Butadiene Rubber Industry Volume (K Tons) Forecast, by Application 2019 & 2032
- Table 75: Malaysia Nitrile Butadiene Rubber Industry Revenue (Million) Forecast, by Application 2019 & 2032
- Table 76: Malaysia Nitrile Butadiene Rubber Industry Volume (K Tons) Forecast, by Application 2019 & 2032
- Table 77: Thailand Nitrile Butadiene Rubber Industry Revenue (Million) Forecast, by Application 2019 & 2032
- Table 78: Thailand Nitrile Butadiene Rubber Industry Volume (K Tons) Forecast, by Application 2019 & 2032
- Table 79: Vietnam Nitrile Butadiene Rubber Industry Revenue (Million) Forecast, by Application 2019 & 2032
- Table 80: Vietnam Nitrile Butadiene Rubber Industry Volume (K Tons) Forecast, by Application 2019 & 2032
- Table 81: Indonesia Nitrile Butadiene Rubber Industry Revenue (Million) Forecast, by Application 2019 & 2032
- Table 82: Indonesia Nitrile Butadiene Rubber Industry Volume (K Tons) Forecast, by Application 2019 & 2032
- Table 83: Rest of Asia Pacific Nitrile Butadiene Rubber Industry Revenue (Million) Forecast, by Application 2019 & 2032
- Table 84: Rest of Asia Pacific Nitrile Butadiene Rubber Industry Volume (K Tons) Forecast, by Application 2019 & 2032
- Table 85: Global Nitrile Butadiene Rubber Industry Revenue Million Forecast, by Application 2019 & 2032
- Table 86: Global Nitrile Butadiene Rubber Industry Volume K Tons Forecast, by Application 2019 & 2032
- Table 87: Global Nitrile Butadiene Rubber Industry Revenue Million Forecast, by End-user Industry 2019 & 2032
- Table 88: Global Nitrile Butadiene Rubber Industry Volume K Tons Forecast, by End-user Industry 2019 & 2032
- Table 89: Global Nitrile Butadiene Rubber Industry Revenue Million Forecast, by Country 2019 & 2032
- Table 90: Global Nitrile Butadiene Rubber Industry Volume K Tons Forecast, by Country 2019 & 2032
- Table 91: United States Nitrile Butadiene Rubber Industry Revenue (Million) Forecast, by Application 2019 & 2032
- Table 92: United States Nitrile Butadiene Rubber Industry Volume (K Tons) Forecast, by Application 2019 & 2032
- Table 93: Canada Nitrile Butadiene Rubber Industry Revenue (Million) Forecast, by Application 2019 & 2032
- Table 94: Canada Nitrile Butadiene Rubber Industry Volume (K Tons) Forecast, by Application 2019 & 2032
- Table 95: Mexico Nitrile Butadiene Rubber Industry Revenue (Million) Forecast, by Application 2019 & 2032
- Table 96: Mexico Nitrile Butadiene Rubber Industry Volume (K Tons) Forecast, by Application 2019 & 2032
- Table 97: Global Nitrile Butadiene Rubber Industry Revenue Million Forecast, by Application 2019 & 2032
- Table 98: Global Nitrile Butadiene Rubber Industry Volume K Tons Forecast, by Application 2019 & 2032
- Table 99: Global Nitrile Butadiene Rubber Industry Revenue Million Forecast, by End-user Industry 2019 & 2032
- Table 100: Global Nitrile Butadiene Rubber Industry Volume K Tons Forecast, by End-user Industry 2019 & 2032
- Table 101: Global Nitrile Butadiene Rubber Industry Revenue Million Forecast, by Country 2019 & 2032
- Table 102: Global Nitrile Butadiene Rubber Industry Volume K Tons Forecast, by Country 2019 & 2032
- Table 103: Germany Nitrile Butadiene Rubber Industry Revenue (Million) Forecast, by Application 2019 & 2032
- Table 104: Germany Nitrile Butadiene Rubber Industry Volume (K Tons) Forecast, by Application 2019 & 2032
- Table 105: United Kingdom Nitrile Butadiene Rubber Industry Revenue (Million) Forecast, by Application 2019 & 2032
- Table 106: United Kingdom Nitrile Butadiene Rubber Industry Volume (K Tons) Forecast, by Application 2019 & 2032
- Table 107: Italy Nitrile Butadiene Rubber Industry Revenue (Million) Forecast, by Application 2019 & 2032
- Table 108: Italy Nitrile Butadiene Rubber Industry Volume (K Tons) Forecast, by Application 2019 & 2032
- Table 109: France Nitrile Butadiene Rubber Industry Revenue (Million) Forecast, by Application 2019 & 2032
- Table 110: France Nitrile Butadiene Rubber Industry Volume (K Tons) Forecast, by Application 2019 & 2032
- Table 111: Spain Nitrile Butadiene Rubber Industry Revenue (Million) Forecast, by Application 2019 & 2032
- Table 112: Spain Nitrile Butadiene Rubber Industry Volume (K Tons) Forecast, by Application 2019 & 2032
- Table 113: Turkey Nitrile Butadiene Rubber Industry Revenue (Million) Forecast, by Application 2019 & 2032
- Table 114: Turkey Nitrile Butadiene Rubber Industry Volume (K Tons) Forecast, by Application 2019 & 2032
- Table 115: Russia Nitrile Butadiene Rubber Industry Revenue (Million) Forecast, by Application 2019 & 2032
- Table 116: Russia Nitrile Butadiene Rubber Industry Volume (K Tons) Forecast, by Application 2019 & 2032
- Table 117: NORDIC Nitrile Butadiene Rubber Industry Revenue (Million) Forecast, by Application 2019 & 2032
- Table 118: NORDIC Nitrile Butadiene Rubber Industry Volume (K Tons) Forecast, by Application 2019 & 2032
- Table 119: Rest of Europe Nitrile Butadiene Rubber Industry Revenue (Million) Forecast, by Application 2019 & 2032
- Table 120: Rest of Europe Nitrile Butadiene Rubber Industry Volume (K Tons) Forecast, by Application 2019 & 2032
- Table 121: Global Nitrile Butadiene Rubber Industry Revenue Million Forecast, by Application 2019 & 2032
- Table 122: Global Nitrile Butadiene Rubber Industry Volume K Tons Forecast, by Application 2019 & 2032
- Table 123: Global Nitrile Butadiene Rubber Industry Revenue Million Forecast, by End-user Industry 2019 & 2032
- Table 124: Global Nitrile Butadiene Rubber Industry Volume K Tons Forecast, by End-user Industry 2019 & 2032
- Table 125: Global Nitrile Butadiene Rubber Industry Revenue Million Forecast, by Country 2019 & 2032
- Table 126: Global Nitrile Butadiene Rubber Industry Volume K Tons Forecast, by Country 2019 & 2032
- Table 127: Brazil Nitrile Butadiene Rubber Industry Revenue (Million) Forecast, by Application 2019 & 2032
- Table 128: Brazil Nitrile Butadiene Rubber Industry Volume (K Tons) Forecast, by Application 2019 & 2032
- Table 129: Argentina Nitrile Butadiene Rubber Industry Revenue (Million) Forecast, by Application 2019 & 2032
- Table 130: Argentina Nitrile Butadiene Rubber Industry Volume (K Tons) Forecast, by Application 2019 & 2032
- Table 131: Colombia Nitrile Butadiene Rubber Industry Revenue (Million) Forecast, by Application 2019 & 2032
- Table 132: Colombia Nitrile Butadiene Rubber Industry Volume (K Tons) Forecast, by Application 2019 & 2032
- Table 133: Rest of South America Nitrile Butadiene Rubber Industry Revenue (Million) Forecast, by Application 2019 & 2032
- Table 134: Rest of South America Nitrile Butadiene Rubber Industry Volume (K Tons) Forecast, by Application 2019 & 2032
- Table 135: Global Nitrile Butadiene Rubber Industry Revenue Million Forecast, by Application 2019 & 2032
- Table 136: Global Nitrile Butadiene Rubber Industry Volume K Tons Forecast, by Application 2019 & 2032
- Table 137: Global Nitrile Butadiene Rubber Industry Revenue Million Forecast, by End-user Industry 2019 & 2032
- Table 138: Global Nitrile Butadiene Rubber Industry Volume K Tons Forecast, by End-user Industry 2019 & 2032
- Table 139: Global Nitrile Butadiene Rubber Industry Revenue Million Forecast, by Country 2019 & 2032
- Table 140: Global Nitrile Butadiene Rubber Industry Volume K Tons Forecast, by Country 2019 & 2032
- Table 141: Saudi Arabia Nitrile Butadiene Rubber Industry Revenue (Million) Forecast, by Application 2019 & 2032
- Table 142: Saudi Arabia Nitrile Butadiene Rubber Industry Volume (K Tons) Forecast, by Application 2019 & 2032
- Table 143: South Africa Nitrile Butadiene Rubber Industry Revenue (Million) Forecast, by Application 2019 & 2032
- Table 144: South Africa Nitrile Butadiene Rubber Industry Volume (K Tons) Forecast, by Application 2019 & 2032
- Table 145: Nigeria Nitrile Butadiene Rubber Industry Revenue (Million) Forecast, by Application 2019 & 2032
- Table 146: Nigeria Nitrile Butadiene Rubber Industry Volume (K Tons) Forecast, by Application 2019 & 2032
- Table 147: Egypt Nitrile Butadiene Rubber Industry Revenue (Million) Forecast, by Application 2019 & 2032
- Table 148: Egypt Nitrile Butadiene Rubber Industry Volume (K Tons) Forecast, by Application 2019 & 2032
- Table 149: Qatar Nitrile Butadiene Rubber Industry Revenue (Million) Forecast, by Application 2019 & 2032
- Table 150: Qatar Nitrile Butadiene Rubber Industry Volume (K Tons) Forecast, by Application 2019 & 2032
- Table 151: UAE Nitrile Butadiene Rubber Industry Revenue (Million) Forecast, by Application 2019 & 2032
- Table 152: UAE Nitrile Butadiene Rubber Industry Volume (K Tons) Forecast, by Application 2019 & 2032
- Table 153: Rest of Middle East and Africa Nitrile Butadiene Rubber Industry Revenue (Million) Forecast, by Application 2019 & 2032
- Table 154: Rest of Middle East and Africa Nitrile Butadiene Rubber Industry Volume (K Tons) Forecast, by Application 2019 & 2032
Frequently Asked Questions
1. What is the projected Compound Annual Growth Rate (CAGR) of the Nitrile Butadiene Rubber Industry?
The projected CAGR is approximately 6.31%.
2. Which companies are prominent players in the Nitrile Butadiene Rubber Industry?
Key companies in the market include Versalis S p A, ARLANXEO, Synthos, ZEON CORPORATION*List Not Exhaustive, Dynasol Group, ENEOS Materials Corporation, KUMHO PETROCHEMICAL, SIBUR, Synthomer PLC, LG Chem, China Petrochemical Corporation (Sinopec), Apcotex, Lanxess, TSRC.
3. What are the main segments of the Nitrile Butadiene Rubber Industry?
The market segments include Application, End-user Industry.
4. Can you provide details about the market size?
The market size is estimated to be USD 2.51 Million as of 2022.
5. What are some drivers contributing to market growth?
Expanding Automotive Industry; Industrial and Infrastructure Development Projects.
6. What are the notable trends driving market growth?
Automotive and Transportation Sector Dominates the Market.
7. Are there any restraints impacting market growth?
Availability of Substitute Materials; Fluctuating Raw Material Prices.
8. Can you provide examples of recent developments in the market?
August 2022: Kumho Petrochemical will be KRW6,000 billion (~USD 5.10 billion) into existing and new businesses in the next five years. As part of the initiative, Kumho will invest KRW 3,300 billion (~USD 2.81 billion) in its core business areas, which include nitrile butadiene latex (NB latex) production and styrene solution butadiene rubber (SSBR) manufacturing.
9. What pricing options are available for accessing the report?
Pricing options include single-user, multi-user, and enterprise licenses priced at USD 4750, USD 5250, and USD 8750 respectively.
10. Is the market size provided in terms of value or volume?
The market size is provided in terms of value, measured in Million and volume, measured in K Tons.
11. Are there any specific market keywords associated with the report?
Yes, the market keyword associated with the report is "Nitrile Butadiene Rubber Industry," which aids in identifying and referencing the specific market segment covered.
12. How do I determine which pricing option suits my needs best?
The pricing options vary based on user requirements and access needs. Individual users may opt for single-user licenses, while businesses requiring broader access may choose multi-user or enterprise licenses for cost-effective access to the report.
13. Are there any additional resources or data provided in the Nitrile Butadiene Rubber Industry report?
While the report offers comprehensive insights, it's advisable to review the specific contents or supplementary materials provided to ascertain if additional resources or data are available.
14. How can I stay updated on further developments or reports in the Nitrile Butadiene Rubber Industry?
To stay informed about further developments, trends, and reports in the Nitrile Butadiene Rubber Industry, consider subscribing to industry newsletters, following relevant companies and organizations, or regularly checking reputable industry news sources and publications.
Methodology
Step 1 - Identification of Relevant Samples Size from Population Database


Step 2 - Approaches for Defining Global Market Size (Value, Volume* & Price*)

Note*: In applicable scenarios
Step 3 - Data Sources
Primary Research
- Web Analytics
- Survey Reports
- Research Institute
- Latest Research Reports
- Opinion Leaders
Secondary Research
- Annual Reports
- White Paper
- Latest Press Release
- Industry Association
- Paid Database
- Investor Presentations

Step 4 - Data Triangulation
Involves using different sources of information in order to increase the validity of a study
These sources are likely to be stakeholders in a program - participants, other researchers, program staff, other community members, and so on.
Then we put all data in single framework & apply various statistical tools to find out the dynamic on the market.
During the analysis stage, feedback from the stakeholder groups would be compared to determine areas of agreement as well as areas of divergence


