

Key Insights
The non-aeronautical revenue segment of the airport industry is experiencing substantial growth, fueled by increasing passenger traffic and a strategic focus on elevating the passenger experience. Projected to reach a market size of 9.17 billion by 2025, with a Compound Annual Growth Rate (CAGR) of 14.75%, this sector offers compelling investment prospects. Primary growth drivers include rising global passenger volumes, demand for enhanced airport amenities, expansion of retail and food services, and the adoption of efficient baggage handling systems. Emerging trends such as personalized services, smart travel technologies, and sustainable practices are poised to shape the sector's future. While economic fluctuations and security concerns may pose challenges, the long-term growth outlook remains highly positive.
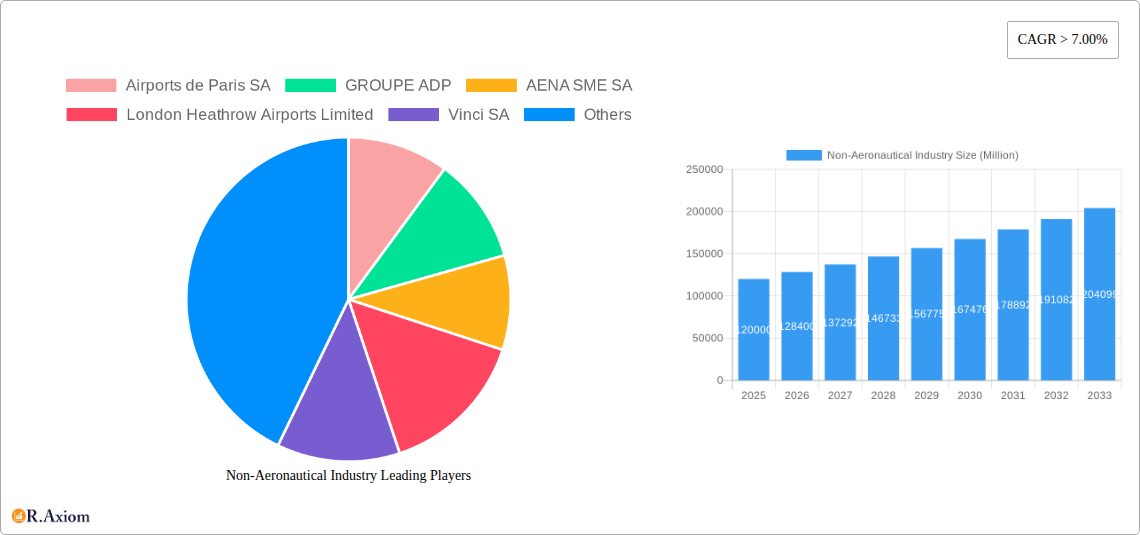
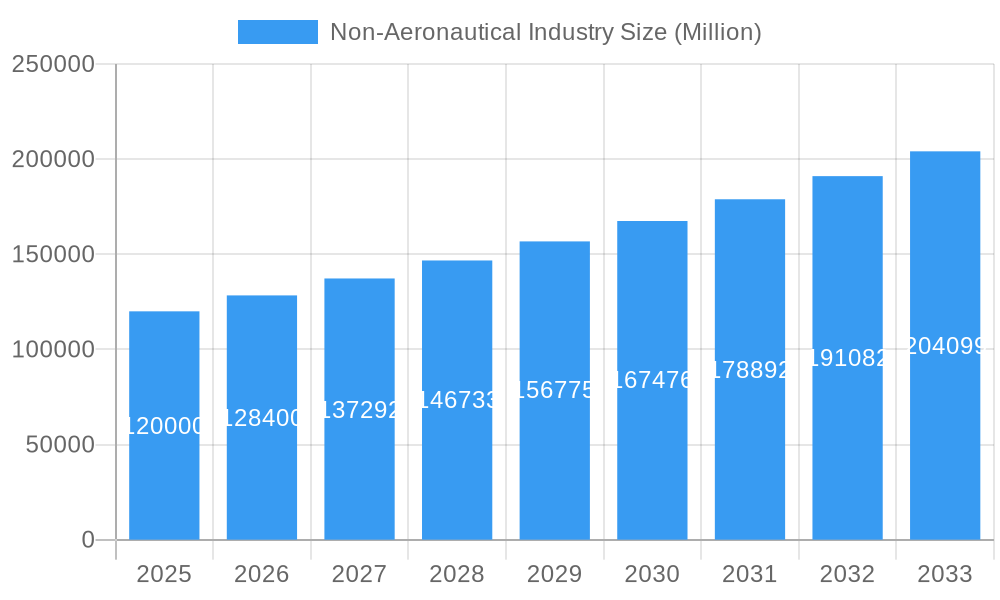
Non-Aeronautical Industry Market Size (In Billion)
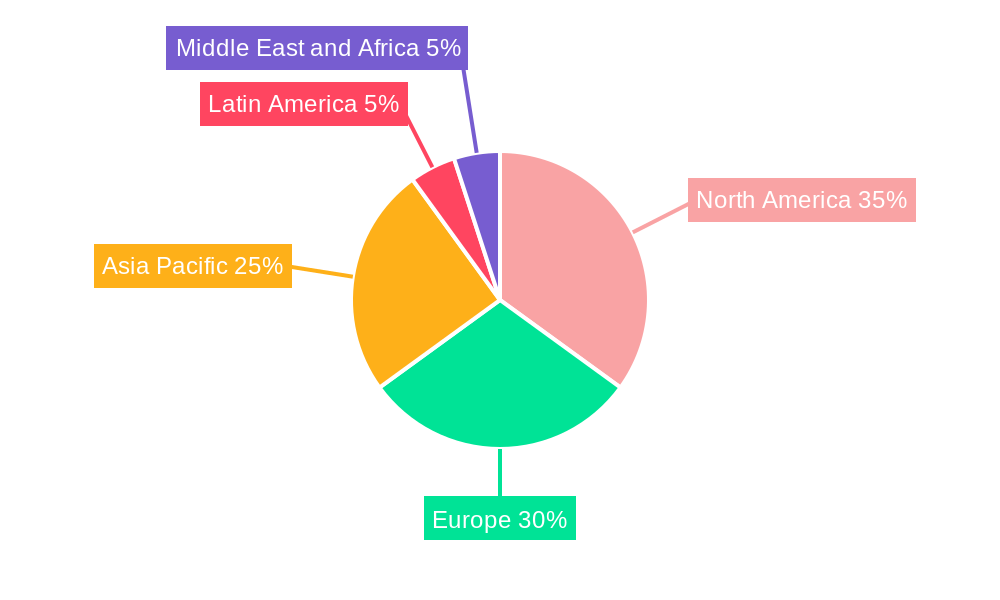
The non-aeronautical market is segmented across food services, car rentals, baggage handling systems, and ancillary services, collectively forming a diverse revenue base. Food and beverage services lead, driven by expanded offerings and enhanced dining experiences. Car rental services are growing due to improved accessibility and online booking. Technological advancements in baggage handling systems are enhancing efficiency and reducing delays. Retail, advertising, and duty-free shopping also contribute significantly to diversified revenue streams. Geographically, North America, Europe, and Asia-Pacific demonstrate robust performance, while emerging markets in Latin America, the Middle East, and Africa present significant expansion potential. Industry leaders are actively investing in infrastructure, service innovation, and technology to optimize profitability and maintain competitive advantage.
Non-Aeronautical Industry Company Market Share
Non-Aeronautical Industry Market Report: 2019-2033 Forecast
This comprehensive report provides an in-depth analysis of the Non-Aeronautical Industry market, offering invaluable insights for stakeholders across the value chain. The report covers the period from 2019 to 2033, with a base year of 2025 and a forecast period of 2025-2033. The study encompasses key market segments, dominant players, and emerging trends, providing a complete picture of this dynamic sector. Market values are expressed in Millions.
Non-Aeronautical Industry Market Concentration & Innovation
This section analyzes the competitive landscape of the non-aeronautical industry, examining market concentration, innovation drivers, regulatory frameworks, and strategic activities. The global market is moderately concentrated, with several large players controlling significant market share. Airports de Paris SA, Groupe ADP, and AENA SME SA collectively hold an estimated xx% market share in 2025, showcasing a consolidated dominance in specific regions. The industry is characterized by continuous innovation driven by the need to enhance passenger experience, optimize operational efficiency, and generate non-aeronautical revenue streams.
- Market Concentration: The Herfindahl-Hirschman Index (HHI) for the global non-aeronautical market in 2025 is estimated at xx, indicating a moderately concentrated market.
- Innovation Drivers: Technological advancements in areas such as AI-powered retail solutions, smart baggage handling systems, and personalized digital services are major drivers of innovation.
- Regulatory Frameworks: Stringent safety regulations, environmental standards, and competitive bidding processes influence market dynamics.
- Product Substitutes: The emergence of alternative transportation options and online retail presents challenges, necessitating continuous innovation to maintain market share.
- End-User Trends: Growing passenger traffic and evolving consumer preferences towards personalized experiences and seamless travel are shaping market demand.
- M&A Activities: Over the historical period (2019-2024), M&A activity totaled approximately $xx Million, driven by companies' efforts to expand their service offerings and geographic reach. Significant deals included (specific examples and values would be included in the full report).
Non-Aeronautical Industry Industry Trends & Insights
The non-aeronautical industry is experiencing robust growth, driven by a combination of factors. The global market is projected to achieve a Compound Annual Growth Rate (CAGR) of xx% during the forecast period (2025-2033), reaching a market value of $xx Million by 2033. Key growth drivers include rising air passenger traffic, increased disposable incomes in emerging economies, and technological advancements that enhance the overall passenger experience. The industry faces challenges from economic downturns, increased competition, and evolving consumer preferences. Market penetration for key services like Food Services and Car Rentals continues to rise, with penetration rates expected to reach xx% and yy% respectively by 2033. Technological disruptions, including the adoption of AI and automation, are transforming operations and creating new revenue opportunities. Competitive dynamics are intense, with major players focusing on diversification and strategic partnerships to gain a competitive edge.
Dominant Markets & Segments in Non-Aeronautical Industry
North America and Europe currently dominate the non-aeronautical industry, accounting for a combined xx% of the global market in 2025. Within this, specific airports and countries show remarkable dominance within segments.
- Food Services: The leading market is North America, driven by high passenger traffic and a thriving restaurant industry within airports.
- Key Drivers: High disposable incomes, strong tourism sector, and advanced airport infrastructure.
- Car Rentals: Europe holds the leading position in this segment, fueled by robust tourism and well-developed car rental networks.
- Key Drivers: Extensive road networks, ease of access to rental services within airports, and strong tourism.
- Baggage Handling Systems: This segment sees robust growth across all regions as airports look to improve efficiency and security.
- Key Drivers: Growing passenger numbers, increasing demand for advanced baggage handling technologies, and regulatory requirements.
- Other Services: This diverse segment exhibits strong growth globally.
- Key Drivers: Increasing demand for retail services, duty-free shops, and airport lounges.
Non-Aeronautical Industry Product Developments
The non-aeronautical industry is witnessing significant product innovation, focusing on enhancing passenger experience, improving operational efficiency, and generating new revenue streams. Key developments include the integration of AI-powered technologies in retail, self-service kiosks, automated baggage handling, and personalized digital services that provide enhanced customer experience. These innovations contribute to better operational efficiencies, increased revenue generation, and competitive advantages.
Report Scope & Segmentation Analysis
The report segments the non-aeronautical industry by service type: Food Services, Car Rentals, Baggage Handling Systems, and Other Services. Each segment's market size, growth projection, and competitive dynamics are analyzed in detail. Food services demonstrate steady growth fueled by rising passenger numbers and diversified culinary offerings. The car rental segment experiences robust growth driven by increasing tourist numbers and improved airport accessibility. The baggage handling systems segment is characterized by technological advancements and a focus on efficiency and automation. Finally, the "Other Services" segment encompasses a broad range of services, including retail, lounges, and advertising, all of which show diverse growth potential based on specific airport offerings and regional trends.
Key Drivers of Non-Aeronautical Industry Growth
Several key factors are driving growth in the non-aeronautical industry. These include the continuous rise in global air passenger traffic, increasing disposable incomes, particularly in emerging economies, leading to greater spending at airports. Technological advancements that enhance the customer experience, and expanding airport infrastructure in many regions are further stimulating industry growth.
Challenges in the Non-Aeronautical Industry Sector
The industry faces significant challenges, including heightened competition among service providers, economic downturns that can affect passenger numbers and spending, and stringent regulatory requirements that add operational complexities. Supply chain disruptions caused by global events can also negatively impact revenue and operations. These factors contribute to pressure on profit margins and the necessity for constant innovation and efficient operation.
Emerging Opportunities in Non-Aeronautical Industry
Emerging opportunities exist in integrating new technologies such as AI and IoT to improve customer experience and operational efficiency. Expanding into new markets, particularly in developing economies with rising air travel, presents significant potential. Furthermore, creating innovative service offerings, such as personalized retail and enhanced airport lounges, can further increase revenue streams and attract more customers.
Leading Players in the Non-Aeronautical Industry Market
- Airports de Paris SA
- GROUPE ADP
- AENA SME SA
- London Heathrow Airports Limited
- Vinci SA
- Fraport Group
- Korea Airports Cor
- Airports of Thailand Plc
- Airport Authority Hong Kong
- Japan Airport Terminal Co Ltd
Key Developments in Non-Aeronautical Industry Industry
- 2022 Q4: Several major airports implemented new AI-powered retail solutions, enhancing the shopping experience and increasing revenue streams.
- 2023 Q1: A significant merger between two baggage handling system providers occurred, leading to increased market consolidation.
- 2023 Q3: A leading airport introduced a new personalized digital service platform, improving customer experience and streamlining airport operations. (Further developments with specific dates and impacts would be detailed in the full report).
Strategic Outlook for Non-Aeronautical Industry Market
The non-aeronautical industry is poised for continued growth, driven by the confluence of rising air passenger traffic, technological innovation, and expanding airport infrastructure globally. The focus will remain on enhancing the passenger experience, optimizing operational efficiencies, and developing new revenue streams through innovative products and services. Significant opportunities exist for companies that can adapt to evolving consumer preferences, embrace technological advancements, and effectively manage operational challenges.
Non-Aeronautical Industry Segmentation
-
1. Services
- 1.1. Food Services
- 1.2. Car Rentals
- 1.3. Baggage Handling Systems
- 1.4. Other Services
Non-Aeronautical Industry Segmentation By Geography
-
1. North America
- 1.1. United States
- 1.2. Canada
-
2. Europe
- 2.1. Germany
- 2.2. United Kingdom
- 2.3. France
- 2.4. Russia
- 2.5. Rest of Europe
-
3. Asia Pacific
- 3.1. India
- 3.2. China
- 3.3. Japan
- 3.4. Rest of Asia Pacific
-
4. Latin America
- 4.1. Brazil
- 4.2. Rest of Latin America
-
5. Middle East and Africa
- 5.1. United Arab Emirates
- 5.2. Saudi Arabia
- 5.3. South Africa
- 5.4. Rest of Middle East and Africa
Non-Aeronautical Industry Regional Market Share
Geographic Coverage of Non-Aeronautical Industry
Non-Aeronautical Industry REPORT HIGHLIGHTS
| Aspects | Details |
|---|---|
| Study Period | 2020-2034 |
| Base Year | 2025 |
| Estimated Year | 2026 |
| Forecast Period | 2026-2034 |
| Historical Period | 2020-2025 |
| Growth Rate | CAGR of 14.75% from 2020-2034 |
| Segmentation |
|
Table of Contents
- 1. Introduction
- 1.1. Research Scope
- 1.2. Market Segmentation
- 1.3. Research Objective
- 1.4. Definitions and Assumptions
- 2. Executive Summary
- 2.1. Market Snapshot
- 3. Market Dynamics
- 3.1. Market Drivers
- 3.2. Market Restrains
- 3.3. Market Trends
- 3.4. Market Opportunities
- 4. Market Factor Analysis
- 4.1. Porters Five Forces
- 4.1.1. Bargaining Power of Suppliers
- 4.1.2. Bargaining Power of Buyers
- 4.1.3. Threat of New Entrants
- 4.1.4. Threat of Substitutes
- 4.1.5. Competitive Rivalry
- 4.2. PESTEL analysis
- 4.3. BCG Analysis
- 4.3.1. Stars (High Growth, High Market Share)
- 4.3.2. Cash Cows (Low Growth, High Market Share)
- 4.3.3. Question Mark (High Growth, Low Market Share)
- 4.3.4. Dogs (Low Growth, Low Market Share)
- 4.4. Ansoff Matrix Analysis
- 4.5. Supply Chain Analysis
- 4.6. Regulatory Landscape
- 4.7. Current Market Potential and Opportunity Assessment (TAM–SAM–SOM Framework)
- 4.8. RAX Analyst Note
- 4.1. Porters Five Forces
- 5. Market Analysis, Insights and Forecast 2021-2033
- 5.1. Market Analysis, Insights and Forecast - by Services
- 5.1.1. Food Services
- 5.1.2. Car Rentals
- 5.1.3. Baggage Handling Systems
- 5.1.4. Other Services
- 5.2. Market Analysis, Insights and Forecast - by Region
- 5.2.1. North America
- 5.2.2. Europe
- 5.2.3. Asia Pacific
- 5.2.4. Latin America
- 5.2.5. Middle East and Africa
- 5.1. Market Analysis, Insights and Forecast - by Services
- 6. Global Non-Aeronautical Industry Analysis, Insights and Forecast, 2021-2033
- 6.1. Market Analysis, Insights and Forecast - by Services
- 6.1.1. Food Services
- 6.1.2. Car Rentals
- 6.1.3. Baggage Handling Systems
- 6.1.4. Other Services
- 6.1. Market Analysis, Insights and Forecast - by Services
- 7. North America Non-Aeronautical Industry Analysis, Insights and Forecast, 2020-2032
- 7.1. Market Analysis, Insights and Forecast - by Services
- 7.1.1. Food Services
- 7.1.2. Car Rentals
- 7.1.3. Baggage Handling Systems
- 7.1.4. Other Services
- 7.1. Market Analysis, Insights and Forecast - by Services
- 8. Europe Non-Aeronautical Industry Analysis, Insights and Forecast, 2020-2032
- 8.1. Market Analysis, Insights and Forecast - by Services
- 8.1.1. Food Services
- 8.1.2. Car Rentals
- 8.1.3. Baggage Handling Systems
- 8.1.4. Other Services
- 8.1. Market Analysis, Insights and Forecast - by Services
- 9. Asia Pacific Non-Aeronautical Industry Analysis, Insights and Forecast, 2020-2032
- 9.1. Market Analysis, Insights and Forecast - by Services
- 9.1.1. Food Services
- 9.1.2. Car Rentals
- 9.1.3. Baggage Handling Systems
- 9.1.4. Other Services
- 9.1. Market Analysis, Insights and Forecast - by Services
- 10. Latin America Non-Aeronautical Industry Analysis, Insights and Forecast, 2020-2032
- 10.1. Market Analysis, Insights and Forecast - by Services
- 10.1.1. Food Services
- 10.1.2. Car Rentals
- 10.1.3. Baggage Handling Systems
- 10.1.4. Other Services
- 10.1. Market Analysis, Insights and Forecast - by Services
- 11. Middle East and Africa Non-Aeronautical Industry Analysis, Insights and Forecast, 2020-2032
- 11.1. Market Analysis, Insights and Forecast - by Services
- 11.1.1. Food Services
- 11.1.2. Car Rentals
- 11.1.3. Baggage Handling Systems
- 11.1.4. Other Services
- 11.1. Market Analysis, Insights and Forecast - by Services
- 12. Competitive Analysis
- 12.1. Company Profiles
- 12.1.1 Airports de Paris SA
- 12.1.1.1. Company Overview
- 12.1.1.2. Products
- 12.1.1.3. Company Financials
- 12.1.1.4. SWOT Analysis
- 12.1.2 GROUPE ADP
- 12.1.2.1. Company Overview
- 12.1.2.2. Products
- 12.1.2.3. Company Financials
- 12.1.2.4. SWOT Analysis
- 12.1.3 AENA SME SA
- 12.1.3.1. Company Overview
- 12.1.3.2. Products
- 12.1.3.3. Company Financials
- 12.1.3.4. SWOT Analysis
- 12.1.4 London Heathrow Airports Limited
- 12.1.4.1. Company Overview
- 12.1.4.2. Products
- 12.1.4.3. Company Financials
- 12.1.4.4. SWOT Analysis
- 12.1.5 Vinci SA
- 12.1.5.1. Company Overview
- 12.1.5.2. Products
- 12.1.5.3. Company Financials
- 12.1.5.4. SWOT Analysis
- 12.1.6 Fraport Group
- 12.1.6.1. Company Overview
- 12.1.6.2. Products
- 12.1.6.3. Company Financials
- 12.1.6.4. SWOT Analysis
- 12.1.7 Korea Airports Cor
- 12.1.7.1. Company Overview
- 12.1.7.2. Products
- 12.1.7.3. Company Financials
- 12.1.7.4. SWOT Analysis
- 12.1.8 Airports of Thailand Plc
- 12.1.8.1. Company Overview
- 12.1.8.2. Products
- 12.1.8.3. Company Financials
- 12.1.8.4. SWOT Analysis
- 12.1.9 Airport Authority Hong Kong
- 12.1.9.1. Company Overview
- 12.1.9.2. Products
- 12.1.9.3. Company Financials
- 12.1.9.4. SWOT Analysis
- 12.1.10 Japan Airport Terminal Co Ltd
- 12.1.10.1. Company Overview
- 12.1.10.2. Products
- 12.1.10.3. Company Financials
- 12.1.10.4. SWOT Analysis
- 12.1.1 Airports de Paris SA
- 12.2. Market Entropy
- 12.2.1 Company's Key Areas Served
- 12.2.2 Recent Developments
- 12.3. Company Market Share Analysis 2025
- 12.3.1 Top 5 Companies Market Share Analysis
- 12.3.2 Top 3 Companies Market Share Analysis
- 12.4. List of Potential Customers
- 13. Research Methodology
List of Figures
- Figure 1: Global Non-Aeronautical Industry Revenue Breakdown (billion, %) by Region 2025 & 2033
- Figure 2: North America Non-Aeronautical Industry Revenue (billion), by Services 2025 & 2033
- Figure 3: North America Non-Aeronautical Industry Revenue Share (%), by Services 2025 & 2033
- Figure 4: North America Non-Aeronautical Industry Revenue (billion), by Country 2025 & 2033
- Figure 5: North America Non-Aeronautical Industry Revenue Share (%), by Country 2025 & 2033
- Figure 6: Europe Non-Aeronautical Industry Revenue (billion), by Services 2025 & 2033
- Figure 7: Europe Non-Aeronautical Industry Revenue Share (%), by Services 2025 & 2033
- Figure 8: Europe Non-Aeronautical Industry Revenue (billion), by Country 2025 & 2033
- Figure 9: Europe Non-Aeronautical Industry Revenue Share (%), by Country 2025 & 2033
- Figure 10: Asia Pacific Non-Aeronautical Industry Revenue (billion), by Services 2025 & 2033
- Figure 11: Asia Pacific Non-Aeronautical Industry Revenue Share (%), by Services 2025 & 2033
- Figure 12: Asia Pacific Non-Aeronautical Industry Revenue (billion), by Country 2025 & 2033
- Figure 13: Asia Pacific Non-Aeronautical Industry Revenue Share (%), by Country 2025 & 2033
- Figure 14: Latin America Non-Aeronautical Industry Revenue (billion), by Services 2025 & 2033
- Figure 15: Latin America Non-Aeronautical Industry Revenue Share (%), by Services 2025 & 2033
- Figure 16: Latin America Non-Aeronautical Industry Revenue (billion), by Country 2025 & 2033
- Figure 17: Latin America Non-Aeronautical Industry Revenue Share (%), by Country 2025 & 2033
- Figure 18: Middle East and Africa Non-Aeronautical Industry Revenue (billion), by Services 2025 & 2033
- Figure 19: Middle East and Africa Non-Aeronautical Industry Revenue Share (%), by Services 2025 & 2033
- Figure 20: Middle East and Africa Non-Aeronautical Industry Revenue (billion), by Country 2025 & 2033
- Figure 21: Middle East and Africa Non-Aeronautical Industry Revenue Share (%), by Country 2025 & 2033
List of Tables
- Table 1: Global Non-Aeronautical Industry Revenue billion Forecast, by Services 2020 & 2033
- Table 2: Global Non-Aeronautical Industry Revenue billion Forecast, by Region 2020 & 2033
- Table 3: Global Non-Aeronautical Industry Revenue billion Forecast, by Services 2020 & 2033
- Table 4: Global Non-Aeronautical Industry Revenue billion Forecast, by Country 2020 & 2033
- Table 5: United States Non-Aeronautical Industry Revenue (billion) Forecast, by Application 2020 & 2033
- Table 6: Canada Non-Aeronautical Industry Revenue (billion) Forecast, by Application 2020 & 2033
- Table 7: Global Non-Aeronautical Industry Revenue billion Forecast, by Services 2020 & 2033
- Table 8: Global Non-Aeronautical Industry Revenue billion Forecast, by Country 2020 & 2033
- Table 9: Germany Non-Aeronautical Industry Revenue (billion) Forecast, by Application 2020 & 2033
- Table 10: United Kingdom Non-Aeronautical Industry Revenue (billion) Forecast, by Application 2020 & 2033
- Table 11: France Non-Aeronautical Industry Revenue (billion) Forecast, by Application 2020 & 2033
- Table 12: Russia Non-Aeronautical Industry Revenue (billion) Forecast, by Application 2020 & 2033
- Table 13: Rest of Europe Non-Aeronautical Industry Revenue (billion) Forecast, by Application 2020 & 2033
- Table 14: Global Non-Aeronautical Industry Revenue billion Forecast, by Services 2020 & 2033
- Table 15: Global Non-Aeronautical Industry Revenue billion Forecast, by Country 2020 & 2033
- Table 16: India Non-Aeronautical Industry Revenue (billion) Forecast, by Application 2020 & 2033
- Table 17: China Non-Aeronautical Industry Revenue (billion) Forecast, by Application 2020 & 2033
- Table 18: Japan Non-Aeronautical Industry Revenue (billion) Forecast, by Application 2020 & 2033
- Table 19: Rest of Asia Pacific Non-Aeronautical Industry Revenue (billion) Forecast, by Application 2020 & 2033
- Table 20: Global Non-Aeronautical Industry Revenue billion Forecast, by Services 2020 & 2033
- Table 21: Global Non-Aeronautical Industry Revenue billion Forecast, by Country 2020 & 2033
- Table 22: Brazil Non-Aeronautical Industry Revenue (billion) Forecast, by Application 2020 & 2033
- Table 23: Rest of Latin America Non-Aeronautical Industry Revenue (billion) Forecast, by Application 2020 & 2033
- Table 24: Global Non-Aeronautical Industry Revenue billion Forecast, by Services 2020 & 2033
- Table 25: Global Non-Aeronautical Industry Revenue billion Forecast, by Country 2020 & 2033
- Table 26: United Arab Emirates Non-Aeronautical Industry Revenue (billion) Forecast, by Application 2020 & 2033
- Table 27: Saudi Arabia Non-Aeronautical Industry Revenue (billion) Forecast, by Application 2020 & 2033
- Table 28: South Africa Non-Aeronautical Industry Revenue (billion) Forecast, by Application 2020 & 2033
- Table 29: Rest of Middle East and Africa Non-Aeronautical Industry Revenue (billion) Forecast, by Application 2020 & 2033
Frequently Asked Questions
1. What is the projected Compound Annual Growth Rate (CAGR) of the Non-Aeronautical Industry?
The projected CAGR is approximately 14.75%.
2. Which companies are prominent players in the Non-Aeronautical Industry?
Key companies in the market include Airports de Paris SA, GROUPE ADP, AENA SME SA, London Heathrow Airports Limited, Vinci SA, Fraport Group, Korea Airports Cor, Airports of Thailand Plc, Airport Authority Hong Kong, Japan Airport Terminal Co Ltd.
3. What are the main segments of the Non-Aeronautical Industry?
The market segments include Services.
4. Can you provide details about the market size?
The market size is estimated to be USD 9.17 billion as of 2022.
5. What are some drivers contributing to market growth?
N/A
6. What are the notable trends driving market growth?
Ground Handling Systems Will Showcase Significant Growth During the Forecast Period.
7. Are there any restraints impacting market growth?
N/A
8. Can you provide examples of recent developments in the market?
N/A
9. What pricing options are available for accessing the report?
Pricing options include single-user, multi-user, and enterprise licenses priced at USD 4750, USD 5250, and USD 8750 respectively.
10. Is the market size provided in terms of value or volume?
The market size is provided in terms of value, measured in billion.
11. Are there any specific market keywords associated with the report?
Yes, the market keyword associated with the report is "Non-Aeronautical Industry," which aids in identifying and referencing the specific market segment covered.
12. How do I determine which pricing option suits my needs best?
The pricing options vary based on user requirements and access needs. Individual users may opt for single-user licenses, while businesses requiring broader access may choose multi-user or enterprise licenses for cost-effective access to the report.
13. Are there any additional resources or data provided in the Non-Aeronautical Industry report?
While the report offers comprehensive insights, it's advisable to review the specific contents or supplementary materials provided to ascertain if additional resources or data are available.
14. How can I stay updated on further developments or reports in the Non-Aeronautical Industry?
To stay informed about further developments, trends, and reports in the Non-Aeronautical Industry, consider subscribing to industry newsletters, following relevant companies and organizations, or regularly checking reputable industry news sources and publications.
Methodology
Step 1 - Identification of Relevant Samples Size from Population Database


Step 2 - Approaches for Defining Global Market Size (Value, Volume* & Price*)

Note*: In applicable scenarios
Step 3 - Data Sources
Primary Research
- Web Analytics
- Survey Reports
- Research Institute
- Latest Research Reports
- Opinion Leaders
Secondary Research
- Annual Reports
- White Paper
- Latest Press Release
- Industry Association
- Paid Database
- Investor Presentations

Step 4 - Data Triangulation
Involves using different sources of information in order to increase the validity of a study
These sources are likely to be stakeholders in a program - participants, other researchers, program staff, other community members, and so on.
Then we put all data in single framework & apply various statistical tools to find out the dynamic on the market.
During the analysis stage, feedback from the stakeholder groups would be compared to determine areas of agreement as well as areas of divergence