
Key Insights
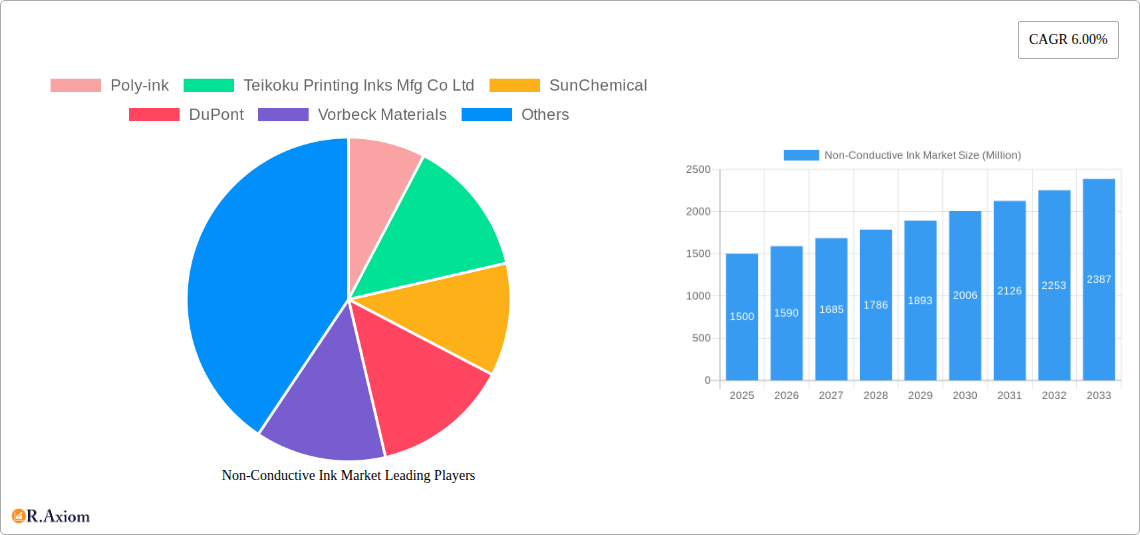
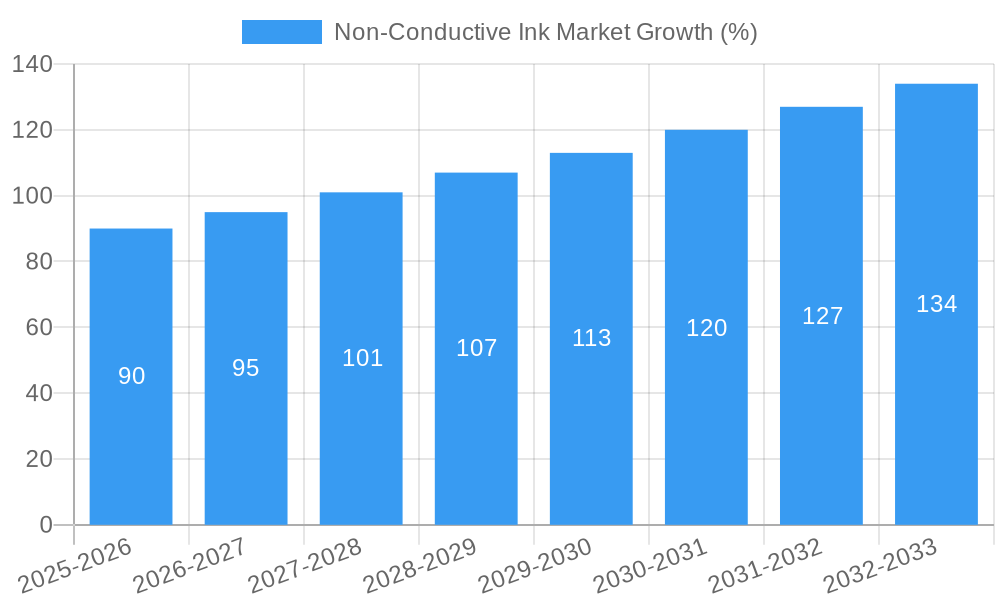
The non-conductive ink market, valued at approximately $1.5 billion in 2025, is projected to experience robust growth, exhibiting a compound annual growth rate (CAGR) of 6% from 2025 to 2033. This expansion is driven by several key factors. The increasing demand for sophisticated electronics, particularly in the photovoltaic panel and printed circuit board (PCB) sectors, fuels the need for high-performance non-conductive inks. Technological advancements are leading to the development of inks with enhanced properties such as improved dielectric strength, thermal stability, and chemical resistance, further boosting market growth. The rising adoption of LED packaging technology across various industries, including automotive lighting and consumer electronics, also contributes significantly to market expansion. Furthermore, the growing emphasis on miniaturization and improved efficiency in electronic devices necessitates the use of precise and reliable non-conductive inks. The market is segmented by substrate type (acrylic, ceramic, glass) and application (photovoltaic panels, printed circuit boards, LED packaging). Acrylic substrates currently dominate the market due to their cost-effectiveness and ease of processing, although ceramic and glass substrates are gaining traction due to their superior performance characteristics in demanding applications.
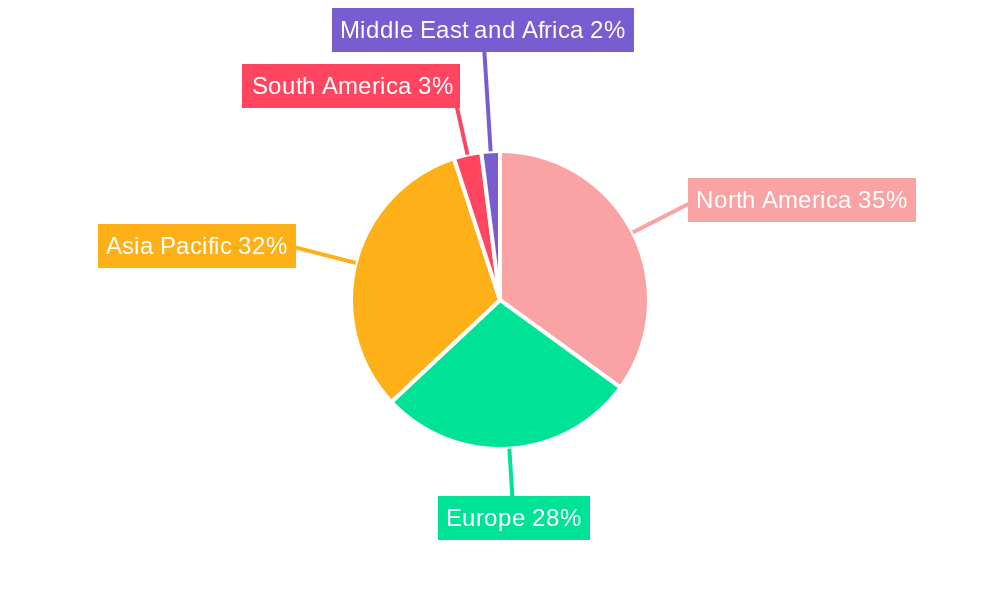
Significant regional variations exist in the non-conductive ink market. North America and Asia-Pacific currently represent the largest market shares, driven by strong manufacturing bases and high technological adoption rates within these regions. However, emerging economies in Asia-Pacific, particularly in India and Southeast Asia, are expected to witness the fastest growth in the coming years, fueled by expanding electronics manufacturing capabilities and rising consumer demand. Europe also holds a considerable market share, though its growth might be slightly slower compared to the Asia-Pacific region. Competitive dynamics are shaped by a mix of established players like DuPont and SunChemical, and smaller, specialized companies focusing on niche applications. The market’s future growth hinges on continuous innovation in ink formulations, expansion into new applications, and the ability to meet the evolving needs of the electronics industry.
Non-Conductive Ink Market: A Comprehensive Analysis (2019-2033)
This comprehensive report provides an in-depth analysis of the Non-Conductive Ink market, offering invaluable insights for stakeholders seeking to understand current market dynamics and future growth opportunities. The study period covers 2019-2033, with 2025 serving as the base and estimated year. The report leverages extensive primary and secondary research, presenting a detailed overview of market size, segmentation, growth drivers, challenges, and competitive landscape. The forecast period extends from 2025 to 2033, enabling informed strategic decision-making.
Non-Conductive Ink Market Concentration & Innovation
This section delves into the competitive landscape of the Non-Conductive Ink market, analyzing market concentration, innovation drivers, and regulatory factors. We examine the market share held by key players such as Poly-ink, Teikoku Printing Inks Mfg Co Ltd, SunChemical, DuPont, Vorbeck Materials, Applied Ink Solutions, Henkel Corporation, Creative Materials Inc, Nagase America LLC, and NovaCentrix. The report quantifies market concentration using metrics like the Herfindahl-Hirschman Index (HHI) and identifies dominant players. Furthermore, we assess the impact of innovation drivers, including advancements in ink formulations and printing technologies. The analysis also considers regulatory frameworks and their influence on market growth. We explore the impact of substitute products and analyze end-user trends influencing the market. Finally, the report reviews recent mergers and acquisitions (M&A) activities within the sector, providing details on deal values and their implications for market consolidation. For example, a recent M&A deal of xx Million between Company A and Company B highlights the increasing strategic importance of the non-conductive ink market. The analysis incorporates data from the historical period (2019-2024) to provide a comprehensive understanding of market evolution and future trajectories.
Non-Conductive Ink Market Industry Trends & Insights
This section provides a detailed analysis of the key trends shaping the Non-Conductive Ink market. We explore the market's growth trajectory, examining factors driving expansion, such as increasing demand from key applications like photovoltaic panels and printed circuit boards. Technological disruptions, particularly in inkjet printing and 3D printing, are meticulously analyzed. We quantify the market's Compound Annual Growth Rate (CAGR) during the forecast period (2025-2033), projecting a CAGR of xx%. This projection is based on analyzing consumer preferences, shifting technological landscapes, and competitive dynamics within the industry. Market penetration rates in various segments will be provided, showcasing the level of market saturation and future growth potential. The discussion includes a detailed analysis of consumer preferences across different geographic regions and their influence on market demands, alongside insights on how competitive dynamics such as pricing strategies and product differentiation affect overall market growth.
Dominant Markets & Segments in Non-Conductive Ink Market
This section identifies the leading regions, countries, and market segments within the Non-Conductive Ink market. We analyze market dominance by segment (Substrate Type: Acrylic, Ceramic, Glass; Application: Photovoltaic Panels, Printed Circuit Board Panels, LED Packaging) and region.
- Leading Segment: The report identifies the [Application] segment as the dominant segment, accounting for xx% of the total market value in 2025. This dominance is attributed to [explain reasons for dominance].
- Leading Region: [Region Name] is projected as the leading region, holding xx% of the global market share in 2025, driven primarily by [explain key drivers, e.g., strong economic growth, supportive government policies, robust infrastructure].
Key Drivers by Segment:
- Photovoltaic Panels: Rapid growth of the renewable energy sector.
- Printed Circuit Board Panels: Growing demand for electronics and miniaturization.
- LED Packaging: Increasing adoption of LED lighting technologies.
Substrate Type Analysis:
- Acrylic: [Detailed analysis of market share and growth drivers for acrylic substrates]
- Ceramic: [Detailed analysis of market share and growth drivers for ceramic substrates]
- Glass: [Detailed analysis of market share and growth drivers for glass substrates]
Detailed dominance analysis for each segment and region will be presented, providing specific data and insights.
Non-Conductive Ink Market Product Developments
Recent product innovations have focused on enhancing ink properties, including improved adhesion, durability, and printability. This includes advancements in ink formulation to accommodate varied substrates and printing techniques. Key innovations include the development of inks with enhanced UV resistance and improved compatibility with various printing technologies such as inkjet and screen printing. These advancements have broadened the range of applications for non-conductive inks, significantly impacting market growth and competition. The development of eco-friendly, solvent-free ink formulations is also gaining traction, driven by increasing environmental regulations and growing consumer awareness.
Report Scope & Segmentation Analysis
This report provides a comprehensive segmentation of the Non-Conductive Ink market. The market is segmented by substrate type (Acrylic, Ceramic, Glass) and application (Photovoltaic Panels, Printed Circuit Board Panels, LED Packaging).
- Substrate Type: Each substrate type exhibits distinct properties influencing ink selection and application methods. Market size and growth projections are provided for each substrate type, highlighting the competitive dynamics within these segments.
- Application: The application segments reflect diverse end-use industries, each with unique demands for ink performance and properties. Growth forecasts and competitive landscapes are analyzed for each application segment.
The report provides detailed market size projections (in Millions) for each segment across the forecast period (2025-2033).
Key Drivers of Non-Conductive Ink Market Growth
The Non-Conductive Ink market is experiencing significant growth driven by several key factors. Technological advancements in printing technologies like inkjet and screen printing are improving application versatility and efficiency. The expanding electronics industry, particularly the demand for printed electronics, is a major growth catalyst. Government initiatives promoting renewable energy sources like solar panels are driving demand for specialized non-conductive inks used in photovoltaic applications. Furthermore, the increasing adoption of LED lighting and the demand for advanced packaging solutions contribute to market growth.
Challenges in the Non-Conductive Ink Market Sector
Despite significant growth potential, several challenges hinder the Non-Conductive Ink market. Stringent environmental regulations impose restrictions on the use of certain chemicals, impacting ink formulation and manufacturing processes. Fluctuations in raw material prices affect profitability, and supply chain disruptions can create production bottlenecks. Intense competition among established players and new entrants creates pricing pressures and necessitates continuous innovation to maintain market share. These factors contribute to overall market volatility and require careful consideration by industry stakeholders.
Emerging Opportunities in Non-Conductive Ink Market
The Non-Conductive Ink market presents several promising opportunities. The rise of flexible electronics and wearable technology creates new applications for specialized non-conductive inks. Advances in 3D printing open avenues for customized ink formulations and innovative product designs. The growing demand for eco-friendly and sustainable solutions drives the development of bio-based and solvent-free inks, presenting significant market potential. Furthermore, expansion into emerging economies offers untapped growth opportunities.
Leading Players in the Non-Conductive Ink Market Market
- Poly-ink
- Teikoku Printing Inks Mfg Co Ltd
- SunChemical
- DuPont
- Vorbeck Materials
- Applied Ink Solutions
- Henkel Corporation
- Creative Materials Inc
- Nagase America LLC
- NovaCentrix
Key Developments in Non-Conductive Ink Market Industry
- [Month, Year]: Company X launched a new line of eco-friendly non-conductive inks. This launch significantly impacted market competition by offering a sustainable alternative.
- [Month, Year]: Company Y acquired Company Z, expanding its market share and product portfolio. This M&A activity consolidated the market and influenced pricing strategies.
- [Month, Year]: New regulations on VOC emissions were implemented, affecting the formulation of certain non-conductive inks. This led to innovation in greener ink technologies. (Add more bullet points as needed)
Strategic Outlook for Non-Conductive Ink Market Market
The Non-Conductive Ink market is poised for continued growth, driven by technological innovation, expanding applications, and supportive government policies. The increasing demand for sustainable solutions and the rise of emerging technologies like 3D printing will further fuel market expansion. Companies should focus on developing eco-friendly and high-performance inks to meet growing industry demands. Strategic partnerships and collaborations will become increasingly important to navigate challenges and capitalize on emerging opportunities within this dynamic market.
Non-Conductive Ink Market Segmentation
-
1. Substrate Type
- 1.1. Acrylic
- 1.2. Ceramic
- 1.3. Glass
-
2. Application
- 2.1. Photovoltaic Panels
- 2.2. Printed Circuit Board Panels
- 2.3. LED Packaging
Non-Conductive Ink Market Segmentation By Geography
-
1. Asia Pacific
- 1.1. China
- 1.2. India
- 1.3. Japan
- 1.4. South Korea
- 1.5. Rest of Asia Pacific
-
2. North America
- 2.1. United States
- 2.2. Canada
- 2.3. Mexico
-
3. Europe
- 3.1. Germany
- 3.2. United Kingdom
- 3.3. France
- 3.4. Italy
- 3.5. Rest of Europe
-
4. South America
- 4.1. Brazil
- 4.2. Argentina
- 4.3. Rest of South America
-
5. Middle East and Africa
- 5.1. Saudi Arabia
- 5.2. South Africa
- 5.3. Rest of Middle East and Africa
Non-Conductive Ink Market REPORT HIGHLIGHTS
| Aspects | Details |
|---|---|
| Study Period | 2019-2033 |
| Base Year | 2024 |
| Estimated Year | 2025 |
| Forecast Period | 2025-2033 |
| Historical Period | 2019-2024 |
| Growth Rate | CAGR of 6.00% from 2019-2033 |
| Segmentation |
|
Table of Contents
- 1. Introduction
- 1.1. Research Scope
- 1.2. Market Segmentation
- 1.3. Research Methodology
- 1.4. Definitions and Assumptions
- 2. Executive Summary
- 2.1. Introduction
- 3. Market Dynamics
- 3.1. Introduction
- 3.2. Market Drivers
- 3.2.1. ; Increasing Demand for Printed Circuit Boards; Growing Electronic and Electrical Industry
- 3.3. Market Restrains
- 3.3.1. ; Fluctuation in Raw Material Pricing; Unfavorable Conditions Arising Due to COVID-19 Outbreak
- 3.4. Market Trends
- 3.4.1. Increasing Demand for Printed Circuit Boards
- 4. Market Factor Analysis
- 4.1. Porters Five Forces
- 4.2. Supply/Value Chain
- 4.3. PESTEL analysis
- 4.4. Market Entropy
- 4.5. Patent/Trademark Analysis
- 5. Global Non-Conductive Ink Market Analysis, Insights and Forecast, 2019-2031
- 5.1. Market Analysis, Insights and Forecast - by Substrate Type
- 5.1.1. Acrylic
- 5.1.2. Ceramic
- 5.1.3. Glass
- 5.2. Market Analysis, Insights and Forecast - by Application
- 5.2.1. Photovoltaic Panels
- 5.2.2. Printed Circuit Board Panels
- 5.2.3. LED Packaging
- 5.3. Market Analysis, Insights and Forecast - by Region
- 5.3.1. Asia Pacific
- 5.3.2. North America
- 5.3.3. Europe
- 5.3.4. South America
- 5.3.5. Middle East and Africa
- 5.1. Market Analysis, Insights and Forecast - by Substrate Type
- 6. Asia Pacific Non-Conductive Ink Market Analysis, Insights and Forecast, 2019-2031
- 6.1. Market Analysis, Insights and Forecast - by Substrate Type
- 6.1.1. Acrylic
- 6.1.2. Ceramic
- 6.1.3. Glass
- 6.2. Market Analysis, Insights and Forecast - by Application
- 6.2.1. Photovoltaic Panels
- 6.2.2. Printed Circuit Board Panels
- 6.2.3. LED Packaging
- 6.1. Market Analysis, Insights and Forecast - by Substrate Type
- 7. North America Non-Conductive Ink Market Analysis, Insights and Forecast, 2019-2031
- 7.1. Market Analysis, Insights and Forecast - by Substrate Type
- 7.1.1. Acrylic
- 7.1.2. Ceramic
- 7.1.3. Glass
- 7.2. Market Analysis, Insights and Forecast - by Application
- 7.2.1. Photovoltaic Panels
- 7.2.2. Printed Circuit Board Panels
- 7.2.3. LED Packaging
- 7.1. Market Analysis, Insights and Forecast - by Substrate Type
- 8. Europe Non-Conductive Ink Market Analysis, Insights and Forecast, 2019-2031
- 8.1. Market Analysis, Insights and Forecast - by Substrate Type
- 8.1.1. Acrylic
- 8.1.2. Ceramic
- 8.1.3. Glass
- 8.2. Market Analysis, Insights and Forecast - by Application
- 8.2.1. Photovoltaic Panels
- 8.2.2. Printed Circuit Board Panels
- 8.2.3. LED Packaging
- 8.1. Market Analysis, Insights and Forecast - by Substrate Type
- 9. South America Non-Conductive Ink Market Analysis, Insights and Forecast, 2019-2031
- 9.1. Market Analysis, Insights and Forecast - by Substrate Type
- 9.1.1. Acrylic
- 9.1.2. Ceramic
- 9.1.3. Glass
- 9.2. Market Analysis, Insights and Forecast - by Application
- 9.2.1. Photovoltaic Panels
- 9.2.2. Printed Circuit Board Panels
- 9.2.3. LED Packaging
- 9.1. Market Analysis, Insights and Forecast - by Substrate Type
- 10. Middle East and Africa Non-Conductive Ink Market Analysis, Insights and Forecast, 2019-2031
- 10.1. Market Analysis, Insights and Forecast - by Substrate Type
- 10.1.1. Acrylic
- 10.1.2. Ceramic
- 10.1.3. Glass
- 10.2. Market Analysis, Insights and Forecast - by Application
- 10.2.1. Photovoltaic Panels
- 10.2.2. Printed Circuit Board Panels
- 10.2.3. LED Packaging
- 10.1. Market Analysis, Insights and Forecast - by Substrate Type
- 11. North America Non-Conductive Ink Market Analysis, Insights and Forecast, 2019-2031
- 11.1. Market Analysis, Insights and Forecast - By Country/Sub-region
- 11.1.1 United States
- 11.1.2 Canada
- 11.1.3 Mexico
- 12. Europe Non-Conductive Ink Market Analysis, Insights and Forecast, 2019-2031
- 12.1. Market Analysis, Insights and Forecast - By Country/Sub-region
- 12.1.1 Germany
- 12.1.2 France
- 12.1.3 Italy
- 12.1.4 United Kingdom
- 12.1.5 Netherlands
- 12.1.6 Rest of Europe
- 13. Asia Pacific Non-Conductive Ink Market Analysis, Insights and Forecast, 2019-2031
- 13.1. Market Analysis, Insights and Forecast - By Country/Sub-region
- 13.1.1 China
- 13.1.2 Japan
- 13.1.3 India
- 13.1.4 South Korea
- 13.1.5 Taiwan
- 13.1.6 Australia
- 13.1.7 Rest of Asia-Pacific
- 14. South America Non-Conductive Ink Market Analysis, Insights and Forecast, 2019-2031
- 14.1. Market Analysis, Insights and Forecast - By Country/Sub-region
- 14.1.1 Brazil
- 14.1.2 Argentina
- 14.1.3 Rest of South America
- 15. Middle East and Africa Non-Conductive Ink Market Analysis, Insights and Forecast, 2019-2031
- 15.1. Market Analysis, Insights and Forecast - By Country/Sub-region
- 15.1.1 Middle East
- 15.1.2 Africa
- 16. Competitive Analysis
- 16.1. Global Market Share Analysis 2024
- 16.2. Company Profiles
- 16.2.1 Poly-ink
- 16.2.1.1. Overview
- 16.2.1.2. Products
- 16.2.1.3. SWOT Analysis
- 16.2.1.4. Recent Developments
- 16.2.1.5. Financials (Based on Availability)
- 16.2.2 Teikoku Printing Inks Mfg Co Ltd
- 16.2.2.1. Overview
- 16.2.2.2. Products
- 16.2.2.3. SWOT Analysis
- 16.2.2.4. Recent Developments
- 16.2.2.5. Financials (Based on Availability)
- 16.2.3 SunChemical
- 16.2.3.1. Overview
- 16.2.3.2. Products
- 16.2.3.3. SWOT Analysis
- 16.2.3.4. Recent Developments
- 16.2.3.5. Financials (Based on Availability)
- 16.2.4 DuPont
- 16.2.4.1. Overview
- 16.2.4.2. Products
- 16.2.4.3. SWOT Analysis
- 16.2.4.4. Recent Developments
- 16.2.4.5. Financials (Based on Availability)
- 16.2.5 Vorbeck Materials
- 16.2.5.1. Overview
- 16.2.5.2. Products
- 16.2.5.3. SWOT Analysis
- 16.2.5.4. Recent Developments
- 16.2.5.5. Financials (Based on Availability)
- 16.2.6 Applied Ink Solutions
- 16.2.6.1. Overview
- 16.2.6.2. Products
- 16.2.6.3. SWOT Analysis
- 16.2.6.4. Recent Developments
- 16.2.6.5. Financials (Based on Availability)
- 16.2.7 Henkel Corporation
- 16.2.7.1. Overview
- 16.2.7.2. Products
- 16.2.7.3. SWOT Analysis
- 16.2.7.4. Recent Developments
- 16.2.7.5. Financials (Based on Availability)
- 16.2.8 Creative Materials Inc
- 16.2.8.1. Overview
- 16.2.8.2. Products
- 16.2.8.3. SWOT Analysis
- 16.2.8.4. Recent Developments
- 16.2.8.5. Financials (Based on Availability)
- 16.2.9 Nagase America LLC
- 16.2.9.1. Overview
- 16.2.9.2. Products
- 16.2.9.3. SWOT Analysis
- 16.2.9.4. Recent Developments
- 16.2.9.5. Financials (Based on Availability)
- 16.2.10 NovaCentrix
- 16.2.10.1. Overview
- 16.2.10.2. Products
- 16.2.10.3. SWOT Analysis
- 16.2.10.4. Recent Developments
- 16.2.10.5. Financials (Based on Availability)
- 16.2.1 Poly-ink
List of Figures
- Figure 1: Global Non-Conductive Ink Market Revenue Breakdown (Million, %) by Region 2024 & 2032
- Figure 2: Global Non-Conductive Ink Market Volume Breakdown (K Tons, %) by Region 2024 & 2032
- Figure 3: North America Non-Conductive Ink Market Revenue (Million), by Country 2024 & 2032
- Figure 4: North America Non-Conductive Ink Market Volume (K Tons), by Country 2024 & 2032
- Figure 5: North America Non-Conductive Ink Market Revenue Share (%), by Country 2024 & 2032
- Figure 6: North America Non-Conductive Ink Market Volume Share (%), by Country 2024 & 2032
- Figure 7: Europe Non-Conductive Ink Market Revenue (Million), by Country 2024 & 2032
- Figure 8: Europe Non-Conductive Ink Market Volume (K Tons), by Country 2024 & 2032
- Figure 9: Europe Non-Conductive Ink Market Revenue Share (%), by Country 2024 & 2032
- Figure 10: Europe Non-Conductive Ink Market Volume Share (%), by Country 2024 & 2032
- Figure 11: Asia Pacific Non-Conductive Ink Market Revenue (Million), by Country 2024 & 2032
- Figure 12: Asia Pacific Non-Conductive Ink Market Volume (K Tons), by Country 2024 & 2032
- Figure 13: Asia Pacific Non-Conductive Ink Market Revenue Share (%), by Country 2024 & 2032
- Figure 14: Asia Pacific Non-Conductive Ink Market Volume Share (%), by Country 2024 & 2032
- Figure 15: South America Non-Conductive Ink Market Revenue (Million), by Country 2024 & 2032
- Figure 16: South America Non-Conductive Ink Market Volume (K Tons), by Country 2024 & 2032
- Figure 17: South America Non-Conductive Ink Market Revenue Share (%), by Country 2024 & 2032
- Figure 18: South America Non-Conductive Ink Market Volume Share (%), by Country 2024 & 2032
- Figure 19: Middle East and Africa Non-Conductive Ink Market Revenue (Million), by Country 2024 & 2032
- Figure 20: Middle East and Africa Non-Conductive Ink Market Volume (K Tons), by Country 2024 & 2032
- Figure 21: Middle East and Africa Non-Conductive Ink Market Revenue Share (%), by Country 2024 & 2032
- Figure 22: Middle East and Africa Non-Conductive Ink Market Volume Share (%), by Country 2024 & 2032
- Figure 23: Asia Pacific Non-Conductive Ink Market Revenue (Million), by Substrate Type 2024 & 2032
- Figure 24: Asia Pacific Non-Conductive Ink Market Volume (K Tons), by Substrate Type 2024 & 2032
- Figure 25: Asia Pacific Non-Conductive Ink Market Revenue Share (%), by Substrate Type 2024 & 2032
- Figure 26: Asia Pacific Non-Conductive Ink Market Volume Share (%), by Substrate Type 2024 & 2032
- Figure 27: Asia Pacific Non-Conductive Ink Market Revenue (Million), by Application 2024 & 2032
- Figure 28: Asia Pacific Non-Conductive Ink Market Volume (K Tons), by Application 2024 & 2032
- Figure 29: Asia Pacific Non-Conductive Ink Market Revenue Share (%), by Application 2024 & 2032
- Figure 30: Asia Pacific Non-Conductive Ink Market Volume Share (%), by Application 2024 & 2032
- Figure 31: Asia Pacific Non-Conductive Ink Market Revenue (Million), by Country 2024 & 2032
- Figure 32: Asia Pacific Non-Conductive Ink Market Volume (K Tons), by Country 2024 & 2032
- Figure 33: Asia Pacific Non-Conductive Ink Market Revenue Share (%), by Country 2024 & 2032
- Figure 34: Asia Pacific Non-Conductive Ink Market Volume Share (%), by Country 2024 & 2032
- Figure 35: North America Non-Conductive Ink Market Revenue (Million), by Substrate Type 2024 & 2032
- Figure 36: North America Non-Conductive Ink Market Volume (K Tons), by Substrate Type 2024 & 2032
- Figure 37: North America Non-Conductive Ink Market Revenue Share (%), by Substrate Type 2024 & 2032
- Figure 38: North America Non-Conductive Ink Market Volume Share (%), by Substrate Type 2024 & 2032
- Figure 39: North America Non-Conductive Ink Market Revenue (Million), by Application 2024 & 2032
- Figure 40: North America Non-Conductive Ink Market Volume (K Tons), by Application 2024 & 2032
- Figure 41: North America Non-Conductive Ink Market Revenue Share (%), by Application 2024 & 2032
- Figure 42: North America Non-Conductive Ink Market Volume Share (%), by Application 2024 & 2032
- Figure 43: North America Non-Conductive Ink Market Revenue (Million), by Country 2024 & 2032
- Figure 44: North America Non-Conductive Ink Market Volume (K Tons), by Country 2024 & 2032
- Figure 45: North America Non-Conductive Ink Market Revenue Share (%), by Country 2024 & 2032
- Figure 46: North America Non-Conductive Ink Market Volume Share (%), by Country 2024 & 2032
- Figure 47: Europe Non-Conductive Ink Market Revenue (Million), by Substrate Type 2024 & 2032
- Figure 48: Europe Non-Conductive Ink Market Volume (K Tons), by Substrate Type 2024 & 2032
- Figure 49: Europe Non-Conductive Ink Market Revenue Share (%), by Substrate Type 2024 & 2032
- Figure 50: Europe Non-Conductive Ink Market Volume Share (%), by Substrate Type 2024 & 2032
- Figure 51: Europe Non-Conductive Ink Market Revenue (Million), by Application 2024 & 2032
- Figure 52: Europe Non-Conductive Ink Market Volume (K Tons), by Application 2024 & 2032
- Figure 53: Europe Non-Conductive Ink Market Revenue Share (%), by Application 2024 & 2032
- Figure 54: Europe Non-Conductive Ink Market Volume Share (%), by Application 2024 & 2032
- Figure 55: Europe Non-Conductive Ink Market Revenue (Million), by Country 2024 & 2032
- Figure 56: Europe Non-Conductive Ink Market Volume (K Tons), by Country 2024 & 2032
- Figure 57: Europe Non-Conductive Ink Market Revenue Share (%), by Country 2024 & 2032
- Figure 58: Europe Non-Conductive Ink Market Volume Share (%), by Country 2024 & 2032
- Figure 59: South America Non-Conductive Ink Market Revenue (Million), by Substrate Type 2024 & 2032
- Figure 60: South America Non-Conductive Ink Market Volume (K Tons), by Substrate Type 2024 & 2032
- Figure 61: South America Non-Conductive Ink Market Revenue Share (%), by Substrate Type 2024 & 2032
- Figure 62: South America Non-Conductive Ink Market Volume Share (%), by Substrate Type 2024 & 2032
- Figure 63: South America Non-Conductive Ink Market Revenue (Million), by Application 2024 & 2032
- Figure 64: South America Non-Conductive Ink Market Volume (K Tons), by Application 2024 & 2032
- Figure 65: South America Non-Conductive Ink Market Revenue Share (%), by Application 2024 & 2032
- Figure 66: South America Non-Conductive Ink Market Volume Share (%), by Application 2024 & 2032
- Figure 67: South America Non-Conductive Ink Market Revenue (Million), by Country 2024 & 2032
- Figure 68: South America Non-Conductive Ink Market Volume (K Tons), by Country 2024 & 2032
- Figure 69: South America Non-Conductive Ink Market Revenue Share (%), by Country 2024 & 2032
- Figure 70: South America Non-Conductive Ink Market Volume Share (%), by Country 2024 & 2032
- Figure 71: Middle East and Africa Non-Conductive Ink Market Revenue (Million), by Substrate Type 2024 & 2032
- Figure 72: Middle East and Africa Non-Conductive Ink Market Volume (K Tons), by Substrate Type 2024 & 2032
- Figure 73: Middle East and Africa Non-Conductive Ink Market Revenue Share (%), by Substrate Type 2024 & 2032
- Figure 74: Middle East and Africa Non-Conductive Ink Market Volume Share (%), by Substrate Type 2024 & 2032
- Figure 75: Middle East and Africa Non-Conductive Ink Market Revenue (Million), by Application 2024 & 2032
- Figure 76: Middle East and Africa Non-Conductive Ink Market Volume (K Tons), by Application 2024 & 2032
- Figure 77: Middle East and Africa Non-Conductive Ink Market Revenue Share (%), by Application 2024 & 2032
- Figure 78: Middle East and Africa Non-Conductive Ink Market Volume Share (%), by Application 2024 & 2032
- Figure 79: Middle East and Africa Non-Conductive Ink Market Revenue (Million), by Country 2024 & 2032
- Figure 80: Middle East and Africa Non-Conductive Ink Market Volume (K Tons), by Country 2024 & 2032
- Figure 81: Middle East and Africa Non-Conductive Ink Market Revenue Share (%), by Country 2024 & 2032
- Figure 82: Middle East and Africa Non-Conductive Ink Market Volume Share (%), by Country 2024 & 2032
List of Tables
- Table 1: Global Non-Conductive Ink Market Revenue Million Forecast, by Region 2019 & 2032
- Table 2: Global Non-Conductive Ink Market Volume K Tons Forecast, by Region 2019 & 2032
- Table 3: Global Non-Conductive Ink Market Revenue Million Forecast, by Substrate Type 2019 & 2032
- Table 4: Global Non-Conductive Ink Market Volume K Tons Forecast, by Substrate Type 2019 & 2032
- Table 5: Global Non-Conductive Ink Market Revenue Million Forecast, by Application 2019 & 2032
- Table 6: Global Non-Conductive Ink Market Volume K Tons Forecast, by Application 2019 & 2032
- Table 7: Global Non-Conductive Ink Market Revenue Million Forecast, by Region 2019 & 2032
- Table 8: Global Non-Conductive Ink Market Volume K Tons Forecast, by Region 2019 & 2032
- Table 9: Global Non-Conductive Ink Market Revenue Million Forecast, by Country 2019 & 2032
- Table 10: Global Non-Conductive Ink Market Volume K Tons Forecast, by Country 2019 & 2032
- Table 11: United States Non-Conductive Ink Market Revenue (Million) Forecast, by Application 2019 & 2032
- Table 12: United States Non-Conductive Ink Market Volume (K Tons) Forecast, by Application 2019 & 2032
- Table 13: Canada Non-Conductive Ink Market Revenue (Million) Forecast, by Application 2019 & 2032
- Table 14: Canada Non-Conductive Ink Market Volume (K Tons) Forecast, by Application 2019 & 2032
- Table 15: Mexico Non-Conductive Ink Market Revenue (Million) Forecast, by Application 2019 & 2032
- Table 16: Mexico Non-Conductive Ink Market Volume (K Tons) Forecast, by Application 2019 & 2032
- Table 17: Global Non-Conductive Ink Market Revenue Million Forecast, by Country 2019 & 2032
- Table 18: Global Non-Conductive Ink Market Volume K Tons Forecast, by Country 2019 & 2032
- Table 19: Germany Non-Conductive Ink Market Revenue (Million) Forecast, by Application 2019 & 2032
- Table 20: Germany Non-Conductive Ink Market Volume (K Tons) Forecast, by Application 2019 & 2032
- Table 21: France Non-Conductive Ink Market Revenue (Million) Forecast, by Application 2019 & 2032
- Table 22: France Non-Conductive Ink Market Volume (K Tons) Forecast, by Application 2019 & 2032
- Table 23: Italy Non-Conductive Ink Market Revenue (Million) Forecast, by Application 2019 & 2032
- Table 24: Italy Non-Conductive Ink Market Volume (K Tons) Forecast, by Application 2019 & 2032
- Table 25: United Kingdom Non-Conductive Ink Market Revenue (Million) Forecast, by Application 2019 & 2032
- Table 26: United Kingdom Non-Conductive Ink Market Volume (K Tons) Forecast, by Application 2019 & 2032
- Table 27: Netherlands Non-Conductive Ink Market Revenue (Million) Forecast, by Application 2019 & 2032
- Table 28: Netherlands Non-Conductive Ink Market Volume (K Tons) Forecast, by Application 2019 & 2032
- Table 29: Rest of Europe Non-Conductive Ink Market Revenue (Million) Forecast, by Application 2019 & 2032
- Table 30: Rest of Europe Non-Conductive Ink Market Volume (K Tons) Forecast, by Application 2019 & 2032
- Table 31: Global Non-Conductive Ink Market Revenue Million Forecast, by Country 2019 & 2032
- Table 32: Global Non-Conductive Ink Market Volume K Tons Forecast, by Country 2019 & 2032
- Table 33: China Non-Conductive Ink Market Revenue (Million) Forecast, by Application 2019 & 2032
- Table 34: China Non-Conductive Ink Market Volume (K Tons) Forecast, by Application 2019 & 2032
- Table 35: Japan Non-Conductive Ink Market Revenue (Million) Forecast, by Application 2019 & 2032
- Table 36: Japan Non-Conductive Ink Market Volume (K Tons) Forecast, by Application 2019 & 2032
- Table 37: India Non-Conductive Ink Market Revenue (Million) Forecast, by Application 2019 & 2032
- Table 38: India Non-Conductive Ink Market Volume (K Tons) Forecast, by Application 2019 & 2032
- Table 39: South Korea Non-Conductive Ink Market Revenue (Million) Forecast, by Application 2019 & 2032
- Table 40: South Korea Non-Conductive Ink Market Volume (K Tons) Forecast, by Application 2019 & 2032
- Table 41: Taiwan Non-Conductive Ink Market Revenue (Million) Forecast, by Application 2019 & 2032
- Table 42: Taiwan Non-Conductive Ink Market Volume (K Tons) Forecast, by Application 2019 & 2032
- Table 43: Australia Non-Conductive Ink Market Revenue (Million) Forecast, by Application 2019 & 2032
- Table 44: Australia Non-Conductive Ink Market Volume (K Tons) Forecast, by Application 2019 & 2032
- Table 45: Rest of Asia-Pacific Non-Conductive Ink Market Revenue (Million) Forecast, by Application 2019 & 2032
- Table 46: Rest of Asia-Pacific Non-Conductive Ink Market Volume (K Tons) Forecast, by Application 2019 & 2032
- Table 47: Global Non-Conductive Ink Market Revenue Million Forecast, by Country 2019 & 2032
- Table 48: Global Non-Conductive Ink Market Volume K Tons Forecast, by Country 2019 & 2032
- Table 49: Brazil Non-Conductive Ink Market Revenue (Million) Forecast, by Application 2019 & 2032
- Table 50: Brazil Non-Conductive Ink Market Volume (K Tons) Forecast, by Application 2019 & 2032
- Table 51: Argentina Non-Conductive Ink Market Revenue (Million) Forecast, by Application 2019 & 2032
- Table 52: Argentina Non-Conductive Ink Market Volume (K Tons) Forecast, by Application 2019 & 2032
- Table 53: Rest of South America Non-Conductive Ink Market Revenue (Million) Forecast, by Application 2019 & 2032
- Table 54: Rest of South America Non-Conductive Ink Market Volume (K Tons) Forecast, by Application 2019 & 2032
- Table 55: Global Non-Conductive Ink Market Revenue Million Forecast, by Country 2019 & 2032
- Table 56: Global Non-Conductive Ink Market Volume K Tons Forecast, by Country 2019 & 2032
- Table 57: Middle East Non-Conductive Ink Market Revenue (Million) Forecast, by Application 2019 & 2032
- Table 58: Middle East Non-Conductive Ink Market Volume (K Tons) Forecast, by Application 2019 & 2032
- Table 59: Africa Non-Conductive Ink Market Revenue (Million) Forecast, by Application 2019 & 2032
- Table 60: Africa Non-Conductive Ink Market Volume (K Tons) Forecast, by Application 2019 & 2032
- Table 61: Global Non-Conductive Ink Market Revenue Million Forecast, by Substrate Type 2019 & 2032
- Table 62: Global Non-Conductive Ink Market Volume K Tons Forecast, by Substrate Type 2019 & 2032
- Table 63: Global Non-Conductive Ink Market Revenue Million Forecast, by Application 2019 & 2032
- Table 64: Global Non-Conductive Ink Market Volume K Tons Forecast, by Application 2019 & 2032
- Table 65: Global Non-Conductive Ink Market Revenue Million Forecast, by Country 2019 & 2032
- Table 66: Global Non-Conductive Ink Market Volume K Tons Forecast, by Country 2019 & 2032
- Table 67: China Non-Conductive Ink Market Revenue (Million) Forecast, by Application 2019 & 2032
- Table 68: China Non-Conductive Ink Market Volume (K Tons) Forecast, by Application 2019 & 2032
- Table 69: India Non-Conductive Ink Market Revenue (Million) Forecast, by Application 2019 & 2032
- Table 70: India Non-Conductive Ink Market Volume (K Tons) Forecast, by Application 2019 & 2032
- Table 71: Japan Non-Conductive Ink Market Revenue (Million) Forecast, by Application 2019 & 2032
- Table 72: Japan Non-Conductive Ink Market Volume (K Tons) Forecast, by Application 2019 & 2032
- Table 73: South Korea Non-Conductive Ink Market Revenue (Million) Forecast, by Application 2019 & 2032
- Table 74: South Korea Non-Conductive Ink Market Volume (K Tons) Forecast, by Application 2019 & 2032
- Table 75: Rest of Asia Pacific Non-Conductive Ink Market Revenue (Million) Forecast, by Application 2019 & 2032
- Table 76: Rest of Asia Pacific Non-Conductive Ink Market Volume (K Tons) Forecast, by Application 2019 & 2032
- Table 77: Global Non-Conductive Ink Market Revenue Million Forecast, by Substrate Type 2019 & 2032
- Table 78: Global Non-Conductive Ink Market Volume K Tons Forecast, by Substrate Type 2019 & 2032
- Table 79: Global Non-Conductive Ink Market Revenue Million Forecast, by Application 2019 & 2032
- Table 80: Global Non-Conductive Ink Market Volume K Tons Forecast, by Application 2019 & 2032
- Table 81: Global Non-Conductive Ink Market Revenue Million Forecast, by Country 2019 & 2032
- Table 82: Global Non-Conductive Ink Market Volume K Tons Forecast, by Country 2019 & 2032
- Table 83: United States Non-Conductive Ink Market Revenue (Million) Forecast, by Application 2019 & 2032
- Table 84: United States Non-Conductive Ink Market Volume (K Tons) Forecast, by Application 2019 & 2032
- Table 85: Canada Non-Conductive Ink Market Revenue (Million) Forecast, by Application 2019 & 2032
- Table 86: Canada Non-Conductive Ink Market Volume (K Tons) Forecast, by Application 2019 & 2032
- Table 87: Mexico Non-Conductive Ink Market Revenue (Million) Forecast, by Application 2019 & 2032
- Table 88: Mexico Non-Conductive Ink Market Volume (K Tons) Forecast, by Application 2019 & 2032
- Table 89: Global Non-Conductive Ink Market Revenue Million Forecast, by Substrate Type 2019 & 2032
- Table 90: Global Non-Conductive Ink Market Volume K Tons Forecast, by Substrate Type 2019 & 2032
- Table 91: Global Non-Conductive Ink Market Revenue Million Forecast, by Application 2019 & 2032
- Table 92: Global Non-Conductive Ink Market Volume K Tons Forecast, by Application 2019 & 2032
- Table 93: Global Non-Conductive Ink Market Revenue Million Forecast, by Country 2019 & 2032
- Table 94: Global Non-Conductive Ink Market Volume K Tons Forecast, by Country 2019 & 2032
- Table 95: Germany Non-Conductive Ink Market Revenue (Million) Forecast, by Application 2019 & 2032
- Table 96: Germany Non-Conductive Ink Market Volume (K Tons) Forecast, by Application 2019 & 2032
- Table 97: United Kingdom Non-Conductive Ink Market Revenue (Million) Forecast, by Application 2019 & 2032
- Table 98: United Kingdom Non-Conductive Ink Market Volume (K Tons) Forecast, by Application 2019 & 2032
- Table 99: France Non-Conductive Ink Market Revenue (Million) Forecast, by Application 2019 & 2032
- Table 100: France Non-Conductive Ink Market Volume (K Tons) Forecast, by Application 2019 & 2032
- Table 101: Italy Non-Conductive Ink Market Revenue (Million) Forecast, by Application 2019 & 2032
- Table 102: Italy Non-Conductive Ink Market Volume (K Tons) Forecast, by Application 2019 & 2032
- Table 103: Rest of Europe Non-Conductive Ink Market Revenue (Million) Forecast, by Application 2019 & 2032
- Table 104: Rest of Europe Non-Conductive Ink Market Volume (K Tons) Forecast, by Application 2019 & 2032
- Table 105: Global Non-Conductive Ink Market Revenue Million Forecast, by Substrate Type 2019 & 2032
- Table 106: Global Non-Conductive Ink Market Volume K Tons Forecast, by Substrate Type 2019 & 2032
- Table 107: Global Non-Conductive Ink Market Revenue Million Forecast, by Application 2019 & 2032
- Table 108: Global Non-Conductive Ink Market Volume K Tons Forecast, by Application 2019 & 2032
- Table 109: Global Non-Conductive Ink Market Revenue Million Forecast, by Country 2019 & 2032
- Table 110: Global Non-Conductive Ink Market Volume K Tons Forecast, by Country 2019 & 2032
- Table 111: Brazil Non-Conductive Ink Market Revenue (Million) Forecast, by Application 2019 & 2032
- Table 112: Brazil Non-Conductive Ink Market Volume (K Tons) Forecast, by Application 2019 & 2032
- Table 113: Argentina Non-Conductive Ink Market Revenue (Million) Forecast, by Application 2019 & 2032
- Table 114: Argentina Non-Conductive Ink Market Volume (K Tons) Forecast, by Application 2019 & 2032
- Table 115: Rest of South America Non-Conductive Ink Market Revenue (Million) Forecast, by Application 2019 & 2032
- Table 116: Rest of South America Non-Conductive Ink Market Volume (K Tons) Forecast, by Application 2019 & 2032
- Table 117: Global Non-Conductive Ink Market Revenue Million Forecast, by Substrate Type 2019 & 2032
- Table 118: Global Non-Conductive Ink Market Volume K Tons Forecast, by Substrate Type 2019 & 2032
- Table 119: Global Non-Conductive Ink Market Revenue Million Forecast, by Application 2019 & 2032
- Table 120: Global Non-Conductive Ink Market Volume K Tons Forecast, by Application 2019 & 2032
- Table 121: Global Non-Conductive Ink Market Revenue Million Forecast, by Country 2019 & 2032
- Table 122: Global Non-Conductive Ink Market Volume K Tons Forecast, by Country 2019 & 2032
- Table 123: Saudi Arabia Non-Conductive Ink Market Revenue (Million) Forecast, by Application 2019 & 2032
- Table 124: Saudi Arabia Non-Conductive Ink Market Volume (K Tons) Forecast, by Application 2019 & 2032
- Table 125: South Africa Non-Conductive Ink Market Revenue (Million) Forecast, by Application 2019 & 2032
- Table 126: South Africa Non-Conductive Ink Market Volume (K Tons) Forecast, by Application 2019 & 2032
- Table 127: Rest of Middle East and Africa Non-Conductive Ink Market Revenue (Million) Forecast, by Application 2019 & 2032
- Table 128: Rest of Middle East and Africa Non-Conductive Ink Market Volume (K Tons) Forecast, by Application 2019 & 2032
Frequently Asked Questions
1. What is the projected Compound Annual Growth Rate (CAGR) of the Non-Conductive Ink Market?
The projected CAGR is approximately 6.00%.
2. Which companies are prominent players in the Non-Conductive Ink Market?
Key companies in the market include Poly-ink, Teikoku Printing Inks Mfg Co Ltd, SunChemical, DuPont, Vorbeck Materials, Applied Ink Solutions, Henkel Corporation, Creative Materials Inc, Nagase America LLC, NovaCentrix.
3. What are the main segments of the Non-Conductive Ink Market?
The market segments include Substrate Type, Application.
4. Can you provide details about the market size?
The market size is estimated to be USD XX Million as of 2022.
5. What are some drivers contributing to market growth?
; Increasing Demand for Printed Circuit Boards; Growing Electronic and Electrical Industry.
6. What are the notable trends driving market growth?
Increasing Demand for Printed Circuit Boards.
7. Are there any restraints impacting market growth?
; Fluctuation in Raw Material Pricing; Unfavorable Conditions Arising Due to COVID-19 Outbreak.
8. Can you provide examples of recent developments in the market?
N/A
9. What pricing options are available for accessing the report?
Pricing options include single-user, multi-user, and enterprise licenses priced at USD 4750, USD 5250, and USD 8750 respectively.
10. Is the market size provided in terms of value or volume?
The market size is provided in terms of value, measured in Million and volume, measured in K Tons.
11. Are there any specific market keywords associated with the report?
Yes, the market keyword associated with the report is "Non-Conductive Ink Market," which aids in identifying and referencing the specific market segment covered.
12. How do I determine which pricing option suits my needs best?
The pricing options vary based on user requirements and access needs. Individual users may opt for single-user licenses, while businesses requiring broader access may choose multi-user or enterprise licenses for cost-effective access to the report.
13. Are there any additional resources or data provided in the Non-Conductive Ink Market report?
While the report offers comprehensive insights, it's advisable to review the specific contents or supplementary materials provided to ascertain if additional resources or data are available.
14. How can I stay updated on further developments or reports in the Non-Conductive Ink Market?
To stay informed about further developments, trends, and reports in the Non-Conductive Ink Market, consider subscribing to industry newsletters, following relevant companies and organizations, or regularly checking reputable industry news sources and publications.
Methodology
Step 1 - Identification of Relevant Samples Size from Population Database


Step 2 - Approaches for Defining Global Market Size (Value, Volume* & Price*)

Note*: In applicable scenarios
Step 3 - Data Sources
Primary Research
- Web Analytics
- Survey Reports
- Research Institute
- Latest Research Reports
- Opinion Leaders
Secondary Research
- Annual Reports
- White Paper
- Latest Press Release
- Industry Association
- Paid Database
- Investor Presentations

Step 4 - Data Triangulation
Involves using different sources of information in order to increase the validity of a study
These sources are likely to be stakeholders in a program - participants, other researchers, program staff, other community members, and so on.
Then we put all data in single framework & apply various statistical tools to find out the dynamic on the market.
During the analysis stage, feedback from the stakeholder groups would be compared to determine areas of agreement as well as areas of divergence


